/*
Romi Jin
Section B
rsjin@andrew.cmu.edu
Project-07
*/

var x;

function setup() {
    createCanvas(480, 480);

}

function draw() {

    background(174, 198, 207);

    x = constrain(mouseX, 0, width);
    y = constrain(mouseY, 0, height);

    //three intersecting hypotrochoids

    push();
    translate(width/2, height/2);
    drawHypotrochoid();
    pop();

    push();
    translate(width/3, height/3);
    drawHypotrochoid();
    pop();

    push();
    translate(width-width/3, height-width/3);
    drawHypotrochoid();
    pop();

}

function drawHypotrochoid() {

    //link: http://mathworld.wolfram.com/Hypotrochoid.html
    //roulette by drawing along two cirles (radius a and b below)

    for (var i = 0; i < TWO_PI; i ++) {

        a = map(y, 0, height, 100, 200);
        b = map(x, 0, width, 0, 75);
        h = 100;

        x = (a - b) * cos(i) + h*cos(((a-b)/b) * i);
        y = (a - b) * sin(i) - h*sin(((a-b)/b) * i);

        noFill();
        stroke(255);
        strokeWeight(1);
        ellipse(0, 0, x, y);

    }

}
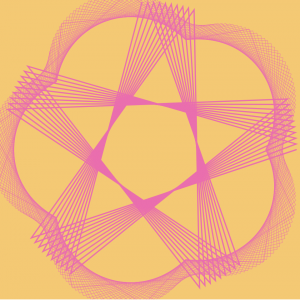
For this project, I chose the shape hypotrochoid and drew it three times to create three intersecting hypotrochoids. The parameters are the mouse X and mouse Y position, and the mouse X changes one ellipse’s radius while mouse Y changes the other. It is intriguing to watch the three intersect as they create even more curves together.
// Shirley Chen
// Section B
// junfanc@andrew.cmu.edu
// Project-07


function setup(){
	createCanvas(480, 480);
	angleMode(DEGREES);
}

function draw(){
	background(242, 186, 176);
	curveA();
	curveB();
}

function curveA(){
//Create the Fixed-Position Astroid Curve
    noFill();
    beginShape();
    var col = mouseX * 0.3;
    stroke(221, 127, col);
    translate(100, 200);
    for (var i = 0; i < mouseX/2; i ++){
//The Number of Curves Will Change According to MouseX
        LimitedMouseX = constrain(mouseX, 0, width);
        var cons = map(LimitedMouseX, 0, width, 10, 100);
//The Angle Will Change According to MouseX
        var theAngle = map(i, 0, mouseX, 20, 360);
        var x = 2 * cons * cos(theAngle) + cons * cos(2 * theAngle);
        var y = 2 * cons * sin(theAngle) - cons * sin(2 * theAngle);
        vertex(x, y);
    endShape();
//Rotate The Curves According to MouseX
    rotate(mouseX);
    }
}


function curveB(){
//Create the Moving Astroid Curve
    noFill();
    beginShape();
    var col = mouseY * 0.5;
    stroke(col, col, 110);
    translate(150, 200);
    for (var i = 0; i < mouseY*0.7; i ++){
//The Number of Curves Will Change According to MouseY
        LimitedMouseY = constrain(mouseY, 0, height);
        var cons = map(LimitedMouseY, 0, width, 10, 100);
//The Angle Will Change According to MouseY
        var theAngle = map(i, 0, mouseY, 20, 360);
        var x = 2 * cons * cos(theAngle) + cons * cos(2 * theAngle);
        var y = 2 * cons * sin(theAngle) - cons * sin(2 * theAngle);
        vertex(x, y);
    endShape();
//Rotate The Entire Astroid Curve According to MouseY
    rotate(mouseY);
    }
}
In This Project, I created a set of stable astroid curve at a fixed position and a movable set of astroid curve that keeps rotating around a center point. For the fixed set of astroid curves, the number of curves and the angle are based on the position of mouse X; for the movable set of curves, the number of curves and the angle are based on the position of mouse Y. Therefore, I used map and constrain command to limit my X and Y positions. Moreover, the colors are also changed according to the mouse X and Y. For the fixed-position set of curves, the curves inside the set is rotating according to the mouse X. For the movable set of curves, the curves inside the set and the set itself are both rotating according to the position of Y.
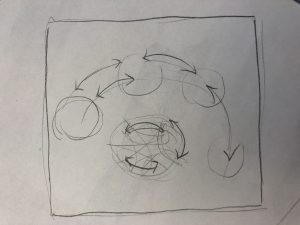
caption: Artist Nicholas Rougeux captures the conversation of music with his circular, intricate images that are in relation to the score itself.
Artist Nicholas Rougeux has been working on the project of visualizing music. He does so by scoring single instrument pieces in one color, and larger orchestrations with more colors; different parts associated with specific colors. He also correlates the position of a note on the staff with the radius of its position from the center of the circle; so lower notes on a musical staff will have a smaller radii than a higher note. Overall, its the visualization of an entire piece within a circle, its an “Off the Staff” experience. In other words, its taking a book of dots on lines and visualizing it to bring another perspective and meaning to what we hear in complex classical music. I admire this project as one gets a great sense of the voicing of a piece and the relationship between each voice. As a musician, this is a really important aspect of my career in the sense that it is the conversation with musicians around me and to the audience that matters the most. This is what the artist is ultimately trying to achieve, to break down the relationship and conversation of music that can sometimes be hard to know where to even start when you listen to it firsthand.
/*
Alexandra Kaplan
Section C
aekaplan@andrew.cmu.edu
Project - 07
*/


var nPoints = 400; // length of all for loops

function setup() {
    createCanvas(480, 400);
    background(220);
}

function draw() {
	background(150, 200, 255);
	drawStem1();
	drawEpicycloid1();
	drawCenter1();
	drawStem2();
	drawEpicycloid2();
	drawCenter2();
	drawStem3();
	drawEpicycloid3();
	drawCenter3();
}

// draws middle flower
function drawEpicycloid1() {
	var x;
	var y;
	var b = 4 + (mouseX/50); // frequency of curves
	var a = map(mouseY, 0, 400, 200, 0); // diameter of path of curve
	var h = 10 // distance from path to outer curve

	fill(220, 200, 100);
	stroke(180, 160, 60);

    beginShape();
	for (var i = 0; i < nPoints; i += 1) {
        var t = map(i, 0, nPoints, 0, 360);
        x = (a + b) * cos(radians(t)) - h * cos((radians(a + b)/ b) * t);
        y = (a + b) * sin(radians(t)) - h * sin((radians(a + b)/ b) * t);
        vertex(x + width / 2, y + mouseY);

    }
    endShape(CLOSE);
}

// draws center of middle flower
function drawCenter1(){
	fill(50);
	var centerW1 = 1
	centerW1 = map(mouseY, 0, 400, 200, 1)
	ellipse(width / 2, mouseY, centerW1, centerW1);
}

// draws middle stem
function drawStem1(){
	fill(50, 150, 50);
	stroke(20, 120, 20);
	rect(width / 2 - 5, mouseY, 10, 1000);
}

// draws left flower
function drawEpicycloid2() {
	var x;
	var y;
	var b = 3 + (mouseX / 50); // frequency of curves
	var a = map(mouseY, 0, 400, 50, 0); // diameter of path of curve
	var h = 10 // distacne from path to outer curve

	fill(220, 200, 220);
	stroke(160, 140, 160);

    beginShape();
	for (var i = 0; i < nPoints; i += 1) {
        var t = map(i, 0, nPoints, 0, 360);
        x = (a + b) * cos(radians(t)) - h * cos((radians(a+b)/ b) * t);
        y = (a + b) * sin(radians(t)) - h * sin((radians((a+b)/b) * t));
        vertex(x + width / 4, y + mouseY + 170);

    }
    endShape(CLOSE);
}


// draws left center
function drawCenter2(){
	fill(50);
	var centerW2 = 0;
	centerW2 = map(mouseY, 0, 400, 50, 1);
	ellipse(width / 4, mouseY + 170, centerW2, centerW2);
}

// draws right stem
function drawStem2(){
	fill(150, 250, 150, 150);
	stroke(100, 200, 100);
	rect(width / 4 - 5, mouseY + 170, 10, 1000);
}

// draws right flower
function drawEpicycloid3() {
	var x;
	var y;
	var b = 2 + (mouseX / 50); // frequency of curves
	var a = map(mouseY, 0, 400, 20, 0); // diameter of path of curve
	var h = 6 // distance from path to outer curve

	fill(155, 155, 250);
	stroke(130, 130, 230);

    beginShape();
	for (var i = 0; i < nPoints; i++) {
        var t = map(i, 0, nPoints, 0, 360);
        x = (a + b) * cos(radians(t)) - h * cos((radians(a + b) / b) * t);
        y = (a + b) * sin(radians(t)) - h * sin((radians(a + b) / b) * t);
        vertex(x + width - width/4, y + mouseY + 250);
    }
    endShape(CLOSE);
}

// draws right center
function drawCenter3(){
	fill(50);
	var centerW3 = 0;
	centerW3 = map(mouseY, 0, 400, 20, 0);
	ellipse(width - width / 4, mouseY + 250, centerW3, centerW3);
}

// draws right stem
function drawStem3(){
	fill(100, 200, 100, 200);
	stroke(80, 180, 80);
	rect(width - width / 4 - 5, mouseY + 250, 8, 1000);
}
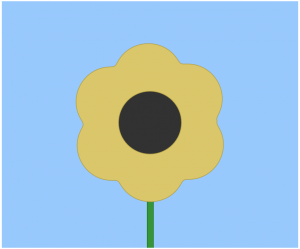
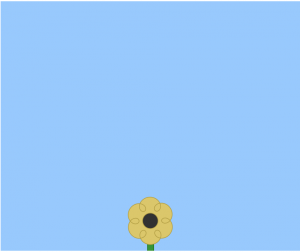
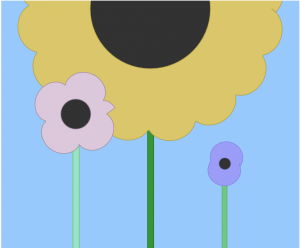
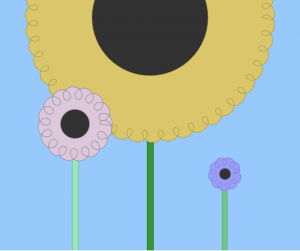
When looking at the description for this project, my mind immediately went to flowers and the different shapes of flower petals. It was pretty difficult at first to figure out how to insert the equations from the website into my code, but once I did it was fun to play around how I could then change the curves. Here are some screenshots of different x and y combinations:
// Kyle Leve
// kleve@andrew.cmu.edu
// Section A
// Project-07-Curves

var a = 40;
var b = 40;

function setup() {
    createCanvas(480, 480);
}

function draw() {
    background(255);
    translate(width/2, height/2); // Sets all the curves to the center of the canvas
    drawAstroid1(); // Draws first curve
    drawAstroid2(); // Draws second curve
    drawAstroid3(); // Draws third curve
    drawAstroid4(); // Draws fourth curve
    if (mouseX >= 0 & mouseX <= width/2) { // Makes silver side shrink/appear and red side grow/disappear
        a += -0.1 * mouseY;
        b += 0.1 * mouseY;
    }
    if (mouseX > width/2 & mouseX <= width) { // Makes red side shrink/appear and silver side grow/disappear
        a += 0.1 * mouseY;
        b += -0.1 * mouseY;
    }
}

function drawAstroid1() { // First curve
    beginShape();
    fill('red');
    for(var i = 0; i < 240 * TWO_PI; i++) { // Draws overlapping vertices to make curves
        stroke(0);
        vertex(500 * (cos(i)**a), 500 * (sin(i)**a));
    }
    endShape();
}

function drawAstroid2() { // Second curve
    beginShape();
    fill('silver');
    for(var i = 0; i < 240 * TWO_PI; i++) { // Draws overlapping vertices to make curves
        stroke(0);
        vertex(-500 * (cos(i)**b), 500 * (sin(i)**b));
    }
    endShape();
}
function drawAstroid3() { // Third curve
    beginShape();
    fill('red');
    for(var i = 0; i < 240 * TWO_PI; i++) { // Draws overlapping vertices to make curves
        stroke(0);
        vertex(500 * (cos(i)**a), -500 * (sin(i)**a));
    }
    endShape();
}
function drawAstroid4() { // Fourth curve
    beginShape();
    fill('silver');
    for(var i = 0; i < 240 * TWO_PI; i++) { // Draws overlapping vertices to make curves
        stroke(0);
        vertex(-500 * (cos(i)**b), -500 * (sin(i)**b));
    }
    endShape();
}
I found this project to be really interesting because I found myself using functions that I had not used in the past. I decided in this project that I wanted to have contrasting sides where when something was happening to one side, the opposite was happening to the other. This is what ended up happening with the silver and red sides of the canvas. When one side expands, the other shrinks and vice versa. This is due to both mouseX and mouseY however each one has their own distinct properties. MouseX controls how the two sides behave while mouseY controls the speed at which they happen. This project helped me better understand how to have separate entities behave in similar yet contrary ways.
/* Eunice Choe
Section E
ejchoe@andrew.cmu.edu
Project-07
*/

function setup() {
    createCanvas(480, 480);
    frameRate(10);
}

function draw() {
// changes color depending on mouse position
    var r = map(mouseY, 0, height, 0, 255);
    var g = map(mouseX, 0, width, 0, 100);
    var b = map(mouseY, 0, height, 0, 180);
    background(r, 200, 100);
    stroke(r, g, b);
// position of curves to the center of canvas
    translate(width / 2, height / 2);
    noFill();
    strokeWeight(2);
    drawHypotrochoid();
    strokeWeight(0.5);
    drawRanunculoid();
}

function drawHypotrochoid(){
    var x;
    var y;
    var h = constrain(width / 2, 0, mouseX / 2); // distance from center
    var a = map(mouseX, 0, width, 0, HALF_PI); // size of inner circle
    var b = map(mouseY, 0, height, 0, PI); // size of outer circle

    beginShape();
        for(var i = 0; i < width; i+=10){
            var t = i / 2;
            // equation of hypotrochoid
            x = (a - b) * cos(t) + h * cos(((a - b) / b) * t);
            y = (a - b) * sin(t) - h * sin(((a - b) / b) * t);
            vertex(x, y);
        }
    endShape();
}

function drawRanunculoid(){
    var x;
    var y;
    var h = constrain(width / 4, 0, mouseX / 4); // distance from center
    var a = map(mouseX, 0, width, 0, 12 * PI); // size of inner circle
    var b = map(mouseY, 0, height, 0, 12 * PI); // size of outer circle

    beginShape();
        for(var i = 0; i < 400; i++){
            var t = i / 2;
            // equation of ranunculoid
            x = a * (6 * cos(t) - cos(6 * t));
            y = a * (6 * sin(t) - sin(6 * t));
            vertex(x, y);
        }
    endShape();
}
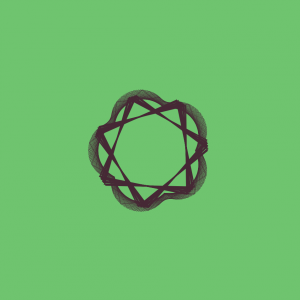
When I started this project, I was intimidated by the equations because I have not done math like this in a long time. It took me a little while to figure out how to use the for loop with the equations and the variables within them. Even though I faced some difficulties coding my first curve, which was the Hypotrochoid, I decided to add another curve called the Ranunculoid because I like how they interacted with each other. This project also helped me understand the map() and constrain() functions, which I used to control the colors and sizes of the curves. The curves when the mouse position is in the top left of the canvas.The curves when the mouse position is in the bottom right corner of the canvas.
function setup(){
	createCanvas(480,480);
}

function draw(){
	background(50);
	push();
	translate(width/2,height/2);
		push();
			for (var i = 0; i < width; i+=4) {
			translate(i,i)
			rotate(PI * mouseX/150);
			drawDevilCurve();
		};
		pop();
	pop();
}

function drawDevilCurve(){
	var range = 50;
	var b = map(mouseY, 50, height-50, 0, 50);
	var a = map(mouseX, 50, height-50, 0, 50);

	noFill();
	stroke(200);
	beginShape();
	for (var i = 0; i < range ; i++) {
		var t = map (i, 0, range, 0,  2* PI);
		var SINS = sq(sin(t));
		var COSS = sq(cos(t));
		var x = cos(t) * sqrt(((sq(a) * SINS) - (sq(b)*COSS)) / (SINS - COSS));
		var y = sin(t) * sqrt(((sq(a) * SINS) - (sq(b)*COSS)) / (SINS - COSS));
		vertex(x,y);
	}
	endShape();
}
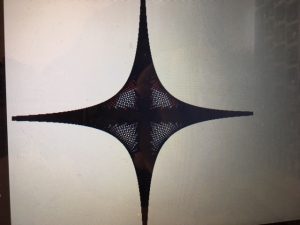
For this project, I began with a Devil’s Curve. Upon its creation, I began playing around with the different parameters of the curve to find an interesting shape. The two parameters involving the location of the mouse includes the different shape that the function would create and the location in which the curves would spiral.
Information is often presented in a form of or with an appealing visual for the audience to be interested in the subject as well as grasping the palpable information more easily. Rachel Binx is an artist and a data scientist that has built Meshu, ManyMaps, Cliffs&Coasts, Monochōme, and Gifpop which are applications used to process data and make them into presentable visuals. A art piece by Binx that attracted my attention is Facebook Stories: Virality. She explains that it is a series of video clips that visualizes a single published content on Facebook being shared and being spread across hundreds of thousands of individuals on Facebook. She has captured the speed as well as the breadth at which the content travels to be spread across the Internet. A series of branches stem from a single person to represent the contents shared by her or him. As the branches grow, they are split to show the re-shares, sometimes creating a whole new generation of re-shares, sometimes showing a short-lived burst of activity. For the project, she worked with Zach Watson to build the WebGL framework that was used to generate the visualizations. I admire the creativity and the message that she conveys through the project, which can be perceived quite alarmingly as a content published thoughtlessly may go viral just in a second and reach unimaginably distant parts of the world.
A screenshot from Rachel Binx’s Facebook Stories: Virality
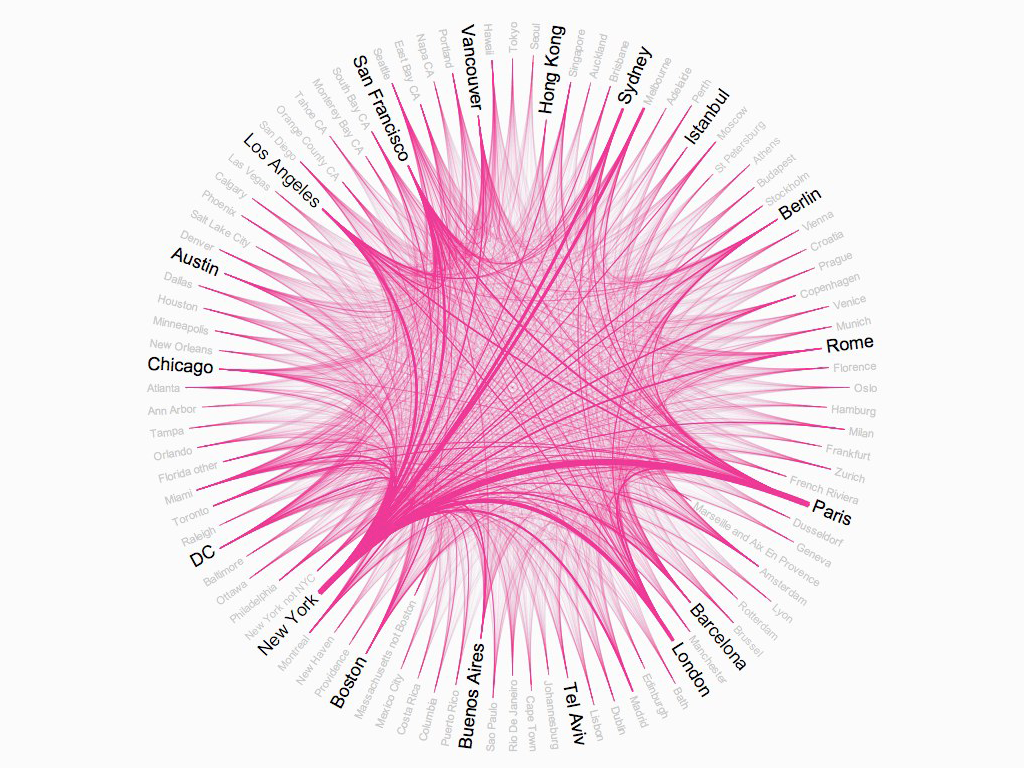
Airbnb’s Top 50 Markets / Rachel Binx / March 2011
Rachel Binx is a designer that visualizes information for a wide set of clients. This piece was created for a presentation that Airbnb’s CEO was giving on the cities which are most connected between via the app. The line weight that connects each of these locations is in proportion to the volume of trips booked from one to the other.
I feel drawn to this piece because of its relatively simple structure, but complex inner working of arc “strings”. Upon initial viewing, I get the idea that Airbnb simply reaches a large quantity of cities, as a very little proportion of viewers are going to count every city around the hub.
However, the design encourages viewers to engage in a more curious way, where they can discover these relationships without them being handed out. This “work” that the viewer does leaves the user with a sense of reward and a hint of ownership over the connections that they’ve inferred from this visualization.
This layers of interaction to this project brings Binx’s creative sensibilities into light. It is clear that Binx has an understanding of how people engage with visualized data, and what really “matters”. Every person in the room isn’t going to care that there are some x-thousand connections between one city and the other, but they may find more value in these inferetial comparisons.
/*
Connor McGaffin
Section C
cmcgaffi@andrew.cmu.edu
Project-07
*/
var nPoints = 1;
var x;
var y;

function setup() {
    createCanvas(480, 480);
}

//--------------------------
function draw() {
    background(250);
    angleMode(DEGREES);

    //top row
    push();
    rotate(1 * mouseX / 2);
    cardioids();
    pop();

    push();
    translate(width / 2, 0);
    rotate(1 * mouseX / 2);
    cardioids();
    pop();

    push();
    translate(width, 0);
    rotate(1 * mouseX / 2);
    cardioids();
    pop();

    //middle row
    push();
    translate(0, height / 2);
    rotate(1 * mouseX / 2);
    cardioids();
    pop();

    push();
    translate(width / 2, height / 2);
    rotate(1 * mouseX / 2);
    cardioids();
    pop();

    push();
    translate(width, height / 2);
    rotate(1 * mouseX / 2);
    cardioids();
    pop();

    // bottom row
    push();
    translate(0, height);
    rotate(1 * mouseX / 2);
    cardioids();
    pop();

    push();
    translate(width / 2, height);
    rotate(1 * mouseX / 2);
    cardioids();
    pop();

    push();
    translate(width, height);
    rotate(1 * mouseX / 2);
    cardioids();
    pop();


}

function cardioids(){

    var mY = constrain(mouseY, width / 4, width / 2) * .4;
    var a = mY;

    noStroke(0);

    //horiz axis
    //pink
    beginShape();
    fill('rgba(250, 100, 250, 0.6)');
    for(i = 0; i < 360; i++){
        var t = map(i, 0, nPoints, 0, nPoints);
        x = a * sin(t) * (1 - sin(t));
        y = a * cos(t) * (1 - sin(t));
        vertex(x, y);
    }
    endShape(CLOSE);
    //dark blue
    beginShape();
    fill('rgba(10, 100, 250, 0.6)');
    for(i = 0; i < 360; i++){
        var t = map(i, 0, nPoints, 0, nPoints);
        x = a * sin(t) * (1 - sin(t));
        y = a * cos(t) * (1 - sin(t));
        vertex(-x, -y);
    }
    endShape(CLOSE);

    //vert axis
    //rotate 90
    push();
    rotate(90);
    //light blue
    beginShape();
    fill('rgba(50, 150, 220, 0.6)');
    for(i = 0; i < 360; i++){
        var t = map(i, 0, nPoints, 0, nPoints);
        x = a * sin(t) * (1 - sin(t));
        y = a * cos(t) * (1 - sin(t));
        vertex(x, y);
    }
    endShape(CLOSE);
    //
    beginShape();
    fill('rgba(180, 10, 250, 0.6)');
    for(i = 0; i < 360; i++){
        var t = map(i, 0, nPoints, 0, nPoints);
        x = a * sin(t) * (1 - sin(t));
        y = a * cos(t) * (1 - sin(t));
        vertex(-x, -y);
    }
    endShape(CLOSE);

    //white hub
    //fill(250);
    //ellipse(0, 0, a * .6, a * .6);

    pop();
}
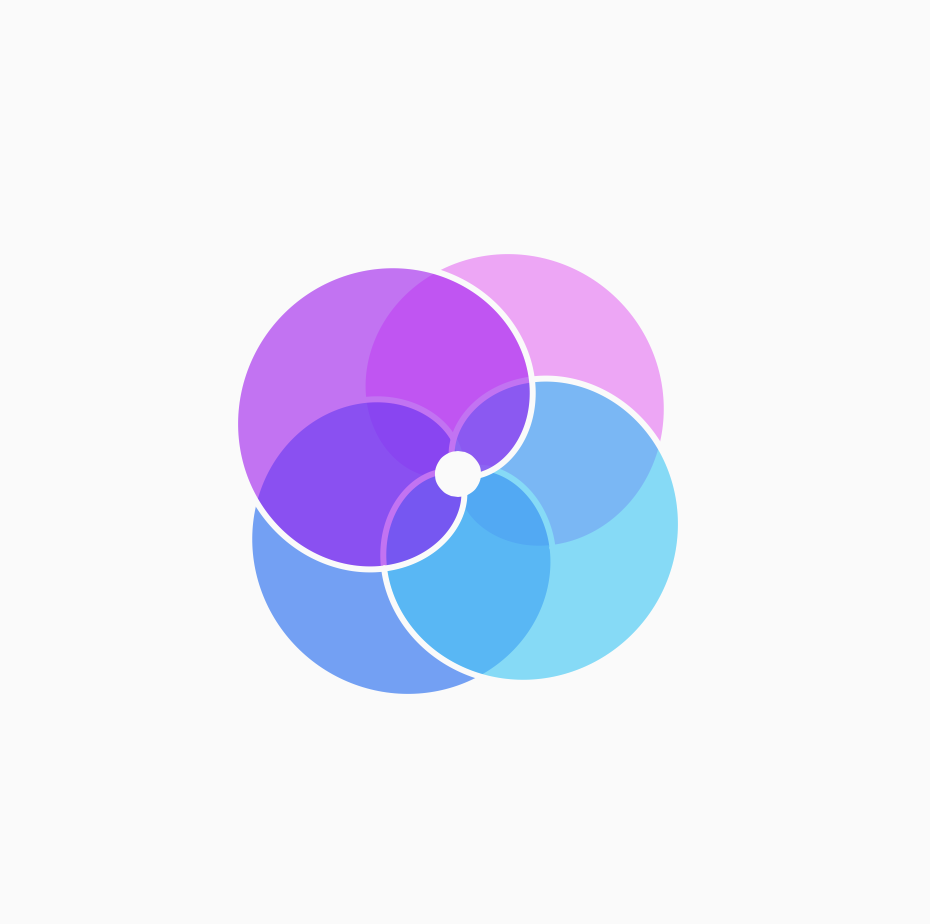
This project was tricky. I definitely would have struggled a lot more if I didn’t have the example code in the project brief, but once I found a curve I was drawn to and started plugging variables in for interaction, the project became a playful process.
I used s series of cardioid curves to create small pinwheel like elements, which I then organized in rows and columns on the screen. Moving the mouse up and down will scale the pinwheels, whereas moving side to side changes its direction.
I hope to revisit this code, because I know that there are ways to display it in a more compact way and achieve similar results. This is one of the few projects thus far that I feel genuinely proud of its final product.
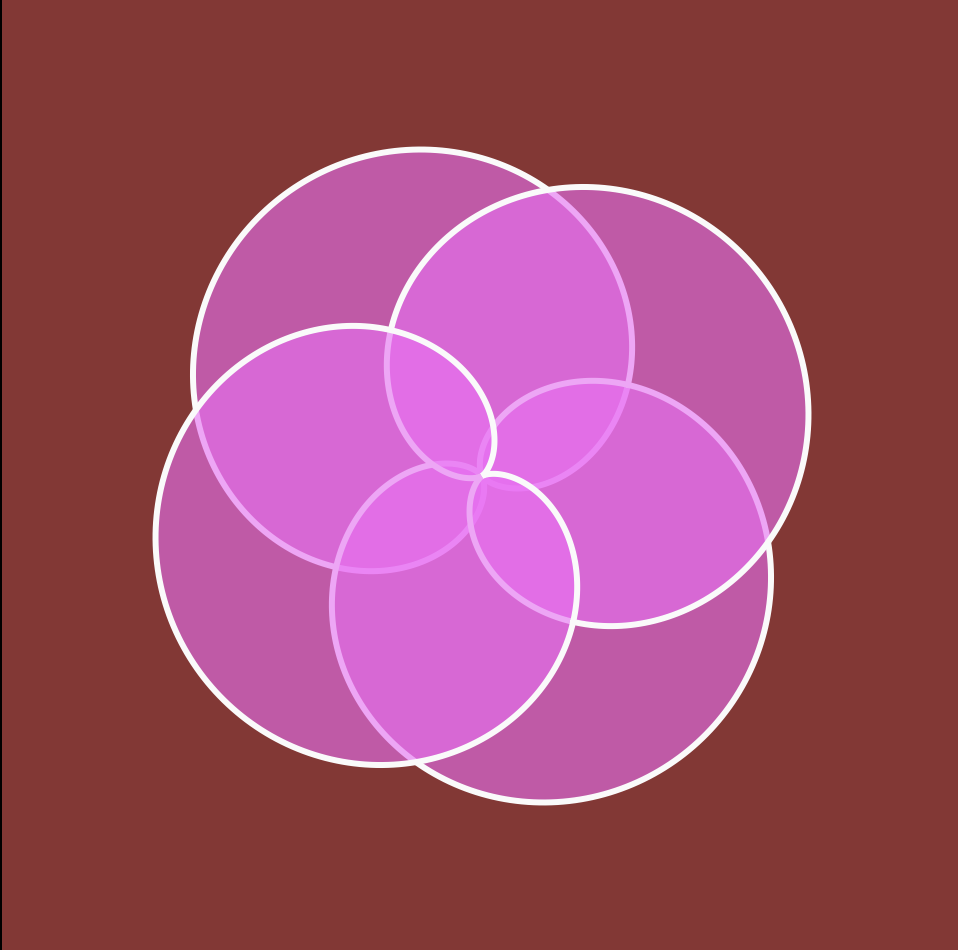
Below are screenshots of earlier iterations, when I was still figuring out color palettes and general composition of my canvas.
![[OLD FALL 2018] 15-104 • Introduction to Computing for Creative Practice](../../../../wp-content/uploads/2020/08/stop-banner.png)