Eunice Choe – Project-07 – Curves

sketch

/* Eunice Choe
Section E
ejchoe@andrew.cmu.edu
Project-07
*/

function setup() {
    createCanvas(480, 480);
    frameRate(10);
}

function draw() {
// changes color depending on mouse position
    var r = map(mouseY, 0, height, 0, 255);
    var g = map(mouseX, 0, width, 0, 100);
    var b = map(mouseY, 0, height, 0, 180);
    background(r, 200, 100);
    stroke(r, g, b);
// position of curves to the center of canvas
    translate(width / 2, height / 2);
    noFill();
    strokeWeight(2);
    drawHypotrochoid();
    strokeWeight(0.5);
    drawRanunculoid();
}

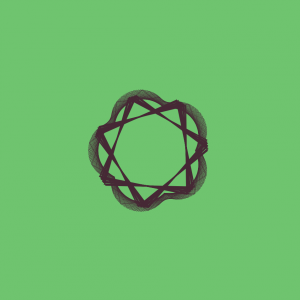
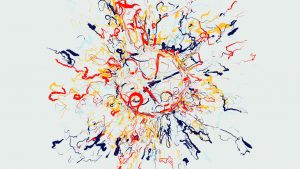
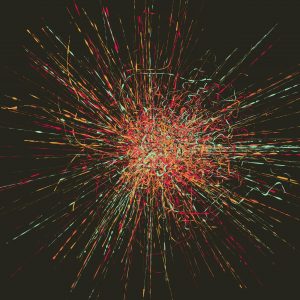
function drawHypotrochoid(){
    var x;
    var y;
    var h = constrain(width / 2, 0, mouseX / 2); // distance from center
    var a = map(mouseX, 0, width, 0, HALF_PI); // size of inner circle
    var b = map(mouseY, 0, height, 0, PI); // size of outer circle

    beginShape();
        for(var i = 0; i < width; i+=10){
            var t = i / 2;
            // equation of hypotrochoid
            x = (a - b) * cos(t) + h * cos(((a - b) / b) * t);
            y = (a - b) * sin(t) - h * sin(((a - b) / b) * t);
            vertex(x, y);
        }
    endShape();
}

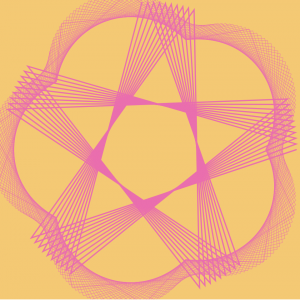
function drawRanunculoid(){
    var x;
    var y;
    var h = constrain(width / 4, 0, mouseX / 4); // distance from center
    var a = map(mouseX, 0, width, 0, 12 * PI); // size of inner circle
    var b = map(mouseY, 0, height, 0, 12 * PI); // size of outer circle

    beginShape();
        for(var i = 0; i < 400; i++){
            var t = i / 2;
            // equation of ranunculoid
            x = a * (6 * cos(t) - cos(6 * t));
            y = a * (6 * sin(t) - sin(6 * t));
            vertex(x, y);
        }
    endShape();
}

When I started this project, I was intimidated by the equations because I have not done math like this in a long time. It took me a little while to figure out how to use the for loop with the equations and the variables within them. Even though I faced some difficulties coding my first curve, which was the Hypotrochoid, I decided to add another curve called the Ranunculoid because I like how they interacted with each other. This project also helped me understand the map() and constrain() functions, which I used to control the colors and sizes of the curves.

The curves when the mouse position is in the top left of the canvas.
The curves when the mouse position is in the bottom right corner of the canvas.

Eunice Choe – Looking Outwards – 07

This chart represents the seasonal trends of the search term “apricot”. This representation highlights the the patterns.

These charts represent the charts for different fruits.

The Rhythm of Food, by Moritz Stefaner (2015) is a data visualization project that displays patterns of food seasonality based on Google search data over a span of twelve years. This project interested me because it visualizes a set of extensive data in a visually pleasing way through a radial pattern. While this representation is abstract, you can still see the patterns and peaks of food seasonality. The designer developed an algorithm that creates a radial “year clock” that represents food trends. The algorithm is set up so that the distance from the center represents relative search interest, the segments represent search interest in the weeks within the past 12 years, and the color represents the year. The creator implements his artistic sensibilities through color and rhythm. The way the trends are represented radially makes the project seem like a beautiful piece of art at first glance when it actually reflects real life data.

Eunice Choe – Looking Outwards -06

The canvas randomizes after every click.

The lines are random – some are curly and some are straight.

Matt Deslauriers, a creative developer created a generative art project (2016) that shows randomly drawn lines on a composition. In addition, clicking the canvas randomizes the composition into a new random set of lines and colors. I admire this piece because the different textured lines and splotches are visually pleasing without being too overwhelming. I also like the idea of entering a new experience with every click because of the randomized shapes and color combinations. Matt Deslauriers used Node.js to create the piece because it is reliable when working with large resolutions. Deslauriers also took inspiration from the strokes of impressionist paintings but accumulating the lines instead of constantly clearing the canvas. Simplex noise is used to make the particles move, as they are given random positions. In addition, the noise that controls the lines’ movement is randomized, which causes some lines to curl up and others to run straight. Deslauriers’ artistic sensibilities manifest in the piece through the impressionist influence and the randomized color palettes. Deslauriers based the color palettes off of popular and visually pleasing color combinations and ended up using 200 palettes in the final form.

Eunice Choe – Project-06 – Abstract Clock

sketch

/* Eunice Choe
Section E
ejchoe@andrew.cmu.edu
Project 06*/

// global variables for wheel position and size
var bigX = 160;
var bigY = 320;
var bigDiam = 200;
var smallX = 370;
var smallDiam = 70;

function setup() {
    createCanvas(480, 480);
}

function draw() {
    background(172, 201, 232);
    angleMode(DEGREES);
    var H = hour();
    var M = minute();
    var S = second();
    var cH = map(H, 0, 23, 50, width - 50);
    // sidewalk
    noStroke();
    fill(171, 184, 182);
    rect(0, 320, width, 320);
    // changing sun position depending on the hour
    // changing from sun to moon depending on time
    // 7AM to 7PM shows sun while 7PM to 7AM shows moon
    if(H < 19 & H > 7){
        noStroke();
        fill(237, 232, 73);
    } else {
        fill(88, 92, 94);
    }
    ellipse(cH, 100, 100, 100);
    // Time text
    strokeWeight(0.5);
    fill(82, 9, 6);
    textAlign(CENTER);
    text("Hour: " + H, cH, 100);
    text("Minute: " + M, smallX, 450);
    text("Second: " + S, bigX, 450);
    // thin red bike part
    strokeWeight(10);
    stroke(82, 9, 6)
    line(bigX + 110, bigY - 110, bigX + 120, bigY - 130);
    // yellow bike parts
    stroke(176, 117, 15);
    line(bigX + 30, bigY - 200, bigX + 35, bigY - 230);
    line(bigX + 35, bigY - 230, bigX, bigY - 250);
    line(bigX, bigY - 250, bigX - 20, bigY - 240);
    ellipse(bigX, bigY - 250, 10, 10);
    // bike seat
    fill(176, 117, 15);
    line(bigX + 90, bigY - 160, bigX + 120, bigY - 150);
    ellipse(bigX + 130, bigY - 150, 20, 15);
    // thick red bike parts
    stroke(82, 9, 6);
    strokeWeight(15);
    line(bigX, bigY, bigX + 30, bigY - 200);
    line(bigX + 30, bigY - 160, bigX + 120, bigY - 100);
    line(bigX + 120, bigY - 100, smallX, bigY + bigDiam / 2 - smallDiam / 2);
    // wheels
    noFill();
    strokeWeight(15);
    stroke(255, 250, 202);
    ellipse(bigX, bigY, bigDiam, bigDiam);
    ellipse(smallX, bigY + bigDiam / 2 - smallDiam / 2, smallDiam, smallDiam);
    // the rotating seconds wheel
    for(var s = 0; s < S; s++){
        push();
        translate(bigX, bigY);
        rotate(6 * s); // 60 seconds - 60 spokes
        stroke(255);
        strokeWeight(2);
        line(0, 0, 0, -100);
        pop();
    }
    // the rotating minutes wheel
    for(var m = 0; m < M; m++){
        push();
        translate(smallX, bigY + bigDiam / 2 - smallDiam / 2);
        rotate(6 * m); // 60 minutes - 60 spokes
        stroke(255);
        strokeWeight(1);
        line(0, 0, 0, -35);
        pop();
    }

}

My abstract clock is a bicycle with the big wheel representing seconds, the small wheel represent minutes, and the sun/moon representing the hour. For the second and minute wheels, new spokes appear after every second/minute passes. From 7AM to 7PM, the sun is yellow and from 7PM to 7AM the circle turns gray to represent the moon. In addition, the position of the sun/moon changes depending on what time it is.

I came up with the idea of a bike because of the two circular shapes I could work with to represent minutes and seconds. I had to get a little creative to represent the hours, so I chose to use something in the background. The abstract clock was difficult to figure out at times, but overall I feel better about applying rotation and for loops into my code.


The bike in day time and night time.

Eunice Choe – Project-05 – Wallpaper

sketch

/* Eunice Choe
Section E
ejchoe@andrew.cmu.edu
Project-05
*/

function setup() {
    createCanvas(480, 480);
    background(116, 124, 181);
    var ws = 80; // width spacing
    var hs = 50; // height spacing

    for (var y = 0; y < 11; y++) {
        for (var x = 0; x < 7; x++) {
            if (y % 2 == 1){ // even rows with coffee beans
                var py = y * hs;
                var px = (ws / 2) + x * ws; // offset shift to the right by half of width spacing
                stroke(76, 44, 15);
                ellipse(px, py, 10, 5);
                ellipse(px + 10, py + 5, 5, 10)
                ellipse(px, py + 10, 5, 10);

            }
            else { // odd rows with coffee mugs
                var py = y * hs;
                var px = x * ws;
                // cream colored mug shape
                noStroke();
                fill(255, 242, 196);
                arc(px, py, 60, 80, 0, PI, CHORD);
                arc(px + 20, py + 15, 30, 20, 10, HALF_PI);
                // brown mug outline
                stroke(178, 154, 119);
                strokeWeight(4);
                noFill();
                arc(px - 8, py, 60, 80, 0, PI, CHORD);
                // zig zag steam lines
                stroke(255);
                strokeWeight(3);
                line(px - 20, py - 10, px + 15, py - 12);
                line(px + 15, py - 12, px - 15, py - 16);
                line(px - 15, py - 16, px + 10, py - 20);
                line(px + 10, py - 20, px - 5, py - 30);
            }
        }
    }
    noLoop();
}

For my wallpaper project, I decided to created a pattern that alternated coffee mugs and coffee beans. I was inspired to create the mug pattern after seeing a wallpaper online. With the repeating pattern, I was interested in seeing how the mugs and coffee beans turned somewhat abstract over time. I originally did not intend to abstract the mugs, but I actually like how they look in the final result! I like the idea of someone looking twice at the wallpaper before realizing what the pattern is. Overall, this project was good practice for using nested for loops.

Eunice Choe – Looking Outwards-05

These are three icebergs from the series.

Chaotic Atmospheres, a Switzerland based 3D artist created beautiful renditions of icebergs in his series titled, Caustic Icebergs (2013). I admire this series because the icebergs are very aesthetically pleasing and the artist does a great job of displaying an environment with grace and drama. While all the icebergs appear to be similar, the subtle differences between them allow the viewer to see new compositions that can stand alone. Chaotic Atmospheres used Acropora, which is a voxel modeler by Voxelogic, to create the icebergs. The icebergs all started off from a base, but the artist changed the parameters to make each iceberg unique. The artist also utilized the rendering software, Vue for the glowing water and sky. Chaotic Atmospheres incorporates his artistic sensibilities in the series through his attention to detail and ability to capture a scene in nature in a very realistic and captivating way. The artist’s use of color and various textures can undoubtedly catch someone’s attention.

The artist incorporates a glowing effect to the icebergs and sky.

Eunice Choe – Looking Outwards-04

Sonami-MagneticMemories-ex from sonami on Vimeo.

Laetitia Sonami is a sound artist who incorporates technology and media to her sound installations. Sonami’s piece, Magnetic Memories (2016) interested me because of its spontaneity. Sonami uses an instrument called the Spring Spyre and it consists of a multitude of neural networks. The algorithms involved in this installation seem to be random and full of surprises because the audio signals that are fed to the neural networks are in real time. The neural networks are not defined and trained, so any audio signal is from a sound that is played in the moment. The sounds have a wide range, from eerie to alert sounds. Sonami manifests her own artistic sensibilities by giving off a sense of depth through her music. Through magnetic forces, Sonami’s instrument produces several layers through sound that enhance the audience’s overall listening experience.

Sonami playing the Spring Spyre at Filodrammatica.

Eunice Choe – Project-04 – String Art

sketch

/*Eunice Choe
Section E
ejchoe@andrew.cmu.edu
Project-04*/

// global variables to create curves
var spacing = 4;// spacing between the strings
var x1 = 0;
var y1 = 300;
var x2 = 400;
var y2 = 0;


function setup() {
    createCanvas(400, 300);
    // background(0);
}

function draw() {
    // changing color of strings depending on mouseX and mouse Y position
    background(255);
    strokeWeight(0.2);
    var r = map(mouseX, 0, width, 100, 255);
    var g = map(mouseY, 0, width, 200, 255);
    var b = map(mouseX, 0, height, 0, 100);
    for (var i = 0; i < width; i++){
    // outermost section of strings
        stroke(r, g, b);
        line (x1, spacing * i, spacing * i, y1); // bottom left
        line (x2, spacing * i, spacing * i, y2); // top right
        line (spacing * i, y1, x2, height - spacing * i); // bottom right
        line(x1, height - spacing * i, spacing * i, y2); // top left
    // innermost section of strings
        stroke(g, r, b);
        line (x1 + 100, spacing * i, spacing * i, y1 - 100); // inner bottom left
        line (x2 - 100, spacing * i, spacing * i, y2 + 100); // inner top right
        line (spacing * i, y1 - 100, x2 - 100, height - spacing * i); // inner bottom right
        line(x1 + 100, height - spacing * i, spacing * i, y2 + 100); // inner top left
    // middle section of strings
        stroke(r, b, g);
        line (x1 + 50, spacing * i, spacing * i, y1 - 50); // middle bottom left
        line (x2 - 50, spacing * i, spacing * i, y2 + 50); // middle top right
        line (spacing * i, y1 - 50, x2 - 50, height - spacing * i); // middle bottom right
        line(x1 + 50, height - spacing * i, spacing * i, y2 + 50); // middle top left
        }
}

For my string art project, I wanted to create a series of repeating curves overlapped on top of each other. I liked the appearance of having several thin strings that create sheer and transparent colors. I did have some difficulties figuring out how to use the for loop and coordinates, but later I realized the loop makes life much easier!

Eunice Choe – Project-03

sketch

/*Eunice Choe
Section E
ejchoe@andrew.cmu.edu
Project-03*/

var sunD = 70;
var skyR = 65;
var skyG = 82;
var skyB = 97;
var cloudD = 100;
// heat waves
var diam = 50;
var dir = 1;
var speed = 2;
// ferris wheel
var ferrisDiam = 350;
var ferrisCarDiam = 50;
// ferris wheel base
var baseDiam = 100;

function setup() {
    createCanvas(480, 600);
}

function draw() {

// background changing from dark to light - changing color
    background(skyR, skyG, skyB);
    skyR = map(mouseY, 0, height, 187, 65);
    skyG = map(mouseY, 0, height, 222, 82);
    skyB = map(mouseY, 0, height, 255, 97);
// sun & cloud moving with mouse - changing position
    noStroke();
    fill(247, 225, 136);
    var m = constrain(mouseY, 380, 0);
    var q = constrain(mouseY, 150, 0);
    ellipse(m, constrain(mouseY, 100, height), sunD, sunD);
    fill(255, 255, 255);
    ellipse(q, constrain(mouseY, 150, height), cloudD, cloudD);
    ellipse(q + 50, constrain(mouseY, 150, height), cloudD * .85 , cloudD * .85);
    ellipse(q - 60, constrain(mouseY, 150, height), cloudD * .5 , cloudD * .5);
// heat waves from sun - changing size
if (mouseY < 100){
    push();
    stroke(255);
    noFill();
    ellipse(380, 100, diam, diam);
    ellipse(380, 100, diam*1.5, diam*1.5);
    ellipse(380, 100, diam*2, diam*2);
    pop();
    diam += dir * speed;
    if (diam > 300){
      diam = 0;
    }
}
// ground
    noStroke();
    fill(177, 177, 177);
    rect(0, 400, width, height);
// ferris wheel base
    push();
    fill(183, 103, 44);
    ellipse(width / 2, height / 2, baseDiam, baseDiam);
    strokeWeight(20);
    stroke(183, 103, 44);
    line(width / 2, height / 2, 380, 550);
    line(width / 2, height / 2, 100, 550);
    pop();
// ferris wheel
    push();
    stroke(183, 103, 44);
    strokeWeight(10);
    noFill();
    ellipse(width / 2, height / 2, ferrisDiam, ferrisDiam);
    pop();
// ferris wheel spokes
    push();
    translate(width / 2, height / 2);
    stroke(183, 103, 44);
    strokeWeight(3);
    rotate(millis() / mouseX / 6);
    line(ferrisDiam / 2, 0, 0, 0);
    line(-ferrisDiam / 2, 0, 0, 0);
    line(0, ferrisDiam / 2, 0, 0);
    line(0, -ferrisDiam / 2, 0, 0);
    pop();
// ferris wheel cars
    push();
    fill(202, 87, 87);
    translate(width / 2, height / 2);
    rotate(millis() / mouseX / 6); // changing speed depending on mouseX position
    ellipse(ferrisDiam / 2, 0, ferrisCarDiam, ferrisCarDiam);
    fill(93, 87, 202);
    ellipse(-ferrisDiam / 2, 0, ferrisCarDiam, ferrisCarDiam);
    fill(189, 118, 222);
    ellipse(0, ferrisDiam / 2, ferrisCarDiam, ferrisCarDiam);
    fill(87, 202, 101);
    ellipse(0, -ferrisDiam / 2, ferrisCarDiam, ferrisCarDiam);
    pop();


}

This project was really difficult for me, but I had fun experimenting with different variables. I wanted to incorporate movement with a spinning circle so I created a moving ferris wheel. I also chose to show contrast with the day/night theme and the varying speeds of the ferris wheel.

Eunice Choe – Looking Outwards-03

The dome in the process of being built. The structure was printed in 13.5 hours.

The DCP uses robotic arms to build the structure.

The Hemi-ellipsoidal Dome (2016/ongoing) is a 3D printed structure that was fabricated using the Digital Construction Platform by Mediated Matter. I admire this architectural structure because it shows that 3D printed technology can be used for large-scale structures as well as small scale structures. I admire Mediated Matter’s ability to solve problems while stretching the bounds of an existing technology. For instance, this structure was created using a Print-in-Place construction technique which prints molds of structures and has the potential to use materials, time, and money more efficiently. Regarding the algorithms used to build the structure, the dome uses the Print-in-Place technique and the Digital Construction Platform, which is a technology that utilizes robotic arms to construct the building. This technology has developed over time to be more sensitive to real time feedback and the mobility of the arms. The designers’ artistic sensibilities are evident in the dome, as seen through their inspiration from the geometry and form of a hemi-ellipsoid. Other structures built from this technology can show glimpses of creative architectural freedom because it can rapidly create non-traditional structures like the dome, which was printed in 13.5 hours.