/* Eunice Choe
Section E
ejchoe@andrew.cmu.edu
Project-07
*/

function setup() {
    createCanvas(480, 480);
    frameRate(10);
}

function draw() {
// changes color depending on mouse position
    var r = map(mouseY, 0, height, 0, 255);
    var g = map(mouseX, 0, width, 0, 100);
    var b = map(mouseY, 0, height, 0, 180);
    background(r, 200, 100);
    stroke(r, g, b);
// position of curves to the center of canvas
    translate(width / 2, height / 2);
    noFill();
    strokeWeight(2);
    drawHypotrochoid();
    strokeWeight(0.5);
    drawRanunculoid();
}

function drawHypotrochoid(){
    var x;
    var y;
    var h = constrain(width / 2, 0, mouseX / 2); // distance from center
    var a = map(mouseX, 0, width, 0, HALF_PI); // size of inner circle
    var b = map(mouseY, 0, height, 0, PI); // size of outer circle

    beginShape();
        for(var i = 0; i < width; i+=10){
            var t = i / 2;
            // equation of hypotrochoid
            x = (a - b) * cos(t) + h * cos(((a - b) / b) * t);
            y = (a - b) * sin(t) - h * sin(((a - b) / b) * t);
            vertex(x, y);
        }
    endShape();
}

function drawRanunculoid(){
    var x;
    var y;
    var h = constrain(width / 4, 0, mouseX / 4); // distance from center
    var a = map(mouseX, 0, width, 0, 12 * PI); // size of inner circle
    var b = map(mouseY, 0, height, 0, 12 * PI); // size of outer circle

    beginShape();
        for(var i = 0; i < 400; i++){
            var t = i / 2;
            // equation of ranunculoid
            x = a * (6 * cos(t) - cos(6 * t));
            y = a * (6 * sin(t) - sin(6 * t));
            vertex(x, y);
        }
    endShape();
}
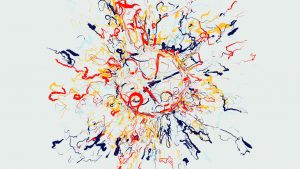
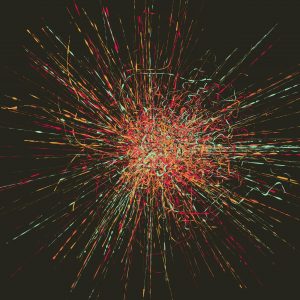
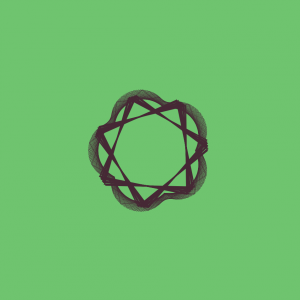
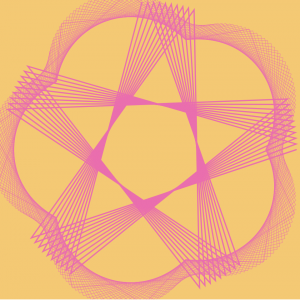
When I started this project, I was intimidated by the equations because I have not done math like this in a long time. It took me a little while to figure out how to use the for loop with the equations and the variables within them. Even though I faced some difficulties coding my first curve, which was the Hypotrochoid, I decided to add another curve called the Ranunculoid because I like how they interacted with each other. This project also helped me understand the map() and constrain() functions, which I used to control the colors and sizes of the curves.
![[OLD FALL 2018] 15-104 • Introduction to Computing for Creative Practice](../../../../wp-content/uploads/2020/08/stop-banner.png)
