![[OLD FALL 2018] 15-104 • Introduction to Computing for Creative Practice](../../../../wp-content/uploads/2020/08/stop-banner.png)

Nicholas Feltron is a designer and artist whose work centers around exploring different ways of information visualization and translating data into meaningful and digestible experiences. He is widely known for his multi year project, the personal annual reports. In this personal annual reports, he summarizes his yearly activities in a series of graphic representations. These statistics track his living habits such as amount of time spent sleeping, working, relaxing, etc. as well as information about the external environment such as weather. I found out about him last year through my design professors and I was really interested in how he used Processing to map out his information in a visually interesting way. Since he collects a ton of information everyday, he uses coding to filter out unnecessary data and find patterns within the data. I really enjoy the layout and visual elements of his annual reports; they are very readable and easy to understand. It’s interesting seeing him map out his own behaviors as well as the environment’s behaviors through bar graphs, population density clusters, and other information visualization techniques. In addition, it is also really easy for viewers to jump to specific sections of his report since there is an overwhelming amount of information throughout the entire report. His use of colors unify his report and adds emphasis to the information he wants to highlight. All in all, Feltron’s annual reports demonstrate the effectiveness of creative coding while maintaining good design conventions for optimal information digestion. As a piece of design, I think it is very interesting and effective, however, his reports don’t really explore the aesthetics of information visualization as much. There are probably much more interesting and fun ways of visualizing the data in his annual report. But, I really enjoy this for the content of the work rather than the aesthetics, and I think it is really interesting seeing someone’s life represented through numbers, graphs, and text.
Category: LookingOutwards-07
Sharon Yang Looking Outwards 07 Information Visualization
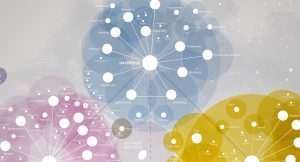
Information is often presented in a form of or with an appealing visual for the audience to be interested in the subject as well as grasping the palpable information more easily. Rachel Binx is an artist and a data scientist that has built Meshu, ManyMaps, Cliffs&Coasts, Monochōme, and Gifpop which are applications used to process data and make them into presentable visuals. A art piece by Binx that attracted my attention is Facebook Stories: Virality. She explains that it is a series of video clips that visualizes a single published content on Facebook being shared and being spread across hundreds of thousands of individuals on Facebook. She has captured the speed as well as the breadth at which the content travels to be spread across the Internet. A series of branches stem from a single person to represent the contents shared by her or him. As the branches grow, they are split to show the re-shares, sometimes creating a whole new generation of re-shares, sometimes showing a short-lived burst of activity. For the project, she worked with Zach Watson to build the WebGL framework that was used to generate the visualizations. I admire the creativity and the message that she conveys through the project, which can be perceived quite alarmingly as a content published thoughtlessly may go viral just in a second and reach unimaginably distant parts of the world.
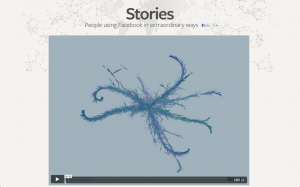
A screenshot from Rachel Binx’s Facebook Stories: Virality
Kai Zhang-Looking Outwards-07
Fathom
Fathom is a database analysis platform that understands data and converts them into a visualization form. There are various facets of the data analyzation happening within this platform.
Partnering with State Street, they built a visualization depicting the scale, growth, and complexity of 200 years of finance. Fathom combed through a database of 40,000 financial indicators and built prototypes to dig into selected data. Of the many possible stories to tell, they focused on four facets of growth: data, connectivity, complexity, and scope.


They also have partnership with On Being to create new ways of understanding the 14 years of diaglogs archived in the database. By doing this can help with On Going’s pattern of conversation happened and used visual representation that links the useful information of the same categories that for the purpose of developing new methodologies.
The part that fascinates me about this platform is how it’s super flexible about the utility in different fields of practice. The developers are devoted to create easier to understand database “translator” that everyone is able to understand to help people get the most out of their data. The data are most useful when it’s more straitforward and easeir to understand. The methodologies introduced is very meaningful for the evolution of database management in firms.
Jisoo Geum – Looking Outwards 07
Interstitial Fragment Processor (2007) – Goland Levin
link: http://www.flong.com/projects/ifp/
Interstitial Fragment Processor is an interactive system that maps and visualizes the negative space created by our bodies. The sensor records and collects data from the silhouette of people’s body, and then animates shapes that are based on the holes created from the silouette. The shapes in the screen eventually fall down and create sound effects as it hits the bottom of the screen. Although the artist Goland Levin has numerous other works that are based on interaction design and physical computing, I found Interstitial Fragment Processor the most interesting due to its sound element. Also, I thought that the idea of visualizing and mapping the shapes of our body was a unique topic within the category of data art. I also think the artist’s vision of creating works that provide rich interactive experience is best represented through Interstitial Fragment Processor since the software urges people to make different poses in order to see more of the artwork. The artistic sensibilities are best portrayed through the sound and animation in this work since these features effectively emphasize the physical and sensible nature of the work. In terms of algorithms, the artist built a spontaneous performance system for audiovisual improvisations and a synthetic visualization of the mass created by our body. The software can somewhat accurately outline the negative space of our bodies even when they are constantly moving, which is why I appreciate the building of this system.
Universo de Emociones // PalauGea
The Universe of Emotions project by PalauGea is a data visualization project based on the concept of emotions as a cosmic network of elements. By visualizing these emotions, PalauGea hopes to help people understand their moods. This graphic map teaches emotional intelligence.
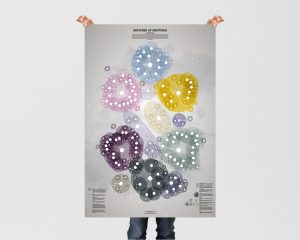
Graphic Map, Universo de Emociones, PaluaGea
There are a total of 307 emotions represented, as well as documented in their text, Dictionary of Affective Emotions and Phenomena. The emotions are then structured into four levels based on their degree of importance, starting largely with 6 main emotional basins.
The universe is the entirety of space, time and any form of substance and energy. – Eduard Punset
Not only is the project aesthetically beautiful, but it is rich in information. There are multiple layers at which the data begins to interact which in turn creates the possibility of more inferences or perspectives.
As these emotions begin to develop relationships between each other, they are grouped into trios, creating different triangulations. These relationships show their interrelated properties.
Detail: Graphic Map zoom, Universo de Emociones, PaluaGea
By using algorithms based on cosmic properties such as the idea of the circle and the halo, which are key qualities of our galaxy, the Milky Way. These networks, inspired by a system we are already familiar with, helps to create a salient visualization.
Read more about the project here!
Philip Gates – Looking Outwards 07
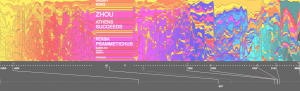
Santiago Ortiz – History Words Flow (2014)
http://moebio.com/research/historywordsflow/
I am interested not only in history, but in how we choose to engage with our history: what sticks out as important after many years? What gets emphasized? What gets forgotten?
Ortiz’s information visualization is exciting to me because it depicts exactly this: not an objective history, but an extremely subjective one, using the frequency of words in Wikipedia entries about a specific period of time as a measure. Since Wikipedia is constantly updated, this graphic is a means of representing what, at this moment, the English-speaking internet community views as the most salient details of history stretching back for millennia, and what we imagine our future to be as well.
Though no information is provided on the computational techniques Ortiz used, I imagine he has written an algorithm that scrapes Wikipedia pages and finds the words that occur with the greatest frequency. These then get a colored band proportional to their frequency. The colors Ortiz has chosen presumably speak to his own artistic sensibility, and his own subjectivity is evident in the periods of time he’s chosen to depict (when he switches from centuries to decades to years, etc).
Looking Outwards 07 – Min Lee
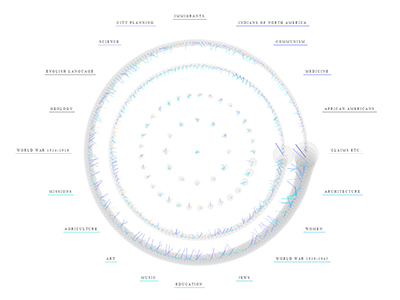
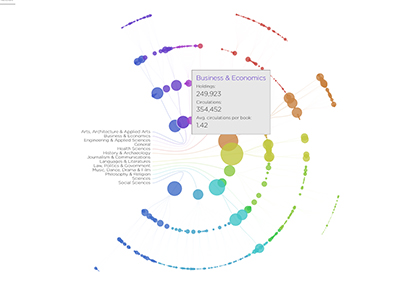
The Library Project created by Spacial Information Digital Lab is a digital interface for browsing all collections and connections at the Columbia University Library in a very visible way. It allows for easy browsing that invites curiosity in the readers. The reason this project stood out to me is its amazingly futuristic UI design. It’s the first step to a modern and forward-looking design for educational purposes. What I particularly admire is the institution’s design choices to make an interface that motivates readers. I could imagine this being a standard piece of technology used for education in the next decade or so.
Source: http://www.visualcomplexity.com/vc/project_details.cfm?id=967&index=967&domain=
Jenna Kim (Jeeyoon Kim)- Looking Outwards-7
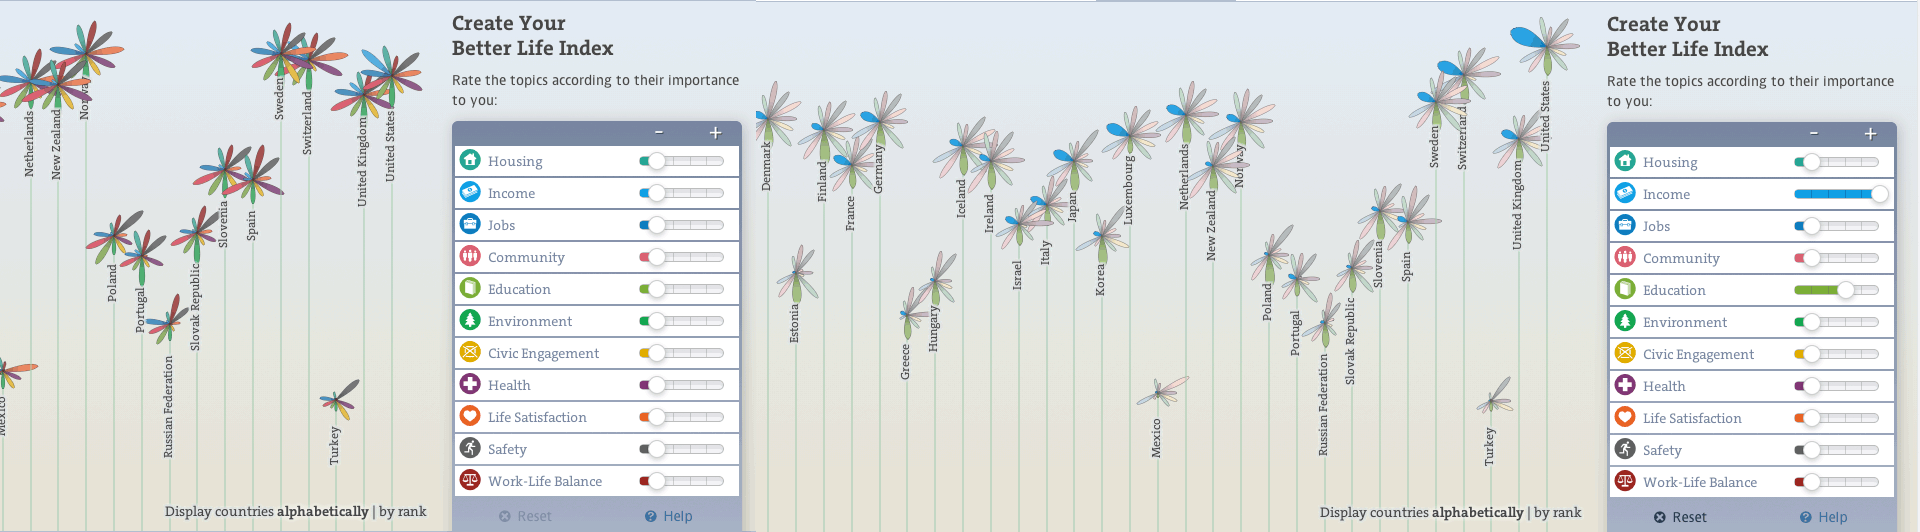
OECD Better life Index, a project by Moritz Stefaner, is a data visualization project that compares the well being of the world based on GDP. The purpose of this way to demonstrate the ranking of the world based on data visualization is to promote and brand OECD as a whole. Your Better Life Index helps the users compare the factors that relate to the GDP: education, environment, education, standard of living, and many more. The index as a whole is an interactive data visualization in which the height of the flower represents the total score of the country. Also, each length of the petal represents the topics like income, jobs, education, health, safety and many more. Therefore, the height of the flower becomes taller if the total score rises up, and the length of each petal becomes longer if the rating of the topic is higher than before. Users can also control the rates of the topics based on what they think is important to their lives. I admire this project because this project really thinks about the users and what they would be interested while using this data visualization. User/ Human centered Design, a creative method of problem solving and having strong ties with human perspective. is one of the most important topics we design students are learning through the CMU design. This project by Stefaner blends this major design concept well with how to make data visualization, one of the topics in 104. The algorithm that generated the work required various tools such as webpack, react, Material UI, and many more. He explored different design tools, and coded to make the final product. His artistic sensibilities are demonstrated in both the process work and the final work. He tried different colors and forms/ shapes to find the right fit for OECD. He looked for shapes and colors that users can view the brand as friendly and organic.
LINK: http://truth-and-beauty.net/projects/oecd-better-life-index
–> Shows the code and the design.
Catherine Coyle – Looking Outwards – 07
Information visualization can make a huge difference in how viewers feel about certain data and how it comes across. For this week, I decided to do my looking outwards post on the Fitbit CES animations done by Rachel Binx. She was one of the designers that was recommended on our website and I like her work a lot.
Fitbit Animations from Rachel Binx on Vimeo.
Above is a preview of her animations for this project.
For this work, I assume that she was given heart-rate/Fitbit data to work from and made these clean looking animations to visualize it. I would assume that the algorithms behind it are basic because it is mostly displaying different charts and numbers, rather it is the art that accompanies it that makes the work admirable. She wrote the animations so that they feel very smooth and fit the ‘Fitbit’ general aesthetic which I admire a lot.
Looking Outwards-07 Information Visualization-Veronica Wang
Impact of sporting events on the local economy in Hammersmith and Fulham from Habidatum on Vimeo.
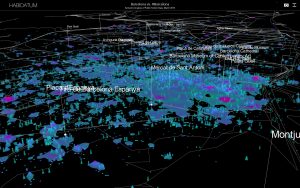
I’ve always been following and interested in Habidatum’s works. They are a data analytics and consulting group that combines multiple layers of GIS data and visualize them in a custom software called Chronotope. They provide simple and easy to understand graphics to convey space-time data and their works had been applied to architecture, master planning, financial, transportation and many other fields. They believe that “by transforming contemporary planning strategies into data-driven adaptive policies, cities and businesses can generate savings, profits and opportunities.”
I think their work is incredible in how it helps the audience grasp multiple layers of data in a straightforward way, and how they can help their clients make informed decisions of their investments that can affect the city’s urban fabric.