Vicky Zhou – Looking Outwards – 08

Mouna Andraos is a co-founder of Daily Tousles Jours — a design studio that explores storytelling and collaboration of environments through technology. Mouna’s studio is based in Montreal, and she holds a Masters degree from New York University’s Interactive Telecommunications Program (ITP), and a Bachelors degree from Concordia University, In addition to running her design studio, she is also currently teaching at Concordia University and UQAM’s École de Design.

The works of Daily Tousles Jours utilizes many forms of technology, such as sensors, phones, real-time and interactive data, and physical prototypes to encourage and facilitate collaboration and performance in public spaces. For example, one of their best known works is “21 Balançoires”, which is set up yearly in Quartier des Spectacles in Montreal. “21 Balançoires” is a row of 21 swings that span down a popular sidewalk in the middle of the city. Each swing plays a different note when in motion, and thus a melody is created when several people are collaboratively swinging together. I really admire this sort of interactive installation because it encourages users of all ages, demographics, backgrounds, etc. to come together and create an experience that would never be able to be created alone.

Throughout their presentation, Mouna and Melissa Mongiat provide thorough definitions for words at the start of major concepts and/or ideas they present, and also provide a lot of interesting videos and visualizations of what their projects encompass. I feel like these are effective in communicating their ideas, especially since their projects often touch upon several different thresholds, mediums, and materials.

Daily Tousles Jours Website

Emily Zhou – Looking Outwards – 08

Adam Harvey is an artist and researcher based in Berlin. His works focuses on the societal impacts of networked data analysis technologies and computer vision and counter-surveillance in particular. Adam graduated from the Interactive Telecommunications Program at New York University (2010) and previously studied engineering and photojournalism at the Pennsylvania State University.


The Electromagnet Spectrum of Counter/Surveillance – Adam Harvey, Eyeo 2014

Being a strong advocate of privacy and freedom of expression, his body of work is mainly comprised of various soft and hard counter-surveillance technologies. My favourite project of his is the Privacy Gift Shop––a pop-up store at the New Museum that sells counter-surveillance items developed by Harvey. A product example is the OFF Pocket––a faraday cage phone case that blocks all wireless signals (e.g. tracking, eavesdropping) from reaching your phone. I admire this project because he brings technological social concerns to the forefront in a creative and engaging way.

OFF Pocket V1

In his talk, Adam begins by defining the terms “surveillance” and “privacy”. He shows examples of their importance and scope of impact. I think this was extremely powerful in framing the rest of his talk, especially when it came to his own work and contributions in pro-privacy and anti-surveillance.

Alice Fang – Looking Outwards – 08

Eyeo 2014 – Mike Bostock from Eyeo Festival on Vimeo.

Mike Bostock is a data-visualization specialist, and was an interactive graphics designer for The New You Times. He is also a developer of D3.js, which is a javascript library that is used for visualizing data. He graduated in 2000 with a BSE in computer science from Princeton University.

Many of the projects on his portfolio website are visualizations of data for The New York Times, with topics ranging from “Mapping every Path to the N.F.L Playoffs” to “Drought and Deluge in the Lower 48.” He combines his interest and passion for interactive visualization and animation with his knowledge of coding, to create very visually compelling images that aim to make learning and teaching abstract concepts more intuitive. I admire the simplicity in a lot of its work, and the consideration he has for human factors, like how people intake and react to the information, something which translates in his presentation as well.

Visualization of QuickSort, from his Eyeo Talk in 2014
His presentation on “Visualizing Algorithms” helped me understand different types of sorting algorithms through quick animation, in a way that just looking at code would have made difficult. He also addresses some tricky questions: how much visualization is too much, to the point where it overwhelms the viewer? I think his work is very applicable to design, where similar considerations have to be made about the best way to communicate ideas.

Carley Johnson Looking Outwards 08

These are the women whose art I got inspired by this week. They are Mouna and Melissa, the founders of Daily Tous Les Jours, which works in connection, physicality and pushing people to act past social boundaries (ie, dancing in the streets). They are both from Montreal but do work all over the United States and Canada, both indoors and outdoors. My favorite project of there’s is called Choreographie pour humans et les etoiles (Choreography for humans and stars) wherein the goal was to get people to dance and become celestial bodies. A camera gave them instructions (hold hands and lean out while spinning in a circle as fast as you can) and then captured the motion and translated it into a beautiful universe graphic on the screen. It was cool to see strangers getting together and laugh at themselves being silly. I feel like the world needs more of that. Their presentation was alright. The footage of their projects and them projects themselves were really interesting, but they weren’t that engaging. They tried to inject a few jokes in there that were really dry, and even though there were two of them, they didn’t play off of each other very well. Really fun and sweet projects though!

Website link:

http://www.dailytouslesjours.com/

Elena Deng-Project 7-Curves

sketch
This project was quite difficult for me to execute. With the link provided I was able to look at different algebraic functions and graphs; however, once I looked at the mathematical
functions themselves I got really confused. Overall, I am not really proud of this project and hope to be able to incorporate mathematical functions into my code in the future.

/*Elena Deng
Section E
  edeng1@andrew.cmu.edu
  Project-07
}
*/

var nPoints=100

function setup() {
    createCanvas(480, 480);
}

function draw() {
    background(0,50,50);
    var mX = mouseX; //establishes mouseX and mouseY function
    var mY = mouseY;
    noFill();
    strokeWeight(1);


//mouse position is constrained to the canvas size
    mouseX=constrain(mX, 0, width);
    mouseY=constrain(mY, 0, height);

    mPos=dist(mX,mY,width/2,height/2);
    a= map(mPos,0,width,0,480);

    eight(); //draws first eight loop
    circleOne(); //draws ellipse

//draws second eight loop
    push();
    rotate(HALF_PI);
      for(var i=0;i<nPoints;i++){
        var r = map(mouseX,0,width,100,255);
        var g = map(mouseX,0,width,100,200);
        var b = map(mouseY,0,height,100,100);
        stroke(r/2,g*3,b)
        // stroke(r,g,b)
          strokeWeight(1.5);

          var t = map(i,0,nPoints,0,TWO_PI);

          x=a*sin(t);
          y=a*sin(t)*cos(t);

          rotate(PI); //rotates figure
          x2=a*sin(t*2)*PI;
          y2=a*sin(t*2)*cos(t)*PI;

        vertex(x2,y2)

      endShape(CLOSE);
    pop();
    }
}
function eight(){ //draws first eight loop
  var r = map(mouseX,0,width,255,100); //changes color based on where mouseX and Y is
  var g = map(mouseX,0,width/10,200,100);
  var b = map(mouseY,0,height,80,100);
  stroke(r,g,b)

    strokeWeight(3);
    // stroke(r,g,b)
    var x;
    var y;

    beginShape();

      translate(width/2,height/2);

      for(var i=0;i<nPoints;i++){
        var t = map(i,0,nPoints,0,TWO_PI);

        x=a*sin(t);
        y=a*sin(t)*cos(t);
      vertex(x,y);

    endShape(CLOSE);
}
}
function circleOne(){ //draws the circle
  strokeWeight(1)
  var r = map(mouseX,0,width/4,100,300);
  var g = map(mouseX,0,width/4,180,200);
  var b = map(mouseY,0,height*6,100,200);
  for(var i=0;i<nPoints;i++){ //draws the loop of ellipse
    ellipse(0,0,a*i,a*i)
  }
}

mouse X and mouse Y at the maximum width/height of canvas
mouse X and mouse Y at the minimum width and height of canvas

Nina Yoo – Project 07 – Curves

sketch
I was really intrigued by the hypotrochoid curve and how it was drawn the site itself. Through this project I was able to play around with the functions of cos and sin which I havent been able to delve into before. It was interesting to play with the numbers and see what different shapes appeared because of the repetitively drawn lines.

/* Nina Yoo
Section E
nyoo@andrew.cmu.edu
Project-07 Composition with Curves*/

var nPoints = 200
function setup() {
    createCanvas(480, 480);
    		frameRate(15);

    
}

function draw() {
	background(200,34,164);
	push();
	//into middle
	translate(width/2, height/2);
	drawHypotrochoidCurve();
	pop();
}


function drawHypotrochoidCurve(){
		//Hyptotrochoid
		//Link: http://mathworld.wolfram.com/Hypotrochoid.html

		var x;
		var y;
		
		var h = 15;
	

		var a = map(mouseX, 0,width,100,300); // (wat u want to effect, orginal range, new range) makes the variables interactive
		var b = map(mouseY, 0, height, 100,300);

		stroke(210,36,117);
		strokeWeight(2);

		beginShape();
			for(var i = 0; i <nPoints; i ++){

				// set variable t within the for loop so it keeps on looping (this acts as the angle for mouse)
				var t = map (i, 0, nPoints, 0 , 330 );

					// equation for the curve
				x = (a - b) * cos(t) + h * cos((a - b) * t); 
				y = (a - b) * sin(t) - h * sin((a - b) * t);
				vertex(x,y); // setting the patternn in the middle

			}
		endShape(CLOSE);


}


carley johnson curves

sketch

/*Carley Johnson
Section E
cbjohnso@andrew.cmu.edu
Project 07
*/

let x = 0;
let y = 0;
let ang = 90;
let col = 0;
let moveC = 1;

function setup() {
  createCanvas(480, 480);
  angleMode(DEGREES);
}

function draw() {
  background(random(100, 255), random(200, 50), random(0, 255), 5);
  stroke(100, 100, 40);

  //moving the color value
  col += moveC;
  fill(col + 50, 20, 20);
    if (col >= 100 || col < 0) {
      moveC = moveC * -1;
  }

  //rotate around the center
  translate(width/2, height/2);
  //rotation increments
  rotate(x);
  x+=1;
  //draws ellipse
  for (i = 0; i < 360; i += 13) {
  ellipse(-mouseX + cos(i++) * width / (400 / 72), width / 20 + sin(i++) * width / (400 / 72), width / 20 + mouseX, width / 20 -mouseY);
  }


}

I was not a fan of this project, the curves were all so daunting and cos/sin is really something that confuses me. I’m satisfied with the spiral the circles rotate around according to your mouse, but this was not a great project for me. Hopefully next week I can produce something more aesthetically pleasing.

JasonZhu-LookingOutwards-07


This is a screenshot of the data visualization chart for the many ways to die by Nathan Yau, It is titled How You Will Die and is published on FlowingData.com.

https://flowingdata.com/2016/01/19/how-you-will-die/
Created by Nathan Yau; Date Unknown.

I have long admired this project for several reasons. First and foremost it allows for the right amount of customization. Often times, data visualizations will overdo the interactivity component or not include it at all. This project is in the goldilocks zone of interactivity and customizability. I also very much admire how the information is presented. It takes a simple approach (using circles) to convey a complex amount of statistical data. Fascinating to say the least. I think this plays nicely into how Nathan Yau uses a very computational method visualization in his work. In many ways his artistic sensibilities are nested within the final product. As for the algorithms used, it seems to be various algorithms that pull from a statistical database.

JasonZhu-Project-07-Curves

I liked this project a lot because it began to delve into more abstract realms. While the execution was difficult, I had a lot of fun in the process exploring various types of graphing functions and applications. In trying to determine how to build my proposed idea, I was able to rekindle a long held interest in computational art as well as explore the mathematical side of computing. I believe this project has a host of potential applications that will bode well for me in future projects and courses.

sketch

/* Jason Zhu
jlzhu@andrew.cmu.edu
Section E
Project 07-Curves
*/

function setup() {
    createCanvas(480, 480);
}

function draw() {
	// define constrain variables
	var cx = constrain(mouseX, 0, 480);
	var cy = constrain(mouseY, 0, 480);
	// define color variables
  	var red = cx * .3
  	var green = cy * .3
  	var blue = 100
  	// define additional variables and draw shapes
	background(red * .3 - 15, green * .3 - 15, blue * .3 - 15);
	drawhypotrochoid();
	drawhypotrochoid2();
	drawflowerellipse();
	drawflowerellipse2();
	frameRate(999);
}

function drawhypotrochoid() {
	push();
	translate(width / 2, height / 2);
	noFill();
	// define constraint function
    var cy = constrain(mouseY, 0, 480);
	var cx = constrain(mouseX, 0, 480);
	// define draw variables
	var r1 = 360;
    var a1;
    var b1;
	// define color variables
  	var red = cx * .25
  	var green = cy * .25
  	var blue = 100
  	// define stroke
    strokeWeight(10);
	stroke(red, green, blue);
  	// define shape parameters
    // define alternation parameters
    var a1 = map(cx, 0, width, 0, 25);
    var b1 = map(cy, 0, height, 0, 1);
    // define shape parameters
    beginShape();
    rotate(radians(angle));
		for(var t = 0; t < 360; t += 2) {
			var angle = map(t, 0, 360, 0, 360);
        // equation
			var x = (a1 - b1) * cos(angle) + r1 * cos((a1 - b1) * angle);
			var y = (a1 - b1) * sin(angle) - r1 * sin((a1 - b1) * angle);
			curveVertex(x, y);
			}
		endShape();
    pop();
}

function drawflowerellipse(){
	translate(width / 2, height / 2);
	noFill();
  	// define constrain variables
	var cx = constrain(mouseX, 0, 480);
	var cy = constrain(mouseY, 0, 480);
	// define draw variables
  	var angle = map(cx, 0, width, 0, 360);
  	var a2 = 100 + (.2 * cx);
  	var b2 = 100 + (.2 * cx);
  	// define color variables
  	var red = cx * .6
  	var green = cy * .6
  	var blue = 100
  	// define stroke
    strokeWeight(1);
	stroke(red, green, blue);
  	// define shape parameters
  	beginShape();
	rotate(radians(angle));
  	for (var t = 0; t < 160; t +=2.8){
	    var x = a2 * (cos(t));
	    var y = b2 * (sin(t));
	    curveVertex(x,y);
		}
	endShape();
}

function drawflowerellipse2(){
	noFill();
  	// define constrain variables
	var cx = constrain(mouseX, 0, 480);
	var cy = constrain(mouseY, 0, 480);
	// define draw variables
  	var angle = map(cx, 0, width, 0, 360);
  	var a2 = 30 + (.2 * cx);
  	var b2 = 30 + (.2 * cx);
  	// define color variables
  	var red = cx * .6
  	var green = cy * .6
  	var blue = 100
  	// define stroke
    strokeWeight(1);
	stroke(red, green, blue);
  	// define shape parameters
  	beginShape();
	rotate(radians(angle));
  	for (var t = 0; t < 160; t +=3.8){
	    var x = a2 * (cos(t));
	    var y = b2 * (sin(t));
	    curveVertex(x,y);
		}
	endShape();
}

function drawhypotrochoid2(){
	push();
	translate(width / 2, height / 2);
	noFill();
	// define constraint function
    var cy = constrain(mouseY, 0, 480);
	var cx = constrain(mouseX, 0, 480);
	// define draw variables
	var r1 = 360;
    var a1;
    var b1;
	// define color variables
  	var red = cx * .3
  	var green = cy * .3
  	var blue = 100
  	// define stroke
    strokeWeight(5);
	stroke(red * .3 - 15, green * .3 - 15, blue * .3 - 15);
  	// define shape parameters
    // define alternation parameters
    var a1 = map(cx, 0, width, 0, 25);
    var b1 = map(cy, 0, height, 0, 1);
    // define shape parameters
    beginShape();
    rotate(radians(angle));
		for(var t = 0; t < 360; t += 2) {
			var angle = map(t, 0, 360, 0, 360);
        // equation
			var x = (a1 - b1) * cos(angle) + r1 * cos((a1 - b1) * angle);
			var y = (a1 - b1) * sin(angle) - r1 * sin((a1 - b1) * angle);
			curveVertex(x, y);
			}
		endShape();
    pop();
}


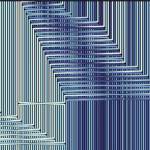
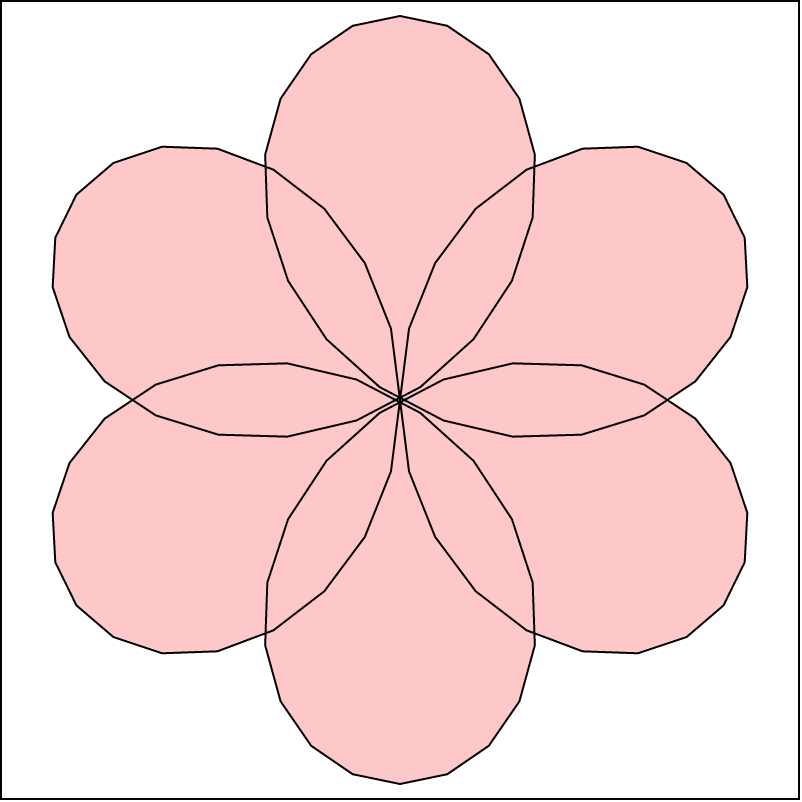
screenshot at the maximum width and minimum height of the canvas.


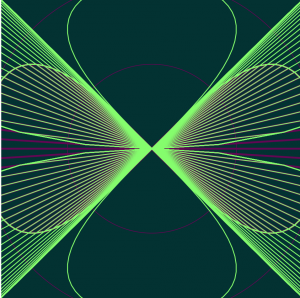
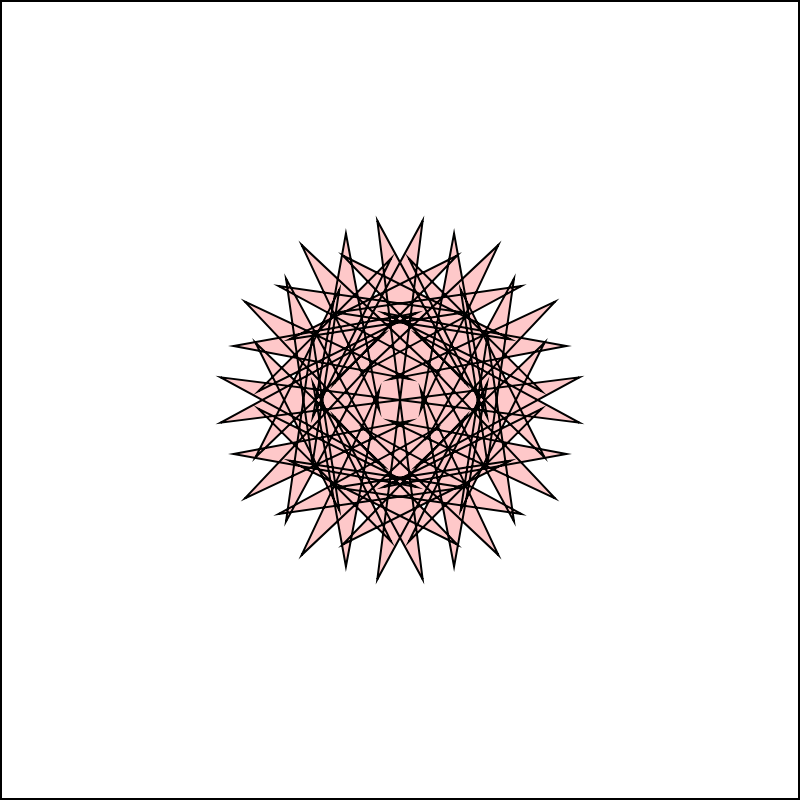
mouse X and mouse Y at the minimum width and height of the canvas.


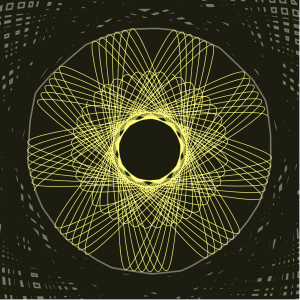
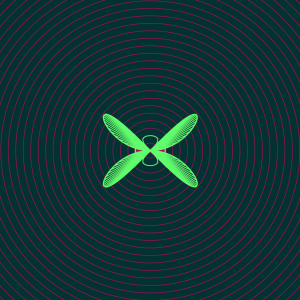
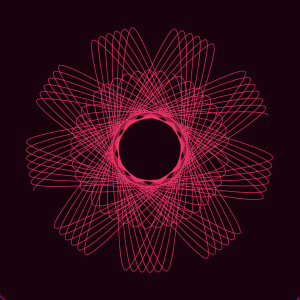
mouse X and mouse Y at the maximum width and height of the canvas.

Miranda-Luong-Project-07-Curves

sketch

/* Miranda Luong
Section E
mluong@andrew.cmu.edu
Project-07
*/


var nPoints = 100;


function setup() {
    createCanvas(400, 400);
    frameRate(10);
}


function draw() {
    background(255);
    
    // draw the frame
    fill(0); 
    noStroke();

    stroke(0);
    noFill(); 
    rect(0, 0, width-1, height-1); 
    
    translate(width / 2, height / 2);
    drawEpicycloidCurve();
}

//--------------------------------------------------
function drawEpicycloidCurve() {
    // Epicycloid:
    // http://mathworld.wolfram.com/Epicycloid.html
    
    var x;
    var y;
    
    var a = 80.0;
    var b = a / 2.0;

    //Uses mouseX and mouse Y to define the number of petals and overall scale of curve
    var n = round(dist(mouseX,mouseY,width/2,height/2)/5);
    
    fill(255, 200, 200);
    beginShape();
    for (var i = 0; i < nPoints; i++) {
        var t = map(i, 0, nPoints, 0, TWO_PI);
        
        x = (n + 2) * (cos(t) - cos((n + 1) * t));
        y = (n + 2) * (sin(t) - sin((n + 1) * t));

        vertex(x, y);
    }
    endShape(CLOSE);    
}

This was a really hard project to complete. It was hard translating the functions into code, seeing as I don’t really know much math anymore. It took lots of trial and error trying to navigate which variables controlled what in my function. I’m quite happy with the results though, I think it is a very pretty display.