Monica Chang – Looking Outwards – 07

LAUNCH IT by Shane Mielke

The beginning screen and visual options
Movement of the globe: Book locations

http://launchit.shanemielke.com/ (the website)

https://shop.shanemielke.com/ (the shop)

Shane Mielke is an award-winning creative director and designer who wrote this book called, LAUNCH IT- 300+ things I learned as a Designer, Developer and Creative Director. Along with publication, he created this website which illustrates all of the book locations that Mielke is aware of from sales data that was gathered from Amazon as well as his online shop(link provided above). Currently the website visualization shows book locations in 54 countries and 38 states in the USA.

Within this website, he provided different visual options for the viewers to interact with by incorporating different designs. For colors, he incorporated three different color options: base( dark blue and red), invert(red as the main color while a fluorescent blue indicates the location), and random(which utilizes different colors every time the user clicks the ‘random’ button). For visuals, he provided three options: bloom(constant lines), rocket(moving lines), and snake(moving lines with receding lines).

This website makes me feel like I traveled time into the future. There are very intricate details like the tiny, dust-like specs floating around the screen hidden within this beginning screen that just has me captivated with the whole concept although it is so simple: book locations. The idea could have easily ended up as a globe with marks on it, but Mielke was very clever with the idea of allowing the viewers to interact with the globe and even have a little fun with it by altering the visuals.

Taisei Manheim – Looking Outward – 07

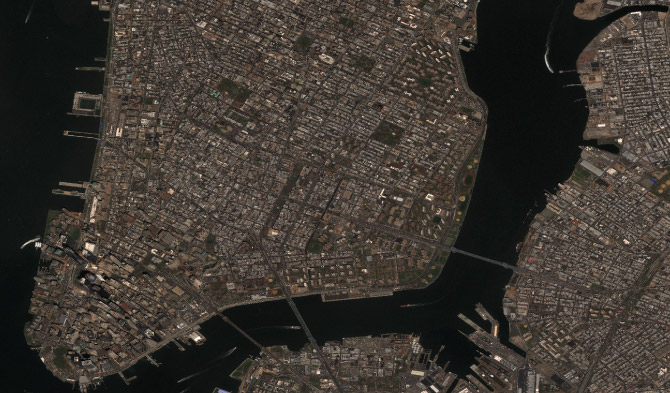
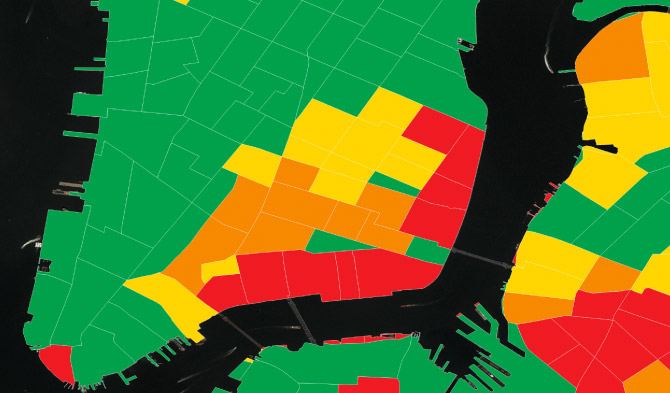
The project I chose was PENNY, an artificial intelligence tool developed by Stamen and researchers at Carnegie Mellon University.  Penny is an AI that is built on machine learning using neural networks to understand what kind of infrastructure is found in low income versus high income housing and then guess the neighborhood income based on these patterns.  It was built on top of DigitalGlobe’s analytics platform called GBDX, which uses the world’s most advanced commercial imaging satellites to create high resolution imagery that developers could then use.  The AI was first given income data from the U.S. Census Bureau, which was then divided into smaller areas to match satellite images from GBDX. Then the Census based color map was overlaid on the satellite map.  Then the AI looked for patterns in the satellite imagery and how they correlate to the income map. Through this is started to notice patterns in NEw York City, such as lower income areas tending to have baseball diamonds, parking lots, and large similarly shaped buildings (such as housing projects), middle income areas having more single family homes and apartment buildings, and high income areas having more greener spaces, tall shiny buildings, and single family homes with lush backyards.  You could then change the neighborhoods by adding different types of infrastructure to see how the AI would predict the income of the area would change. I found this project interesting because I live in New York City and you could notice differences in low income areas and high income areas, but never seen the visuals of the neighborhood’s infrastructure converted into data to understand their income.

link to project

Satellite imagery using DigitalGlobe’s analysis program GBDX.
Income date from the US Census Bureau that was overlaid on the satellite image.

Fallon Creech-Project-06-Abstract-Clock


sketch

//Fallon Creech
//Section B
//fcreech@andrew.cmu.edu
//Project-06

var xarc = 200
var yarc = 200
var center = 200

function setup() {
  createCanvas(400, 400);
}

function draw() {
  background(77);
	noStroke();

//beginning of red hours circle
	fill(77);
  ellipse(center, center, 300, 300);
  fill(241, 106, 111);
  arc(xarc, yarc, 300, 300, 1.5*PI, ((hour()%24)/12*PI-HALF_PI+0.0001));

//end of red hours circle
  fill(77);
  ellipse(center, center, 225, 225);

//beginning of green minutes circle
  ellipse(center, center, 200, 200);
  fill(176, 215, 119);
  arc(xarc, yarc, 200, 200, 1.5*PI, (minute()/30*PI-HALF_PI+0.0001));

//end of green minutes circle
  fill(77);
  ellipse(center, center, 125, 125);

//beginning of blue seconds circle
  ellipse(center, center, 100, 100);
  fill(139, 219, 217);
  arc(xarc, yarc, 100, 100, 1.5*PI, (second()/30*PI-HALF_PI+0.0001));

//end of blue seconds circle
  fill(77);
  ellipse(center, center, 25, 25);

//literal time
	fill(255);
  textAlign(RIGHT);
  text(hour()%24, 185, 30);
  text(":", 190, 30);
  textAlign(CENTER);
  text(minute(), 200, 30);
  text(":", 210, 30);
  textAlign(LEFT);
  text(second(), 215, 30);
}

I approached this project by making a simplified version of a typical analog clock. This design is meant to be highly and easily legible, so I used an RGB color palette to easily distinguish between time segment and a layout that references typical clocks. I envision this design being an alternative to typical clocks, in which numbers aren’t needed to interpret the time.

Fallon Creech-LookingOutwards-06

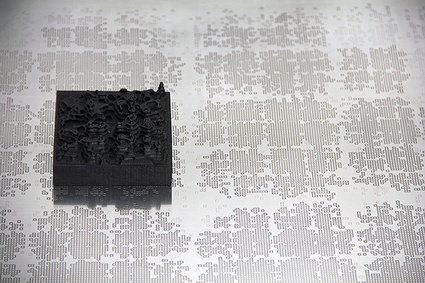
Physical product with geographical extrusions placed over sheet of associated randomized points

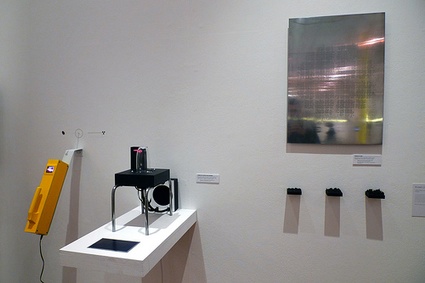
Artists Steffen Fielder and Jonas Loh explore user relationships with randomness in their “Known Unknowns” project. One user had the opportunity to interview the artists discovered “the designers explored the importance of randomness in our daily life but also investigated whether randomness actually exists or if it is just a lack of knowledge which makes things appear random to us.” To answer these thoughts, they utilized two different seeds to generate random numbers. The Random Event Harvester collects random numbers in an indicated environment and stores them with corresponding geographical information. The Cosmic Ray Detection Chamber uses the information from the Random Event Harvester to generate random values, which ultimately produce tiles with randomized extrusions extending from one face.

Two seeds (Random Event Harvester and Cosmic Ray Detection Chamber) pictured together

Jacky Tian Project 06

sketch

//Yinjie Tian
//Section D
//yinjiet@andrew.cmu.edu
//Assignment 06

var x = []; 
var y = [];
var dx = []; 
var dy = []; 
var color = []; 


function setup() { 
    createCanvas(480, 480);
    angleMode(DEGREES);
    for (i = 0; i < 100; i++) { 
        x[i] = random(width);
        y[i] = random(height);
        dx[i] = random(-5, 5);
        dy[i] = random(-5, 5);
        color[i] = color(random(255), random(255), random(255));
        
    }
    frameRate(5);
}


function draw() {
 
    background(0);
 
 //stars at the background   
    noStroke();
    for (i = 0; i < 100; i++) {  // for each stars at the back ...
        fill(color[i]);
        ellipse(x[i], y[i], 10, 10);
        x[i] += dx[i];
        y[i] += dy[i];
        
        if (x[i] > width) x[i] = 0;        //horizontally
        else if (x[i] < 0) x[i] = width;
        if (y[i] > height) y[i] = 0;       //vertically
        else if (y[i] < 0) y[i] = height;
    }

        var h = hour();
        var m = minute();
        var s = second(); 
        var ring = random(1, 50);

//planets (clock)
    push();
    noStroke();
    
    translate(width/2,height/2);
    rotate(s * (360/60));


    fill(0, 200, s * 5);
    ellipse(200, 0, 80+ring, 80+ring);
    fill(0);
    ellipse(200, 0, 80, 80);
    fill(200, 200, s * 5);
    ellipse(200, 0, 60, 60);
    
    line()

    pop();
    
    push();
    noStroke();
    fill(200, m * 5, 200);
    translate(width/2,height/2);
    rotate(m*(360/60));
    
    ellipse(60, 0, 40, 40);
    pop();
    
    push();
    noStroke();
    fill(h * 25, 200, 200);
    translate(width/2,height/2);
    rotate(h*(360/12));
    
    ellipse(100, 0, 20, 20);
    pop();

//center rotational axis
    strokeWeight(4);
    stroke(255)
    line(width / 2 - 25, height / 2, width / 2 + 25, height / 2);
    line(width / 2, height / 2 - 25, width / 2, height / 2 + 25);
    fill(255, 0, 0);
    ellipse(width/2, height/2, 10, 10); 

}

I was inspired by how the solar system operates like a clock that all the planets are rotating around the sun. For the clock I created, I drew three planets rotating around the center point where the nearest one represents hour, the medium one represents minute and the furtherest one tells the second.

Danny-Cho-Project-06-Abstract-Clock

Abstract Clock

var x = [0];
var y = [0];
var Xoffset = 0;
var Yoffset = 0;
var col = 255;
var resetclr = 0;
var sc = [0];
var gRate = 0; //gradient speed
var activity = 0;


function setup() {
  createCanvas(480, 480);
  background(0);
  frameRate(30);
  var H = hour();
  var M = minute();
  var S = second();
}

function neuron() {
  col = random(0, 255);

stroke(col, 80)
  beginShape()
  for (i = 0; i < x.length; i++){
    vertex(x[i], y[i]);
  }
  endShape()
  Xoffset = random(-10, 20);
  Yoffset = random(-10, 20);
  x.push(x[x.length-1]+Xoffset);
  y.push(y[y.length-1]+Yoffset);
  if (i % 60 == 0) {
    x[i] = 0;
    y[i] = 0;
    background(0)
    endShape()
    beginShape()
  }
  if (second() % 5 == 0) {
    fill(0, 0, 0, resetclr);
    noStroke();
    rect(-50,-50, width + 50, height + 50);
    x = [0];
    y = [0];
    resetclr ++;
  }
  
}
//function to determine the breathing rate
function activeness(){
  //fast breathing during the active hours of the day
  if (hour() > 6 & hour() < 23) {
  activity = 2;
}
  //slow breathing due to sleep
  if (hour() < 6 || hour() > 23) {
    activity = 0.3
  }
  //medium speed breathing when waking up and going to bed
  if (hour() == 6 & hour() == 23) {
  activity = 1;
}
}

//changing the gradient to represent breathing
function breathing(){
  var c = map(sin(radians(gRate)), -1, 1, 0, 255);
  for (j = 0; j < 255; j++) {
      stroke(abs(j - abs(sin(radians(gRate))) * 255));

      circle(width / 2, height / 2, j);
      print(c);
    }
}

function draw(){
noFill();
//the
for (rota = 0; rota < 4; rota ++) {
  push()
  translate(width / 2, height / 2);
  rotate(PI / 2 * (rota + 1))
  neuron()
  pop()
}

if (second() % 6 == 0) {resetclr = 0;}
activeness();
breathing();


gRate = gRate + activity;
}

I made a biological clock trying to describe two phenomenons that happen within our bodies constantly: breathing and information exchange between neurons. The gradient circle in the middle represents breathing and the electricity-looking lines represent the signals being transferred between the neurons.

The breathing speed changes depending on the hour of the day. I took into account how a person’s activeness affects their breathing. When the person is asleep, 12am – 5am, breathing is the slowest, medium speed at 6am and 11am, when people state of activeness is transitioning, and fastest from 7am to 10pm, which are the active hours for me.

Shariq M. Shah – Looking Outwards 06 – Randomness

I am using one of my grace days for this late submission.

Mark Wilson is a computational artist and designer who focuses on the random aggregation of images into quilt-like mosaics and collages. His work includes processes that collect patterns and images at random and stitches them together in a variety of compositions. Through the logic of the program, color palettes and combinations are developed over a number of iterations, and there is emphasis on the overall mosaic effect of these works. Wilson’s work has been shown at a variety of exhibitions and corporate settings, where the processes and visual complexity of his work are able to be studied. This work is particularly intriguing as it relies on a program to develop an overall composition, thereby shifting the role of the artist in such a work.

Mark Wilson Recent Mural Study
Mark Wilson Mural Study 02

http://mgwilson.com/

Minjae Jeong-project-06-abstract-clock

sketch

//Minjae Jeong
//Section B
//minjaej@andrew.cmu.edu
//project-06


function setup() {
    createCanvas(480, 480);
    rectMode(CENTER);
}

function draw() {
    clear();
    var H = hour(); //Hours
    var M = minute(); //Minutes
    var S = second(); //Seconds
    background(0);

    push(); //orbits
    translate(width / 2, height / 2);
    stroke('white');
    strokeWeight(0.5);
    noFill();
    ellipse(0, 0, 100, 100); //inner orbit (seconds)
    ellipse(0, 0, 250, 250); //outer orbit (minutes)
    pop();

    push(); //Seconds
    translate(width / 2, height / 2);
    fill(255, 153, 255);
    rotate(TWO_PI * (S - 15) / 60); //starts at 0 seconds
    ellipse(50, 0, 30, 30);
    pop();

    push(); //Minutes
    translate(width / 2, height / 2);
    fill(102, 255, 102);
    rotate(TWO_PI * (M - 15) / 60); //starts at 0 minutes
    ellipse(125, 0, 45, 45);
    pop();

    translate(width / 2, height / 2);//Outer planets (Hours)
    var hours = H >= 12 ? H - 12 : H; //If H >= 12, subtract 12 from H to make 12hr clock
    for (i = 0; i < 12; i++) {
        push();
        rotate(TWO_PI * (i - 3) / 12);
        if (i == hours) {
        fill('yellow'); //fill yellow for current time
        }
        else {
        fill(51, 153, 255);
        }
        ellipse(195, 0, 50, 50);
        pop();
    }


}

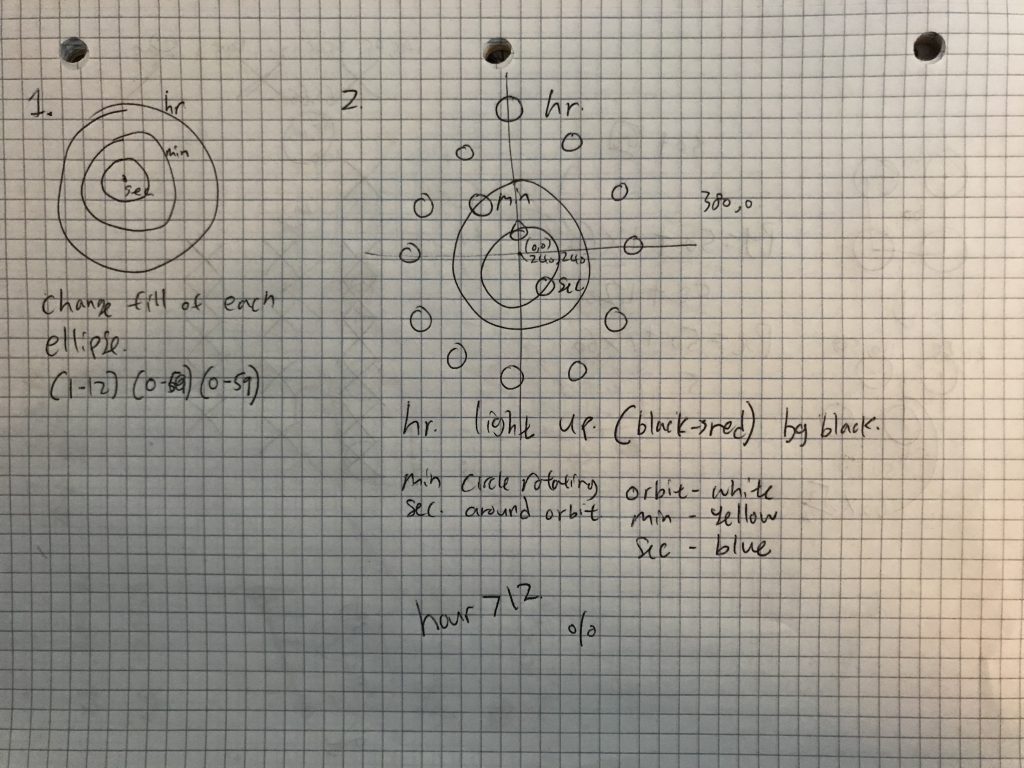
I got my motivation while watching my friend playing a video game, and I designed my clock with space theme. With 12 circles (planets) that represent each hour, I made the planet change to yellow for current hour. Then I made two planets rotating around their orbits according to minutes and seconds.

Shariq M. Shah – Project 06 – Abstract Clock

shariqs-06-project


function setup() {
    createCanvas(480, 480);

}

function draw() {

    background(0);

    // get the current time
    var H = hour();
    var M = minute();
    var S = second();

    // map times to canvas proportions
    var mappedH = map(H, 0,23, 0,width);
    var mappedM = map(M, 0,59, 0,width);
    var mappedS = map(S, 0,59, 0,width);
    var timeArray = [mappedH, mappedM, mappedS]

    var x = width / 2 - 20;

    push();

    translate(width / 2, height / 2);

    noFill();


  for(s = 0; s < 60; s++) {

    strokeWeight(0.1);

    stroke(0 + mappedS, 300, 20);

    ellipse(0, 0, mappedS, x);

    rotate(radians(s * 0.2));

  }


    for(m = 0; m < M; m++) {

    strokeWeight(0.1);

    stroke(0 + mappedM, 60, 20);

    ellipse(0, 0, mappedM, x);

    rotate(radians(m * 0.2));

  }

    for(h = 0; h < H; h++) {

    strokeWeight(0.1);

    stroke(200, 60, 20);

    ellipse(h, 0, mappedH, x);

    rotate(radians(H * 0.1))


  }

    pop();


    text(H, (width / 2 )- 6, height / 2);
    fill(300);

    text(M, (width / 2) - 6, height / 2 + 15);
    fill(300);

    text(S, (width / 2) - 6, height / 2 + 30);

    fill(300);


}

In this project, I explored the practices of timekeeping in relation to abstract line geometries that rotated and overlapped based on the corresponding time. Different colors represent the different time increments, and complex geometries emerge as a result of the time keeping computation. These processes result in a clock that is dynamic and presents interesting and complex geometries as a result of time.

rbd test

rbdtest

var sun = 220;
var moon = 235;
var cloud = 260;

var s;
var m;
var h;

function setup() {
    createCanvas(480, 480);
    frameRate(1);  
    s = second();
    m = minute();
    h = hour();
}

function draw() {
    background(0);
    noFill();
  
    if (s % 2 === 0) {
    if (h >= 8 & h < 13) {
      background(182, 224, 239);
      // base()
      // morning()
    } else if (h >= 13 & h < 17) {
      background(141, 194, 214);
      // base()
      // afternoon()
    } else if (h >= 17 & h < 22) {
      background(79, 130, 150);
      // base()
      // twilight()
    } else if (h >= 22 & h < 23.5) {
      background(34, 79, 96);
      // base()
      // night();
    }
    } else if (h >= 0 & h < 8) {
      base()
    }
  
    //minutes
    for (var j = 0; j < minute(); j ++){
      sun = map(j, 0, 70, 220, 255);
      moon = map(j, 0, 60, 125, 255);
      cloud = map(j, 0, 50, 280, 255);
      stroke(sun, moon, cloud);
      fill(37, 179, 255);
      ellipse(240, 240, 9*j, 9*j);
    } 
     push();
  
    //seconds
     noFill();
     translate(width/2, height/2);
    for (var i = 0; i < second(); i ++) {
      sun = map(i, 0, 70, 210, 71);
      moon = map(i, 0, 60, 345, 204);
      cloud = map(i, 0, 50, 0, 234);
      stroke(sun, moon, cloud);
      stroke(50, 75, 255);
      rotate(radians(3));
      ellipse(0, 0, 30, 450);
    } 
    
      pop();
  
      
    {
      
    } 
   
     strokeWeight(2);
     noFill();
     translate(width/2, height/2);
    //hours
    for (var k = 0; k < hour(); k ++){
      sun = map(k, 0, 70, 255, 255);
      moon = map(k, 0, 60, 255, 255);
      cloud = map(k, 0, 60, 102, 255);
      stroke(sun, moon, cloud, 190);
      rotate(radians(8));
      ellipse(0, 0, 150, 400);
      
        
    }		
    
}