Jamie Park – Looking Outwards 07

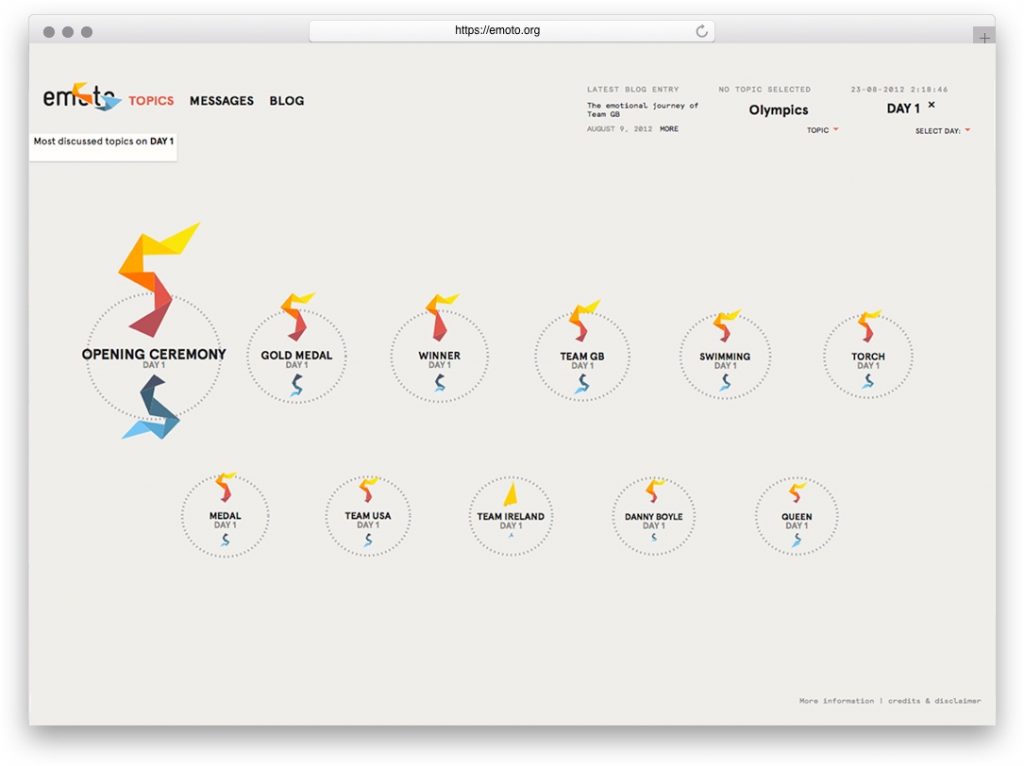
Studio NAND’s Emoto (2012)

I was deeply inspired by Studio NAND’s Emoto, a data visualization for the 2012 London Olympics. This KANTAR-Information is Beautiful Awards winner collected responses to the Olympics through Twitter. The collected data was then used to determine the collective sentiment on individual topics, such as events, players, and teams. Unfortunately, the studio’s website does not specify which algorithm the team used to organize the data. I think it is really interesting that the studio decided to generate visuals using Twitter, and I am curious if they ever looked into other social media, such as Facebook or Instagram, for responses.
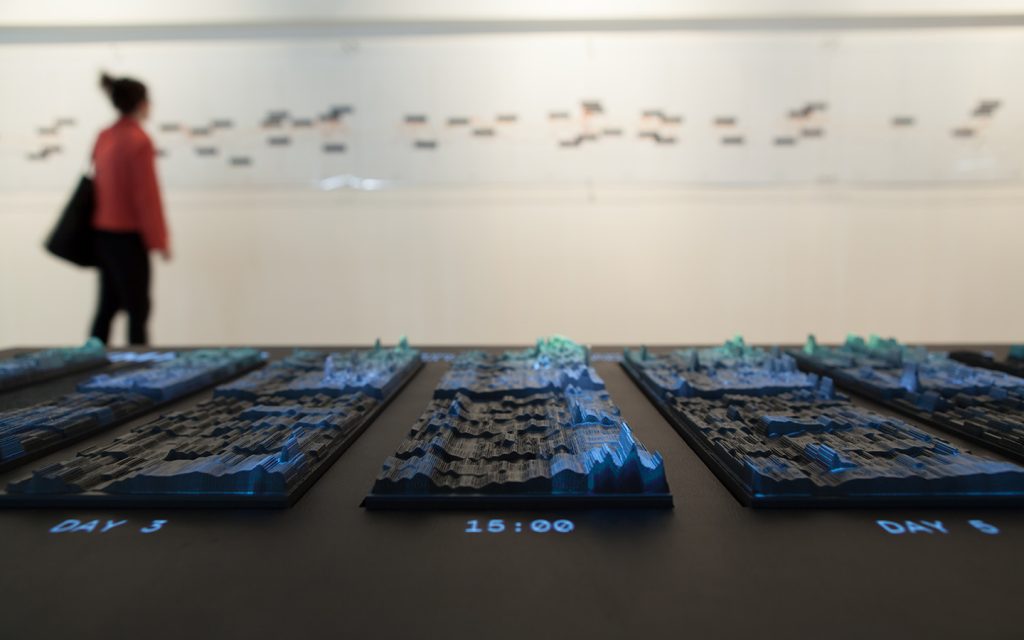
The studio also created a physical installation of the data that represents all responses over time with overplayed information from posted Tweets. I am, again, curious to know if the team had drafts of their installation before creating the data. The way they have represented the data is very particular, and I would like to know their thought process before designing it.

Sean Meng – Looking Outwards – 07

Northeast FAA Data Visualization
Aaron Koblin
Link: http://www.aaronkoblin.com/work/flightpatterns/index.html

The Flight Patterns visualizations are the result of experiments leading to the project Celestial Mechanics by Scott Hessels and Gabriel Dunne. FAA data was parsed and plotted using the Processing programming environment, which is a flexible software sketchbook and a language for learning how to code within the context of the visual arts. And the frames were composited with Adobe After Effects and/or Maya. The project does not only represent data visually but also experiments with the possibility of representation technique. As a result, the outcome turns out to be more than just information but is also informative art piece that has aesthetic value. 

Timothy Liu — Looking Outwards — 07

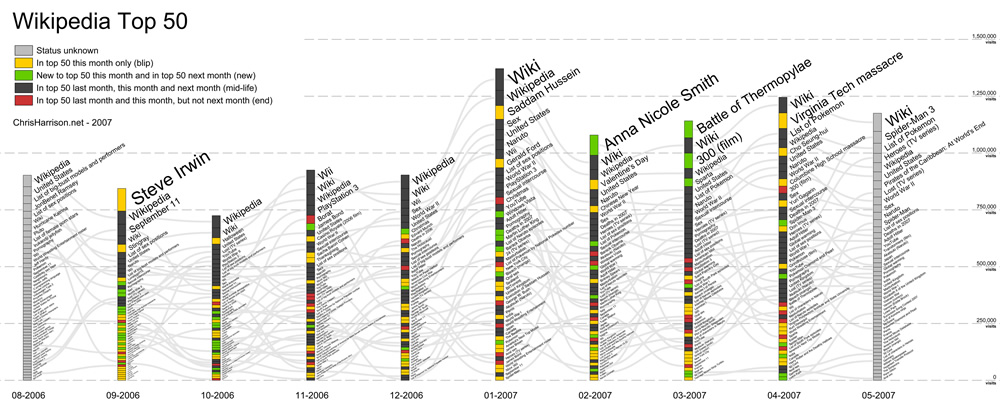
This is Professor Harrison’s “Wikipedia Top 50” from 2006-2007.

For this week’s Looking Outward on informational visualization, I looked at a chart developed by CMU professor Chris Harrison on Wikipedia article popularities over a 10-month span. Wikipedia has long been an infamous news source, but the influence it’s had on information gathering and research is undeniable. Thus, Professor Harrison saw Wikipedia as a way to better understand how users browsed the internet in 2006. As he described it, visualizing this information allowed us to get a better read on the internet’s “pulse” and what activity was trending at the time. 

The graph is organized by month for every month from August 2006 to May 2007. Each month is organized into its top 50 search categories/results, sorted by descending order of frequency. In total, each of these bars represents all the traffic to Wikipedia for top 50 pages. For example, in September 2006, the top Wikipedia search result was “Steve Irwin” (the Crocodile Hunter sadly passed away during this month), while the 50th most popular result was “Podcasting” (huh!).

Prof Harrison’s information visualization does an excellent job utilizing design principles to convey meaning. He uses visual hierarchy, both through font size and bar size, to show which search results were prominent each month. He uses color to help differentiate “blips” from “mid-life,” “new,” and “end.” He also uses gray trend-lines to showcase which search results are common across months to show changes in activity. And finally, he utilizes a consistent scale with clear labels and axes to indicate the magnitude of the different search results. Overall, Prof Harrison’s information visualization display utilizes both design principles and data-management strategies that make it a compelling and power piece of information.

SOURCE:

http://www.chrisharrison.net/index.php/Visualizations/WikiTop50

Xu Xu – Looking Outwards – 07

Building visual tools to manage Germany’s rail network and its hundreds of thousands of daily passengers.

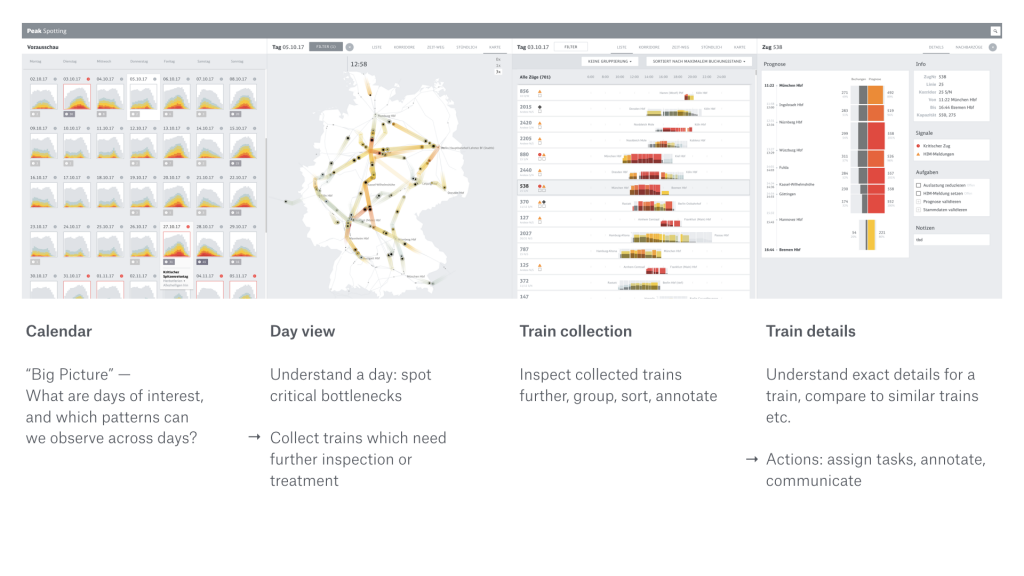
The project Peak Spotting was created by Studio NAND in collaboration with Moritz Stefaner, intended to provide visualization to passenger loads and identify potential bottlenecks early on. This web application collects millions of data-points over 100 days into the future, then these data-points are integrated into custom developed visual tools such as animated maps, stacked histograms, path-time-diagrams and lists with mini visualizations.

The application is split into 4 sections horizontally: Calendar, Day view, Train collection, and Train details. This application was designed with the team at Deutsche Bahn and the later users. According to Stefaner, prototyping with Tableau proved very useful to learn quickly if specific features would prove useful and in which form.

This project had my interest because of it’s various forms of data visualization. Through a combination of graphs and animations, the user is able to grasp data quickly and make judgement early on. The visualizations communicate information while also being aesthetically pleasing to the eye.

Raymond Pai-Looking Outwards-07

Artificial Arcadia is an installation by Swiss-based art collective Fragmentin. The installation visualizes the Swiss mountain range using moving poles and a white cloth. They appear as mountain peaks to visitors, who’s movement appears as a heat map on a screen behind the mountain range. This is an interesting use of live user data and data regarding how much human-made construction is impacting the environment of Sweden. As people move around the exhibit, they generate ‘heat’, which is visualized as a red cloud on the mostly blue screen. This, in turn, lowers the peaks of the ‘mountains’, which represents melting icecaps in the Swiss mountains.

There are many sensors and computers working to achieve this exhibit. There must be at least motion sensors, live data collection on construction sites, and perhaps even carbon footprints. This data is also computed as vertical heights of the poles that create the mountain peaks. I admire the simplicity and multilayered nature of this installation. Every part is a metaphor, and Fragementin‘s work all tend to have many layers of meanings.

The piece:

Kimberlyn Cho- Looking Outwards 07

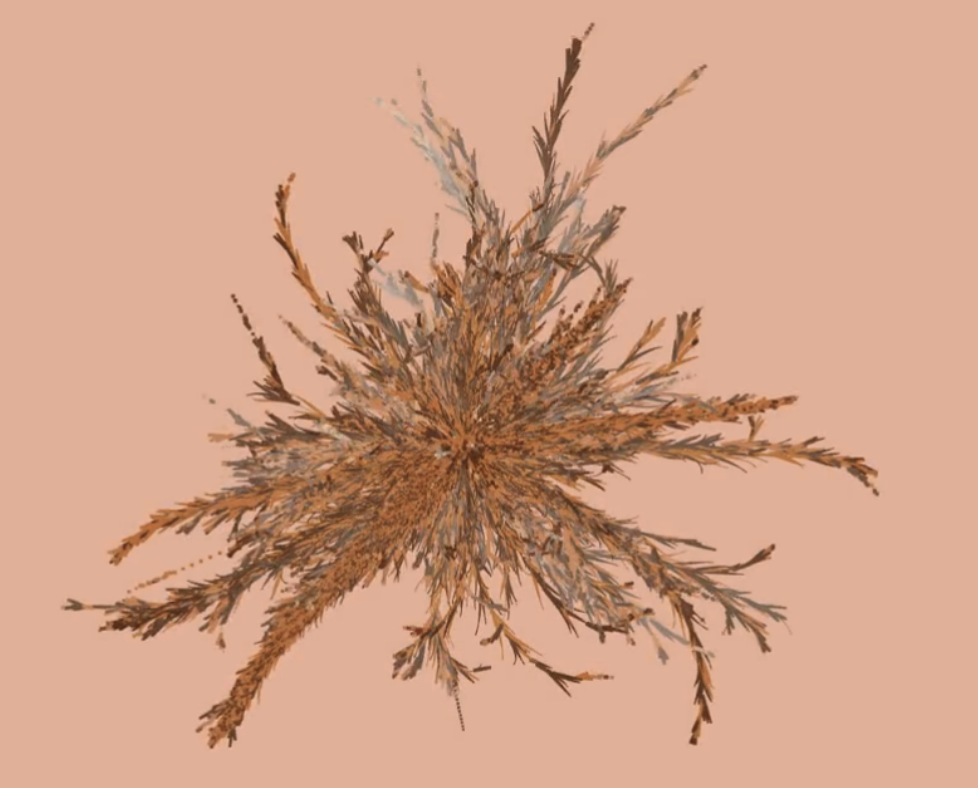
Virality by Rachel Binx visualizes the spread of facebook stories by analyzing the origin of the story to its various branchings. Her team focused on the three most shared images on facebook (all from George Takei’s page) and tried to emulate the energy of these images using WebGL.

With the help of Zach Watson, Binx uses WebGL as a framework for her project to produce the visualization as well as iterate on various animation styles. WebGL, short for Web Graphics Library, is a JavaScript interface for rendering interactive graphics on a web browser. It uses a 3d project exported from various 3d softwares such as Blender or Autodesk Maya to produce an interactive visualization accessible from most, if not all, browsers. The software allows Binx to experiment with different rendering options such as the color, opacity, degree, density of the branches

Virality (female) by Rachel Binx 2012
Virality (male) by Rachel Binx 2012

The animated data visualization starts from the origin of the viral facebook images and analyzes its various branches, with each re-share of the image becoming its own branch. Some re-shares show a burst of energy with the re-share almost becoming its own viral element, while others create new branches in the visual form of arcs of various angles.

I found this work to be interesting in its relevance to modern day social media tactics and its resourcefulness. Social media can be considered one of the most efficient ways to spread information to various groups of people today. Many businesses and corporations take advantage of the excessive use of social media to exploit users as well as spread data or any other types of information. To be able to track the pathway of a viral image on facebook can indicate useful advertising tactics, as well as interesting feedback and conclusions for not only companies, but also for the average social media user.

virality

Min Ji Kim Kim – Looking Outwards – 07


Chris Harrison’s Bible Cross-References data visualization

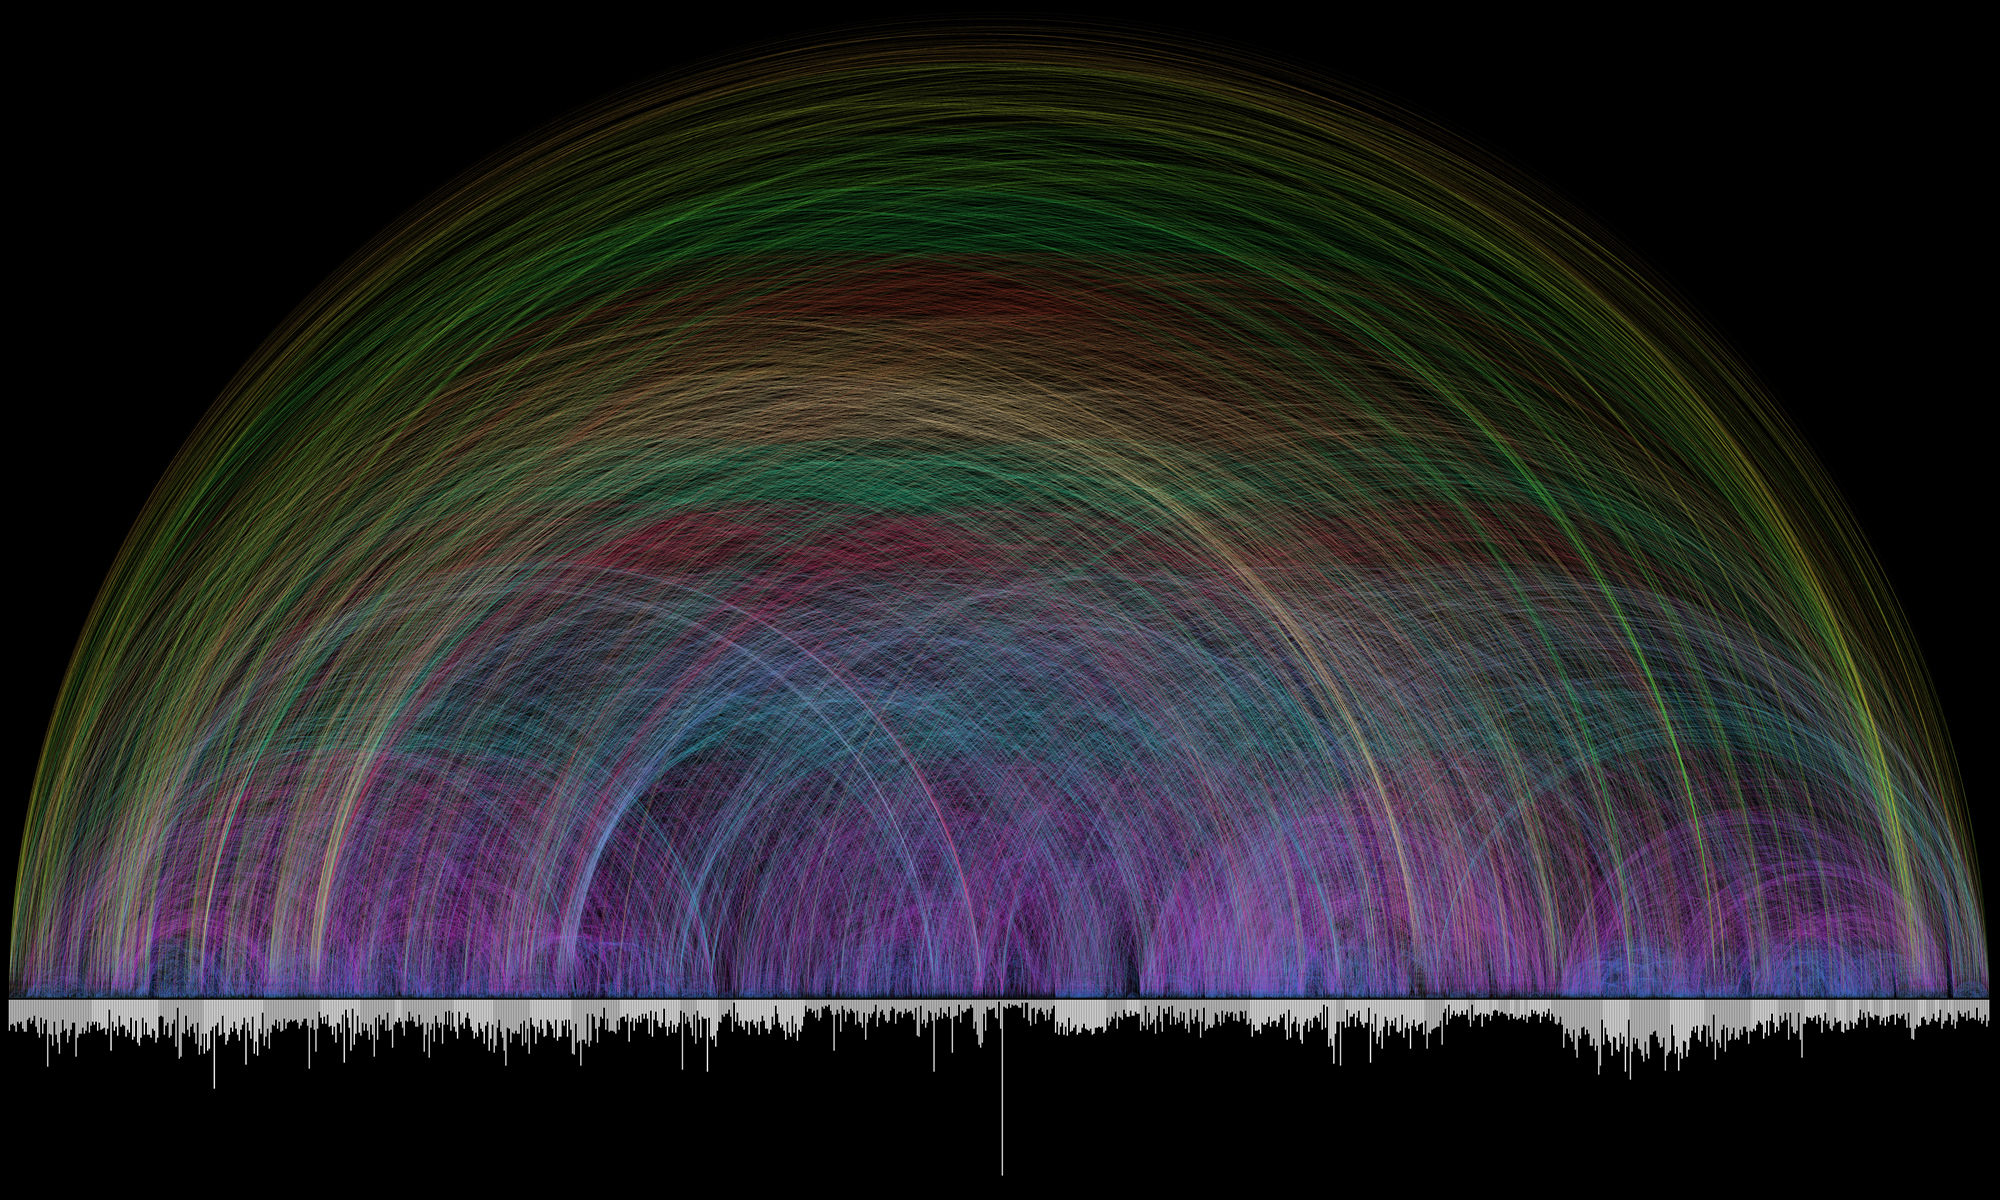
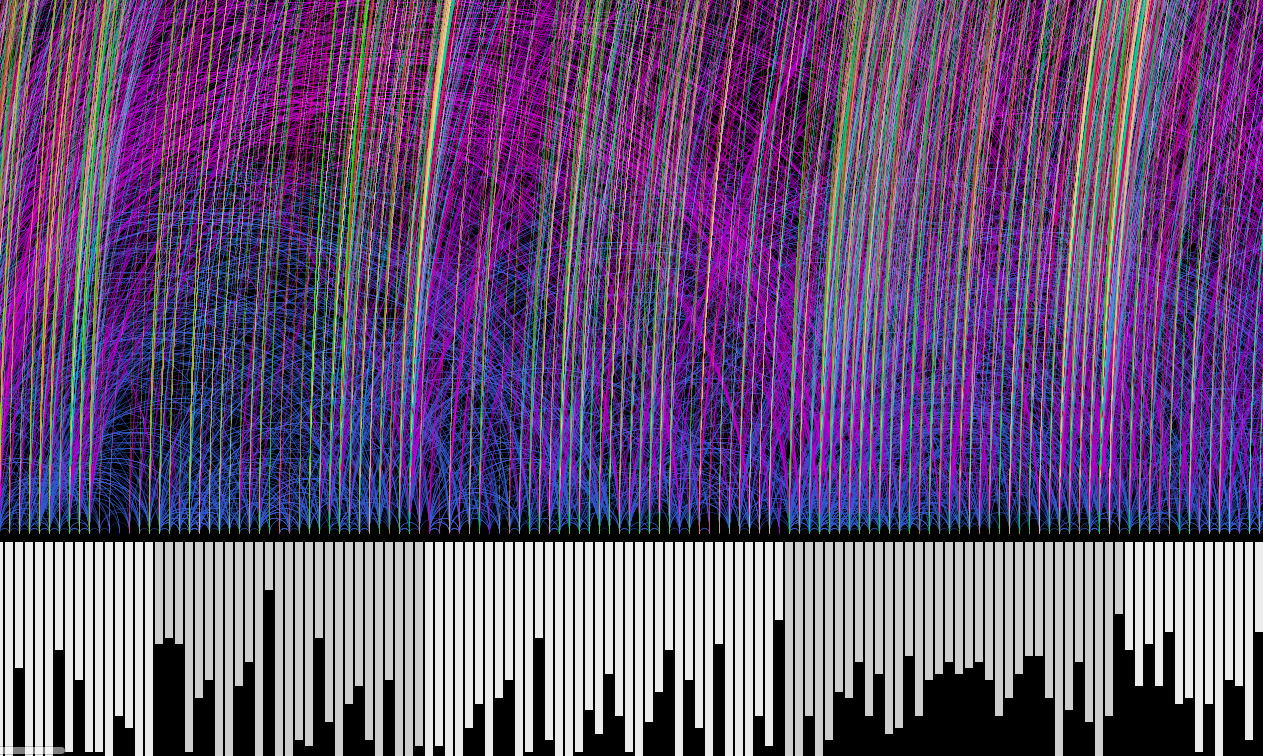
Bible Cross-References is a collaboration piece between Chris Harrison and Pastor Christoph Römhild. Pastor Römhild had begun putting together data on cross-references within the Bible and wanted to visualize them with the help of Harrison. Together, they were able to take over 63,000 cross references to create this beautiful rainbow. The bottom bars are the different books of the Bible (alternating color between white and gray) and the bar length is how many verses each chapter has. The arc color denotes the distance between the cross-referenced chapters.

Closeup of a portion of the Bible Cross-References data visualization piece.

I am a Christian, and while reading my study Bible there have been multiple times I have thought, “There are so many cross-references to other books, I wonder if we could analyze them… that would be amazing”. When I found this piece, I was fascinated. Looking at these cross-references visually though Harrison’s work has really shed a light on how extensively connected the Bible is and I am in awe. I really appreciate how Harrison and Römhild were able to create such a beautiful piece using data from the Bible.

You can see his other data visualization projects here.

Sarah Choi – Looking Outwards – 07

Flight Patterns from Aaron Koblin on Vimeo.


Aaron Koblin: artist, designer, programmer, and entrepreneur

For this week’s Looking Outwards, we are focusing on computational information visualization, which is why I decided to focus on Aaron Koblin. He is an artist, designer, programmer, and entrepreneur specializing in data and digital technologies. I decided to focus on his Flight Patterns project, documenting his own custom software with computational and interactive information visuals of the paths of air traffic over North American through color and form. This project intrigued me as a pretty heavy traveler and growing up in South East Asia, the art of having technical engineering skills to fly all over the world has been an important aspect.

The algorithms generating the work were parsed and plotted using a form of process programming. This project first started as a series of experiments for a project called “Celestial Mechanics” with his colleagues at UCLA. However, during the process, Koblin wanted to make a project of his own using his artistic skills. 

The project’s final form was manifested through his artistic ability to make interactive visualizations but also was made through technical computing skills that went along with flight patterns over the United States. 

Paths of air traffic over North America visualized in color and form.

Lanna Lang – Looking Outwards – 07

Aaron Koblin’s “Amsterdam SMS” // 2007

This project is a dynamic visualization of the mass volume of SMS messages that were transmitted on the night of New Year’s Eve across Amsterdam, revealing the city’s buildings and structures. This interactive tool was built with Processing and OpenGL. What inspires me about this project is that it usually isn’t the type of art I would normally gravitate towards, but it’s unique concept of taking the data of all the SMS messages from one of the busiest nights ever and forming a city’s cityscape with its volume is very intriguing and out-of-the-box.

I appreciate how Koblin includes a timelapse of how the SMS messages varied across the month of December, so that the drastic jump on January 1st  is exaggerated even further, displaying how many people were looking at their phone screens at the time of change of the new year. What Koblin got right was the message that this sends across by freezing the frame as soon as the date turned January 1st, and I would love to see this project redone now, and how modern technology has affected society even further than it did in 2007.

In general with Koblin and his use of data visualization art, Koblin was inspired by his interest in computer gaming and being exposed to the rich data of society that we live in, as well as learning from the two professors from UCLA who created Processing.

Aaron Koblin’s “Amsterdam SMS”

Xiaoyu Kang-Looking Outwards-07


Every IP, 1999

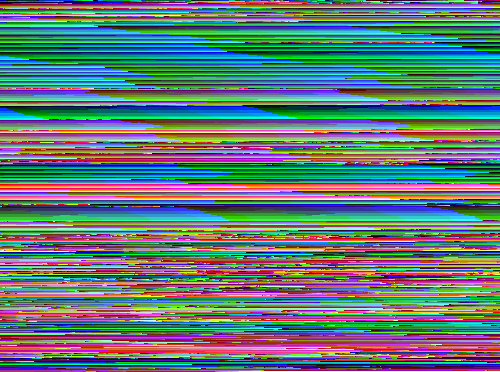
This project is called 1:1. It is a project that was created in 1999 as a collection of database. The database was created to eventually contain the addresses of every website in the world. The data was collected through sending out a crawler, which will determine if there is a website at a specific numeric address, which is called IP and range between 0.0.0.0 and 255.255.255.255. The crawler also determines whether the website is open to public or not. When this project first started in 1999, around two percent of the website, which is around 186100 sites were included in the database. However, the internet world in changing at a speed faster than anticipated in 2001 so the first version of this project is out of date.

1:1 (2) is then created as a continuous project based on the first version. This project consists of the database of the website addresses generated between 2001 and 2002. This second project also includes interfaces that compare the data between the first and the second database.

Every IP, 2001