Jasmine Lee – Looking Outwards – 09

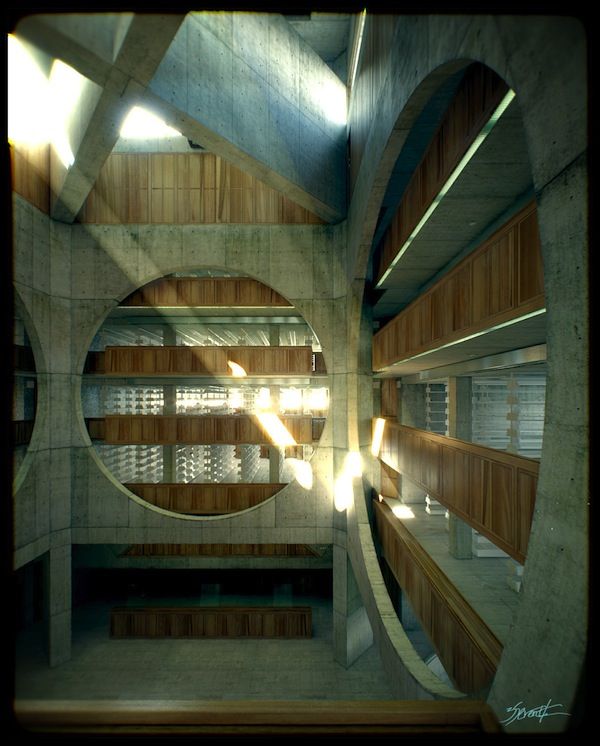
For my Looking Outwards this week, I chose to look at Fanjie Jin’s Looking Outwards 05. He chose to write about Alex Roman’s renders, done using VRay and digital modeling. Although I am somewhat familiar with VRay, I have rarely looked at renders of this level before this. Roman’s renders focus on creating lighting conditions which are incredibly hard to capture in real life. Yet, he can completely convince the viewer that what they are looking at is real. His use of lighting is masterful and can turn blank-slate digital models into beautiful “snapshots” of famous existing buildings.

In his animated piece, “The Third & The Seventh,” Roman showcases his renders by providing a walk through instead of simply a slideshow of his pieces. He also shows the layers that went into creating each of his pieces, with multiple steps of post-processing. The inclusion of moving elements combined with varied light conditions adds a sense of fantasy to his illusions.

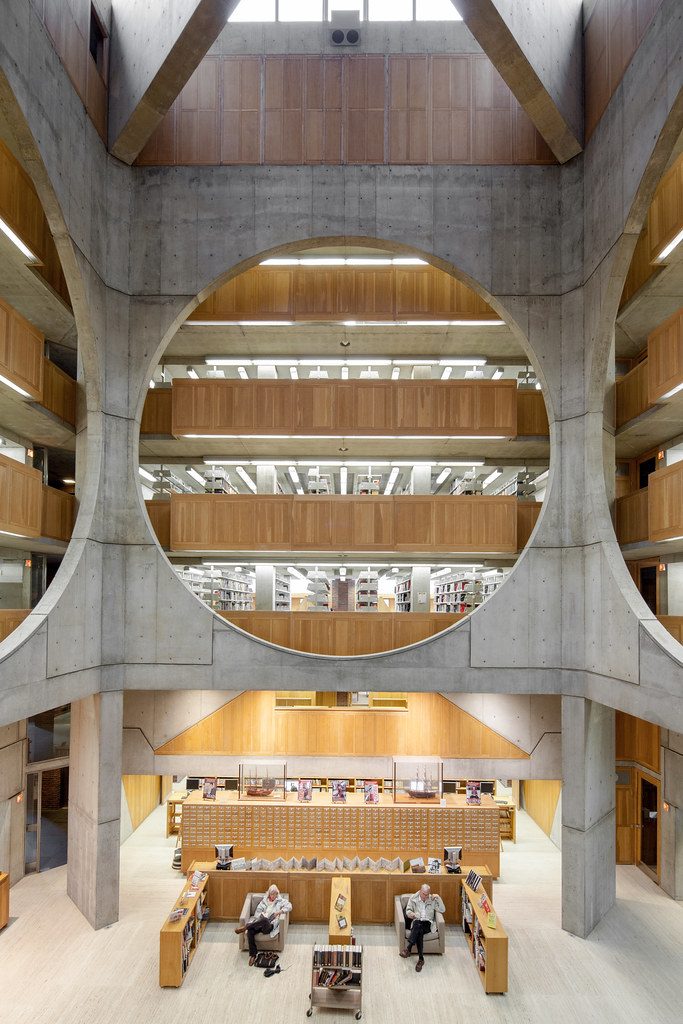
Even Exeter Library, a building which I had seen in person, felt somewhat familiar and otherworldly at the same time. Agreeing with Fanjie, the renders are so realistic they convince the viewer regardless of their previous experiences.

Phillips Exeter Library, recreated with dramatic lighting by Alex Roman.
Photograph of Exeter Library interior from ArchDaily.

Sean Meng-Looking Outwards-09

In this week’s Looking Outwards, I was interested in my classmate Fanjie Jin’s post about the randomness in art. The artist he researched is Cy Twombly. He creates large scale free handed calligraphy work using paint. According to the post, the artist creates his art pieces by completely relying on his intuitive feelings about composition, shape and colors. It brings up an interesting discussion about what is random and what is not in art. Even though the artist catches his intuitive stroke to create the paintings, he still maintain some degrees of control in his work since it was his hand and mind that determine the final work. I think what random about art is the artist come up with a methodology or workflow of creating and then he loses his control of his own workflow and let the invention does its own work without being affected by the artist himself.

“Blackboard” by Cy Twombly

Ammar Hassonjee – Looking Outwards 09

For this Looking Outwards project, I chose to focus on my classmate Jai Sawkar’s Looking Outwards 07 post. In this post, he talks about a project called Phantom Terrains created by Frank Swain and Daniel Jones which is an abstract representation of the data streams around us and is an attempt to visualize the invisible flows of data that run from our devices to routers back to our devices. The algorithm that drives Phantom Terrains works by having wireless data streams be transferred to a hearing aid, which then interprets the data flows as audio representations and sound signals. The sound signals can then be visualized as a topographic like map then.

A sample image showcasing the auditory signals and graph at the bottom and the information visualization of the data stream at the top.

I agree with Jai’s point that the project is very interesting in that it’s a compelling graphic that visualizes something we might not necessarily be able to see. In fact, it requires us to use our other senses of hearing to create a graphical information representation. The link to the website can be found here.

Mari Kubota- Looking Outwards- 09

The blog post I looked at was Ankitha Vasudev’s post on a time lapse animation called Flight Pattern (2011) by Aaron Koblin. Flight Pattern displays a 24 hour time period of American air traffic patterns and densities, by following the routes of around 140,000 American planes crossing the United States. I found this project interesting because the time lapse animation visually shows how widespread and frequent travel inside of America is. Aaron Koblin’s use of  color and patterns to illustrate a wide range of data including aircraft type, no-fly zones, weather patterns and alteration to routes helps to visualize large amounts of data into one concise animation. I also agree with Ankitha’s opinion that uses the time lapse animation and the data gathered for it in order to show the intertwining of humans and technology. The animation shows that human movement is synonymous to the movement of technology. 

Taisei Manheim – Looking Outward – 09

A project that I thought was interesting when looking through different posts was Jai Sawkar’s Looking Outward post for week 7.  The project was called Phantom Terrains and was by Stefanie Posavec.  For this project she tries to make us aware of the invisible silent wireless data signals that surround us translating the characteristics of the wireless signal into sound.  She also created a graphic to depict the wireless network landscape on a walk around the BBC Broadcasting House.

I agree with Jai that this creates a very compelling graphic and that it is interesting how she managed to take a phenomena that is constantly occurring around us without us sensing it and recreating it so we could experience it with multiple of our senses.  Also, for our studio in architecture we had a mapping project in which we had to map parts of an island that can’t be seen, such as wind or the history of the island and it is interesting to see how they used different pitches, colors, and line thicknesses to denote different aspects of the wireless signals.

link to project

Stefanie Posavec, Frank Swain and Daniel Jones: Phantom Terrains

Ankitha Vasudev – Looking Outwards – 09

A Looking Outwards assignment that I found interesting was Mari’s post on 3DQ, which is a digital agency based in Barcelona that specializes in Hospitality and Interior Design and Architecture Computer Generated Images (CGI). In her post, Mari focused on the project The Coworking 2040, which was made using Corona Renderer in 2017.

I found this project intriguing because of how realistic it looks and how efficient the process behind making it seemed. Usually, photo realism rendering is a very time-consuming process; however, 3DG is able to create detailed design, composition, lighting and texturing in a very creative and flexible way. I agree with Mari’s comments about the usefulness of creating a tool to visualize a space without actually creating it since it allows people to get a feel of the space without jeopardizing money or time.

As an architecture student, the work by this studio is inspirational because the designers know how to build realistic scenes fast with the right amount of detail versus geometry. Their workflow seems ideal because they have a good balance between technique and creativity.

Video showing the blending of layers

Lanna Lang – Looking Outwards – 09

Jenny Sabin’s “PolyMorph” // 2013

As I was looking through previous Looking Outwards responses, I was very intrigued with Ilona’s post about Sabin’s work because, in my own scope of work, I am very interested in the interaction between the natural and the digital, and “PolyMorph” caught my eye as it perfectly sits in that spot. I totally agree with Ilona when she said that this project – although the structure mimics natural forms– it could not have been created without the use of technology, but it also could not have been created without the use of the human hands that cast, fire, and glaze the ceramic pieces joined with the robot arms in her lab studio that were used for 3D printing.

What I love about this project is how intricate it is: the structure is made up of 1400 pieces with 1300 different connection combinations and then built into a geometric structure that simulates geometry in nature. I personally love the intertwining of organic designs with technology and digital fabrication. Sabin uses her knowledge in architecture, design, biology, and mathematics to design material structures that are made of traditional art mediums as well as digital art mediums.

A few combinations of the individual components that make up “PolyMorph”
How the individual components fit together with each other to create the whole structure
“PolyMorph”: After all 1400 individual pieces are structured

Siwei Xie – Looking Outwards 09

“They Rule” is one of the pioneers in revealing the implications and power of data visualization, as well as the role that data designers play in them in a scenario where data was starting to be abundant. My peer did not add her thoughts in the assessment, she mainly described what the project is, which I agree with the facts. 

I can add more of my original thoughts to her assessment. I think “They Rule” is a starting point for research on these powerful individuals and corporations. Network visualization allows corroborating things that are known but not seen until then as directors of powerful companies repeating themselves in more than one company, concentrating power in a few. 

However, “They Rule” is not a real-time representation of a dataset as the formation of company directories is constantly changing. Currently, we find many representations of power networks of politicians, businessmen, corporations, knowledge networks, etc. What makes “They Rule” is that it was one of the pioneering projects in making visible the relationships between individuals that constitute the power class.

Link to my peer’s assessment. SooA Kim, Looking Outwards 07, 10/11/2019.

Link to the original source. Josh On, “They Rule”, 2001.

Josh On, “They Rule”, 2001.

Emma NM-LO-09

Jenny Lee’s LO-06

eCLOUD by Aaron Koblin

I took a look at Jenny Lee’s Looking Outward post for week 6. It examined the project eCLOUD, which is an every change sculpture of a cloud. I think this project is so cool. The way the cloud changes the degree of brightness based on the weather to emulate a real cloud is so fascinating. I saw a bit in the video of when it was storming, the cloud flashed white briefly to mimic lightning. I would agree with my peer’s thoughts. She and I both agree this project is really cool based on it’s physical appearance and the connection to real weather. One thing that I don’t like very much is that the eCLOUD changes cities every few moments. I feel like the audience would not even realize that the cloud changed city when looking at it for a longer time than minute. I would also love to visit this airport to see it in person, but I wonder if updates could be provided after so many years? Maybe look into changing the shape of the cloud in addition to the brightness of each panel?

eCLOUD installed in San Jose Airport

Permanent Installation between gates 22 and 23 in San Jose International Airport

Shannon Ha – Project 04 – String Art

sketch

//Shannon Ha
//Section D
//sha2@andrew.cmu.edu
//Project 04 String Art

function setup() {
    createCanvas(400, 300);
  }

function draw(){
  background(175,0,0);
  stroke('black')
  for (var i = 0; i < width; i+=20) {
    stroke(mouseX, mouseY, 210); //upper left corner arc
    line(mouseX-i,0,0,i+20);
    stroke(28,50,158);
    line(mouseX+i,0,0,i-20);
    stroke(255, 227, mouseX-10);//lower right corner arc
    line(mouseX-i,300,400,i-20);

}
  for (var i = 0; i < 500; i+=30) {
    push();
    translate(width/2, height/2);
    rotate(180);
    stroke(93,28,158);
    line(5,5, mouseX/2, i+1); //purple lines in the back
    rotate(90);
    line(5,5, mouseX/2, i+1);

    pop();
  }


    ellipseMode(CENTER); //the moving pupil of the eye
    noFill();
    ellipse(mouseX-200, height/2 ,100,100);
    strokeWeight(2);


  }

For this project I explored how the lines met to form arcs and curves through iteration and ultimately decided it would be fun to make the string art so that it looks like an eye!