Final Project

sketchDownload

//Yanina Shavialenka
//Section B

var numPressed = 1; //Counts number pressed
var r = 174;
var g = 198;
var b = 207;
var cycle = false; //records whether a cycle has occured

//Picture variables
var earth;
var hand;
var airplane;
var car;
var beach;
var factory;
var smoke;
var deforestation;

//Array of pictures and objects
var thermometer = [];
var loadTherm = [];
var planes = [];
var hands = [];
var loadHand = [];
var loadSmokes = [];
var texts = [];

//Function that preloads images
function preload() {
    hand = loadImage("https://i.imgur.com/yj0wtAM.png");
    earth = loadImage("https://i.imgur.com/kHdVss0.png");
    airplane = loadImage("https://i.imgur.com/5UTfPON.png");
    car = loadImage("https://i.imgur.com/FFnoxXk.png");
    beach = loadImage("https://i.imgur.com/vpAjq6W.jpg");
    factory = loadImage("https://i.imgur.com/UAwSjh7.png");
    arrow = loadImage("https://i.imgur.com/QALHzw2.png");
    smoke = loadImage("https://i.imgur.com/RH9Ikd8.png");
    deforestation = loadImage("https://i.imgur.com/ybzFc92.jpg");

    var thermFiles = [];
    thermFiles[0] = "https://i.imgur.com/Gbbbv1a.png";
    thermFiles[1] = "https://i.imgur.com/SFaNzVE.png";
    thermFiles[2] = "https://i.imgur.com/FqY5tgi.png";
    thermFiles[3] = "https://i.imgur.com/BR7AC3a.png";
    thermFiles[4] = "https://i.imgur.com/tsBaLsK.png";
    thermFiles[5] = "https://i.imgur.com/QQs5VxM.png";

    for(var i = 0 ; i < thermFiles.length ; i++) {
        thermometer[i] = loadImage(thermFiles[i]);
    }

    var handFiles = [];
    handFiles[0] = "https://i.imgur.com/V3shALS.png";
    handFiles[1] = "https://i.imgur.com/qWRT7Nb.png";
    handFiles[2] = "https://i.imgur.com/obwct4k.png";
    handFiles[3] = "https://i.imgur.com/GwpjItB.png";
    handFiles[4] = "https://i.imgur.com/ip5YRk2.png";
    handFiles[5] = "https://i.imgur.com/sYgwV8p.png";

    for(var i = 0 ; i < handFiles.length ; i++) {
        hands[i] = loadImage(handFiles[i]);
    }
}

//Functions that make objects to specific images
function makeThermometer(num) {
    var c = { x: 85, y: 150, imageNum: num,
            drawFunction: drawThermometer
    }
    return c;
}

function makeHand(num) {
    var c = { x: 265, y: 350, imageNum: num,
            drawFunc: drawHand
    }
    return c;
}

function makeSmoke(x1,y1) {
    var c = { x: x1, y: y1,
            drawFun: drawSmoke,
            stepFun: stepSmoke
    }
    return c;
}

//Functions that draw objects
function drawThermometer() {
    image(thermometer[this.imageNum],this.x,this.y);
}

function drawHand() {
    image(hands[this.imageNum],this.x,this.y);
}

function drawSmoke() {
    image(smoke,this.x,this.y);
}

//Function that moves smoke at specific intervals
function stepSmoke() {
    if(numPressed == 2){
        this.x += 0.1;
        this.y += 1;
    }
    if(numPressed == 3){
        this.y += 1;
    }
    if(numPressed == 4){
        this.x -= 0.15;
        this.y += 1;
    }
    if(numPressed == 5){
        this.x -= 0.5;
        this.y += 1;
    }
}

//Loads canvas and initial objects
function setup() {
    createCanvas(600, 600);
    background(r,g,b);
    loadTherm.push(makeThermometer(0));
    loadHand.push(makeHand(0));
    initialSmokes();
}

function draw() {
    imageMode(CENTER);

    //Resizes objects
    airplane.resize(140,125);
    car.resize(80,45);
    factory.resize(145, 65);
    deforestation.resize(80, 80);
    beach.resize(100, 80);
    smoke.resize(40,100);

    //Square that helps with not stacking new objects over initial
    fill(174,198,207);
    square(0,0,600);
    noFill();

    //Resizes all Thermometers
    for(var i = 0 ; i < thermometer.length ; i++) {
        thermometer[i].resize(300,300);
    }

    //Draws functions
    for(var i = 0 ; i < loadTherm.length ; i++) {
        loadTherm[i].drawFunction();
        loadTherm.splice(0,loadTherm.length-1); //Deletes previous thermometers to not overlap
    }

    //Draws hand
    for(var i = 0 ; i < loadHand.length ; i++) {
        loadHand[i].drawFunc();
    }

    //Remakes initial smoke objects if cycle is completed
    if(cycle) {
        initialSmokes();
        cycle = false;
    }
    
    image(earth,300,420);
    image(airplane, 140, 100);
    image(car, 210, 80);
    image(factory, 300, 55);
    push();
    rotate(radians(7));
    image(deforestation, 400, 20);
    image(beach, 500, 100);
    pop();
    fill(0);
    textSize(18);
    texts.push(text('4 Main Components:',430,450));
    noFill();

    //Draws smokes objects
    for(var i = 0 ; i < loadSmokes.length ; i++) {
        loadSmokes[i].drawFun();
    }

    //Moves smoke and text based on number pressed condition
    if(numPressed == 2) {
        fill(0);
        textSize(16);
        texts.push(text('•Transportation',430,470))
        noFill();
        while( loadSmokes[numPressed - 2].y < 340 ){
            loadSmokes[numPressed - 2].stepFun();
            loadSmokes[numPressed - 2].drawFun();
        }
    }
    if(numPressed == 3) {
        fill(0);
        textSize(16);
        texts.push(text('•Factories',430,480))
        noFill();
        while( loadSmokes[numPressed - 2].y < 320 ){
            loadSmokes[numPressed - 2].stepFun();
            loadSmokes[numPressed - 2].drawFun();
        }
    }
    if(numPressed == 4) {
        fill(0);
        textSize(16);
        texts.push(text('•Deforestation',430,490))
        noFill();
        while( loadSmokes[numPressed - 2].y < 330 ){
            loadSmokes[numPressed - 2].stepFun();
            loadSmokes[numPressed - 2].drawFun();
        }
    }
    if(numPressed == 5) {
        fill(0);
        textSize(16);
        texts.push(text('•Other livelihoods',430,500))
        noFill();
        while( loadSmokes[numPressed - 2].y < 370 ){
            loadSmokes[numPressed - 2].stepFun();
            loadSmokes[numPressed - 2].drawFun();
        }
    }
}
function keyTyped() {
    //Resets smokes and changes cycle to true to show that a cycle has occured
    if(numPressed == 0){
        loadSmokes.splice(0,loadSmokes.length);
        cycle = true; 
    }
    //Changes thermometer and hand to next image
    if(key == 'g' || key == 'G') {
        print(numPressed);
        loadTherm.push(makeThermometer(numPressed));
        loadHand.push(makeHand(numPressed));
        loadTherm.splice(0,loadTherm.length-1); //Deletes previous thermometers to not overlap
        numPressed++;
    }
    //Resests after cycle
    if(numPressed == 6){
        numPressed = 0;
    }
}

//Function to draw initial smokes
function initialSmokes() {
    loadSmokes.push(makeSmoke(210,140));
    loadSmokes.push(makeSmoke(295,130));
    loadSmokes.push(makeSmoke(380,145));
    loadSmokes.push(makeSmoke(460,240));
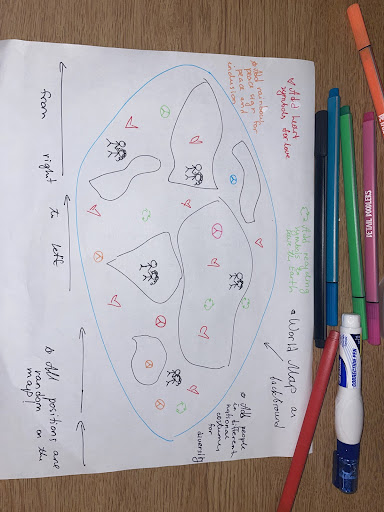
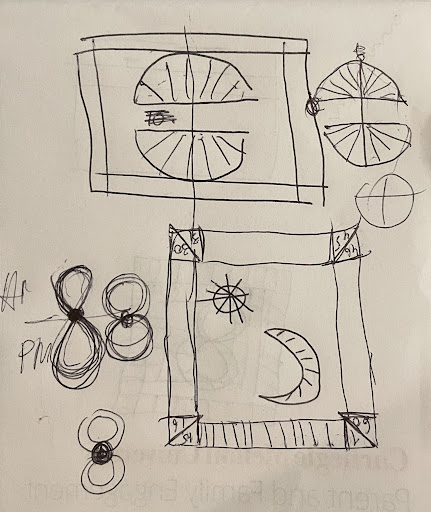
}

This final project’s theme is climate change and I decided to show in my work, an interactive image, how human actions affect the Earth and cause climate change. In the image, you can see a picture of a human palm inside of which there’s our planet Earth – this represents the idea that everything is in our hands and that everything we do affects our planet: we can either save it and give it protection or kill it. Either way, everything depends on us. On the first four fingers, from pointer to pinky, we can see the smoke of evaporation coming down from top to middle towards the Earth and each finger in this group of four represents four components that cause global climate change: transportation such as cars and planes, factories, deforestation, and other livelihoods of a person such as construction works, food, the garbage that isn’t getting recycled, increased use of electricity, etc. Starting from the pointer finger, an interactive image will start working when a user clicks on a key “g” or “G” which stands for “Go”, the first smoke will go down towards the Earth and the arrow on the thumb will make a small step towards the thermometer which increases in temperature. Moreover, with every click we can see the name of each component pop up on the screen to tell the user what it is. Then when the user clicks on the key again, the second smoke will slide down towards the Earth, the arrow makes another step, and the temperature gets higher. The same thing will happen to the third and fourth click. However, when the user clicks on the key fifth time, the arrow on the thumb will make the final step from the Earth towards to top of the finger which will make the temperature on the thermometer fill to the top which represents the maximum hotness. This project shows that those four human components affect the Earth in a negative way and when we combine them all together, it increases the speed with which the temperature gets higher.
I was inspired to do this project because as a little girl I always liked winters due to a big amount of snow: I would go snow sliding to the hills with my family every year and it was so much fun! However, in the past few winters, there were only a few days when it snowed meaning our Earth is getting warmer day by day and we cannot do some of our favorite winter activities anymore.
If I had more time to do this project then I would have added more pictures such as I would do more research to find more components that affect the Earth but so far I decided to stick with 4 big, main, and obvious factors.

Project Landscape

sketchDownload

//Yanina Shavialenka
//Section B

/*
The following project was written with an intention to represent world
peace, love, diversity, and care for the planet. I used world map to
represent the world, people in different national outfits to represent 
people from around the world, love symbold to represent love, rainbow 
peace sign to represent peace in the world and inclusion, recycling 
symbol to represent the fact that we need to recycle and save our planet. 
*/

//Initial arrays for images and objects
var people = [];
var world = [];
var symbol = [];
var loadPeople = [];
var loadSymbol = [];
var worldmap;
//Value of change of movement
var dx1 = 1.5;

//Preloads images
function preload() {
    var file = [];
    file[0] = "https://i.imgur.com/PAWmbXw.png";
    file[1] = "https://i.imgur.com/t0fgBq2.png";
    file[2] = "https://i.imgur.com/SkGPugf.png";
    file[3] = "https://i.imgur.com/dbMZm7H.png";
    file[4] = "https://i.imgur.com/L1ODD20.png";
    file[5] = "https://i.imgur.com/b5hpqxP.png";

    for(var i = 0 ; i < file.length; i++) {
        people[i] = loadImage(file[i]);
    }

    var file1 = [];
    file1[0] = "https://i.imgur.com/IRxGbDw.png";
    file1[1] = "https://i.imgur.com/Xkq7Q0x.png";
    file1[2] = "https://i.imgur.com/w9crIqx.png";

    for(var i = 0 ; i < file1.length; i++) {
        symbol[i] = loadImage(file1[i]);
    }

    worldmap = loadImage("https://i.imgur.com/LhjqpdM.png");
    world.push(makeBackground(0,0,dx1));
}

function setup() {
    createCanvas(480, 480);
}

//Object functions that create object
//Below function has an object for background
function makeBackground(cx,cy,cdx) {
    var c = { x: cx, y: cy, dx: cdx,
            stepFunction: stepBackground,
            drawFunction: drawBackground
    }
    return c;
}

//Below function has an object for characters
function makeCharacter(cx, cdx, num) {
    var r = random(320);
    var c = { x: cx, y: r, dx: cdx,
            imageNum: num,
            stepFun: stepCharacter,
            drawFun: drawCharacter
    }
    return c;
}

//Below function has an object for symbols
function makeSymbol(cx, cdx, num) {
    var r = random(320);
    var c = { x: cx, y: r, dx: cdx,
    	    imageNum: num,
            step: stepSymbol,
            draw: drawSymbol
    }
    return c;
}

//Object functions that move objects
function stepBackground() {
    this.x -= this.dx; 
}
function stepCharacter() {     
    this.x -= this.dx; 
}
function stepSymbol() {     
    this.x -= this.dx; 
}

//Object functions that draw objects
function drawBackground() {
    image(worldmap,this.x,this.y);
}
function drawCharacter() {
    image(people[this.imageNum],this.x,this.y);
}
function drawSymbol() {
    image(symbol[this.imageNum],this.x,this.y);
}


function draw() {
    background(220);
    
    //random values
    var num = random(people.length - 2);
    num = int(num);
    var num1 = random(symbol.length);
    num1 = int(num1);
    var peopleCount = random(100,200);
    peopleCount = int(peopleCount);
    var symbolCount = random(300);
    symbolCount = int(symbolCount);

    //moves and draws map
    for(var i = 0 ; i < world.length ; i++) {
        world[i].stepFunction();
        world[i].drawFunction();
    }

    //when the latest world x postion is 0, a new map is drawn at x coordinate of the world map width
    if(world[world.length-1].x <= 0) {
        world.push(makeBackground(802,0,dx1));
    }

    //new position for people and symbols
    if(frameCount % peopleCount == 0) {
        loadPeople.push(makeCharacter(480,dx1,num));
    }
    
    if(frameCount % symbolCount == 0) {
        loadSymbol.push(makeSymbol(480,dx1,num1));
    }
    
    //moves and draws people and symbols
    for(var i = 0 ; i < loadPeople.length ; i++) {
        loadPeople[i].stepFun();
        loadPeople[i].drawFun();
    }

    for(var i = 0 ; i < loadSymbol.length ; i++){ 
        loadSymbol[i].step();
        loadSymbol[i].draw();
    }
}

For this week’s project, I decided to portray the idea of utopia where all people around the world live in peace, love, and inclusion. I used the background of a world map to represent the world; people in different national outfits to represent the people around the world; love symbol to represent love; rainbow peace sign to represent peace and inclusion; recycling symbol to represent the idea that we need to recycle to save the earth and have that ideal utopia.

In my project, I encountered a problem with a background since I used an image instead of drawing it out myself: when the image would end, it would not reappear so I came with an idea to use a double image “glued” together which eventually did the trick. Overall I really enjoyed this assignment and found it really fun to work on!

Original sketch of the design and idea

LO-11

The technological field has been and still is filled with a lot of stereotypes and biases surrounding people’s gender, race, or sexuality. It is a concrete fact that only 20% of professional computer scientists are women and only 5.8% of professional computer scientists are African American. Even though the 21st century US appears to be a progressive utopia, there’s still a lot of stigma around the technology and its developers. 

For this week’s Looking Outwards I chose an article by Meilan Solly called “Art Project Shows Racial Biases in Artificial Intelligence System”. This article addresses an issue of racial bias in the artificial intelligence tool ImageNet Roulette that was developed by artist Trevor Paglen and A.I. researcher Kate Crawford. What this tool was programmed to do is identify some characteristics of a person based on the photograph such as a photo of John F. Kennedy would be labeled “Politician” and a photo of Shakira would be labeled “Singer”. This tool seems to be impressive, right? But not everything is so simple, so perfect, so equal. When an African American young man, Tabong Kima, uploaded a photograph of himself and his friend to the tool, the ImageNet Roulette labeled him as “Wrongdoer, Offender”.  “I  might have a bad sense of humor, but I don’t think this is particularly funny”, said Kima on his Twitter page. The developers of the tool programmed descriptions such as dog, Boy Scout, or hairdresser, while others were rapist, adultress, loser, etc. The program seemed to identify white individuals largely in terms of occupation or other functional descriptors, but it classified those with darker skin solely by race and skin color: when an African American man uploaded a picture of himself the tool was only to describe him as “Black” and when an East Asian woman uploaded a photo of herself the tool described her as “Gook, Slant-eye”. The bias and racism here are seen crystal clear. 

This tool was taken off the Internet on September 27th, 2020, due to the existence of so many offensive and upsetting terms that were used to describe human beings. “We want to show how layers of bias and racism and misogyny move from one system to the next,” Paglen tells the New York Times’ Cade Metz. “The point is to let people see the work that is being done behind the scenes, to see how we are being processed and categorized all the time.” The creators of the tool told the press that the point of this project was to show the bias towards the race but my question would be just: Why? What for? Not everyone knew the point of this tool so it upset and offended a lot of people on the Internet when racist slurs popped up as their descriptions. This article pointed out how ImageNet Roulette was wrong and how it only increased the stigma around race and technology rather than got rid of it. The bias obviously exists and we shouldn’t prove it by creating more racist technology – we should fix it!

How artificial intelligence classified Julia Carrie Wong’s headshot. Photograph: ImageNet Roulette

https://www.smithsonianmag.com/smart-news/art-project-exposed-racial-biases-artificial-intelligence-system-180973207/

Solly, M. (2019, September 24). Art Project Shows Racial Biases in Artificial Intelligence System. Smithsonian.com. Retrieved November 13, 2021, from https://www.smithsonianmag.com/smart-news/art-project-exposed-racial-biases-artificial-intelligence-system-180973207/. 

Sonic-Story

sketchDownload

//Yanina Shavialenka
//Section B

var walkImage = [];   // an array to store the images
var flying = []; //bird flying array images
var characters = [];
var birds = [];
var bg; //background image
var lightning; //lighting picture
var thunder; //thunder sound
var amb; //ambient sound
var chirp; //bird sound

function preload(){
    // These URLs are for the individual walk cycle images
    var filenames = [];
    filenames[0] = "https://i.imgur.com/14ifmej.png";
    filenames[1] = "https://i.imgur.com/r9GhjWn.png";
    filenames[2] = "https://i.imgur.com/A0L2KVp.png";
    filenames[3] = "https://i.imgur.com/JFE5CBm.png";
    filenames[4] = "https://i.imgur.com/14ifmej.png";
    filenames[5] = "https://i.imgur.com/r9GhjWn.png";
    filenames[6] = "https://i.imgur.com/A0L2KVp.png";
    filenames[7] = "https://i.imgur.com/JFE5CBm.png";
    filenames[8] = "https://i.imgur.com/14ifmej.png";
    filenames[9] = "https://i.imgur.com/r9GhjWn.png";
    filenames[10] = "https://i.imgur.com/A0L2KVp.png";
    filenames[11] = "https://i.imgur.com/JFE5CBm.png";

    // These URLs are for the individual bird cycle images
    var file = [];
    file[0] = "https://i.imgur.com/82McfxQ.png";
    file[1] = "https://i.imgur.com/OMNJ7z2.png";
    file[2] = "https://i.imgur.com/ZP2mduv.png";
    file[3] = "https://i.imgur.com/2ly1P4T.png";
    file[4] = "https://i.imgur.com/5VNmIMy.png";
    file[5] = "https://i.imgur.com/KjJmaEd.png";
    file[6] = "https://i.imgur.com/036LD8g.png";
    file[7] = "https://i.imgur.com/OPD7VfW.png";
    file[8] = "https://i.imgur.com/Rt8p00H.png";

    // These for loops change the images to create a walking and flying effect
    for (var i = 0; i < filenames.length; i++) {
        walkImage[i] = loadImage(filenames[i]);
    }

    for (var i = 0; i < file.length; i++) {
        flying[i] = loadImage(file[i]);
    }

    //loads the images and sounds
    bg = loadImage("https://i.imgur.com/nqIhKWP.png");
    lightning = loadImage("https://i.imgur.com/6kvwrHw.gif");
    lightning.resize(150,0);
    thunder = loadSound("http://localhost:8000/thunder.wav");
    amb = loadSound("http://localhost:8000/amb.wav");
    chirp = loadSound("http://localhost:8000/bird.wav");
}

// Constructor for each walking character
function makeCharacter(cx, cy, cdx, cdy) {
    var c = { x: cx, y: cy, dx: cdx, dy: cdy,
             imageNum: 0,
             stepFunction: stepCharacter,
             drawFunction: drawCharacter
        }
    return c;
}

// Constructor for each blying bird
function makeBird(cx, cy, cdx, cdy) {
    var c = { x: cx, y: cy, dx: cdx, dy: cdy,
             imageNum: 0,
             stepFun: stepBird,
             drawFun: drawBird
        }
    return c;
}

function stepCharacter() {
    this.imageNum++;
    if(this.imageNum >= walkImage.length) {
       this.imageNum = 0;
    }
     
    this.x += this.dx; 
}

function stepBird() {
    this.imageNum++;
    if(this.imageNum >= flying.length) {
       this.imageNum = 0;
    }
     
    this.x += this.dx; 
}

//This function draws the corresponding image
function drawCharacter() {
    image(walkImage[this.imageNum],this.x,this.y);
}

function drawBird() {
    image(flying[this.imageNum],this.x,this.y);
}

//This function creates the canvas and makes the character
function setup() {
    createCanvas(612,408);
    frameRate(15);
    for (var i = 0; i < walkImage.length; i++) {
        walkImage[i].resize(150,0);
    }
    for (var i = 0; i < flying.length; i++) {
        flying[i].resize(50,0);
    }
    characters.push(makeCharacter(0,125,1,0));
    birds.push(makeBird(0,50,3,0));
    useSound(0);
}

function soundSetup() {
    thunder.setVolume(0.5);
    amb.setVolume(0.2);
    chirp.setVolume(0.1);
}

function draw() {
    background(bg);
    if(frameCount >= 100) {
        image(lightning,425,-10);
        image(lightning,-20,-10);
        thunder.play();
        tint(100);
        characters[0].stepFunction();
        characters[0].drawFunction();
        birds[0].stepFun();
        birds[0].drawFun();
        characters[0].dx = 4;
        birds[0].dx = 6;
    }
    else {
        characters[0].stepFunction();
        characters[0].drawFunction();
        birds[0].stepFun();
        birds[0].drawFun();
        amb.play();
        chirp.play();
    }
}

For me, this assignment was really challenging considering the fact that we did not spend a lot of time on the sound topic so I was really struggling and tried to come up with something interesting and easy at the same time. In my code I made a girl walk and a bird fly: I used a sound effect to represent the chirping of a bird and sounds of an outside world. Then, the lightning strikes and the thunder sound comes off with dark background.

I could not upload the file properly here because the thunder sound is more than WordPress accepts and thus the file was not able to get loaded onto here.

Generative Portrait

sketchDownload

 //Yanina Shavialena
 //Section B

//My portrait
var image;
//Places I've been/Want to go to
var words = ['Belarus','USA','Bulgaria','Poland','Spain','France','South Korea'];
//The state of mouse pressed
let pressedState = false;

//This function loads the image
function preload() {
    var imagelink= "https://i.imgur.com/CQ38vbw.jpg";
    image = loadImage(imagelink);
}
 
//This function created canvas and makes sure the picture is in dimensions of the canvas
function setup() {
    createCanvas(480, 480);
    image.resize(480, 480); 
    background(0);
    image.loadPixels();
    frameRate(10000000);
}
 
function draw() {
    //random x and y positions and get the color from that x and y from my portrait
    var x = random(width);
    var y = random(height);
    var c = image.get(x, y);

    if( pressedState == false){
        //random start controlling point
        var x1 = x + random(-25,25);
        var y1 = y + random(-25,25);
        //random final point
        var x3 = x + random(-15,15);
        var y3 = y + random(-15,15);
        //random final controlling point
        var x4 = x3 + random(-25,25);
        var y4 = y3 + random(-25,25);

        stroke(color(c));
        curve(x1, y1, x, y, x3, y3, x4, y4);

        //hearts at the beginning and final point
        heart(x,y,5,c);
        heart(x3,y3,5,c);
    }

    //puts words at random points
    else{
        noStroke();
        fill(c);
        textSize(random(10));
        text(random(words),x,y)
    }
}

//when mouse is pressed, mouseState is updated and the background is reset
function mousePressed(){
    if(pressedState == false) {
        pressedState = true;
    }
    else {
        pressedState = false;
    }
    background(0);
}

//creates hearts to use for the ends of the lines
function heart(x, y, size, color) {
    fill(color);
    beginShape();
    vertex(x, y);
    bezierVertex(x - size / 2, y - size / 2, x - size, y + size / 3, x, y + size);
    bezierVertex(x + size, y + size / 3, x + size / 2, y - size / 2, x, y);
    endShape(CLOSE);
}

I really enjoyed this project because I could finally implement the idea of pixels and creativity. It was hard to come up with something at first but then I thought about what could describe me in my portrait so I decided to use an emoji of a heart because I think love is one of the strongest feelings on Earth and after the click of a mouse multiple countries would pop up randomly to make up an image: one of the countries is where I was born, one of the countries is where I live right now, then the remaining countries are where I visited or where I want to visit.

A Focus on Women and Non-binary Practitioners in Computational Art

When we talk about technology or computer science, and specifically about games or software developers, many always imagine them to be men. It is true since only 20% of computer science professionals are women thus it is understandable that many may assume that some specific developer will be a man and not a woman.

For this Looking Outwards writing assignment I chose an incredible woman, a woman thanks to whom this class of 15-104 even exists. It is Lauren Lee McCarthy, lead developer of p5.js! The project that obviously fascinates me is the development of p5.js but for this week’s I chose a McCarthy’s project called “I’m Glad You Asked”. “Commissioned for the NRW Forum AR Biennale in Düsseldorf, “I’m glad you asked” spreads over the museum grounds, augmenting the social landscape of the park.” I admire this project because it was created with an intention to bring people together, to create new acquaintances, friendships, relationships. On the museum grounds there were multiple benches that were virtually labeled with many different phrases that would pop up on your phone screen after scanning the bench. Some of these phrases were: “This bench is reserved for people who are feeling overwhelmed”, “This bench is reserved for people who have a lot of questions”, “This bench is reserved for people who are missing someone”, “This bench is reserved for someone who enjoys quiet”. People who identified themselves with some specific phrases would sit on the bench and another person could come up and ask them something like: “Hi, excuse me but do you also miss someone?” or “Are you also feeling overwhelmed”. It’s always easier to talk to strangers about your problems since their opinion about you won’t be biased and will most likely be true. The aspect of this project that I admire is the fact that such small talks could grow into big friendships and maybe even potential romantic relationships. If two people have something in common then this spontaneous conversation will start on its own.

Lauren Lee McCarthy (she/they) is an artist examining social relationships in the midst of surveillance, automation, and algorithmic living. Lauren has a BS Computer Science and BS Art and Design degrees from MIT and MFA degree from UCLA where she currently works as an Associate Professor for UCLA Design Media Arts. She is working with performance, software, electronics, internet, film, photography and installation. As it was stated before, Lauren is the lead developer of the p5.js, “an open-source art and education platform that prioritizes access and diversity in learning to code, with over 1.5 million users. She expands on this work in her role on the Board of Directors for the Processing Foundation, whose mission is to serve those who have historically not had access to the fields of technology, code, and art in learning software and visual literacy.” (https://lauren-mccarthy.com/Info)  In many of her computational projects, Lauren uses the idea of communication and interaction with other people or where new people meet other new people due to her social anxiety. Lauren once stated that she felt jealous of how Amazon Alexa has an intimate place in people’s lives without even trying. McCarthy uses her knowledge of computer science and her unique thinking and creativity to help people socialize and learn more about technology, especially if people didn’t have a chance or opportunity to do so before. Her actions are very honorable and I respect Lauren as a human being and as a programmer. “I create performances inviting viewers to engage. To remote control my dates. To be followed. To welcome me in as their human smart home… Each work feels like an attempt to hack my way out of myself and into closeness with others. I am embodying machines, trying to understand that distance between the algorithm and myself, the distance between others and me. There’s humor in the breakdown, and also moments of clarity. Who builds these artificial systems, what values do they embody? Who is prioritized and who is targeted as race, gender, disability, and class are programmatically encoded? Where are the boundaries around our intimate spaces? In the midst of always on networked interfaces, what does it mean to be truly present?” These excerpts from Lauren’s personal statement show us that she truly cares for people and that she truly loves what she does. 

https://lauren-mccarthy.com/Im-glad-you-asked – link to the project

https://lauren-mccarthy.com – Lauren Lee McCarthy’s website

These 4 images represent how the “I’m Glad You Asked” works when you scan the bench. Lauren Lee McCarthy’s “I’m Glad You Asked”

The Creative Practice of an Individual

For this week’s Looking Outwards writing assignment I chose to write about Lucianne Walkowicz. Lucianne was born in 1979 in NYC and she is an astronomer at the Adler Planetarium located in the city of Chicago. In the 2017-2018 Lucianne was given a Baruch S. Blumberg NASA/LOC Chair in Astrobiology! As an astronomer, she studies the ethics of Mars exploration, how stars influence a planet’s suitability as a host for alien life, stellar magnetic activity, and how to use advanced computing to discover unusual events in large astronomical data sets. Walkowicz holds a BS in Physics and Astronomy from Johns Hopkins University, an MS and PhD in Astronomy from the University of Washington, and held postdoctoral fellowships at UC Berkeley and Princeton prior to joining the Adler Planetarium. Lucianne is a very bright, warmhearted and open minded person. She described herself as privileged to study space – many would feel proud or even get cocky about the fact that  they’re studying the aspects of space, yet she said she felt privileged because she understands that it is a dream of many but not everyone gets to do it.

I admire Lucianne and the work that she does. In the 2019 Eyeo Festival, Lucianne said that astronomers have to tell people what they owe to them. She is studying space not only because she is interested in it and because it fascinates her, she studies it so she could educate other people about it. In 2011, when Lucianne moved back to her hometown NYC, she along with other astronomers would hop on the train and ride from first to last stop holding signs that tell people to ask them any questions about space. She would spend her time and energy riding the train and giving people the opportunity to find out more about space. I respect her for what she does. Lucianne’s main goal was to not make people be interested in science but rather make them feel that they can access and do science themselves. She was all about equity and inclusion. The research showed that only around 37% of Discovery channel viewers are women so her goal was to make the idea of science be more broad and available for everyone. In 2018, Walkowicz co-founded The JustSpace Alliance, a nonprofit organization whose mission is to advocate for a more inclusive and ethical future in space, and to harness visions of tomorrow for a more just and equitable world today.

Lucianne presents her ideas through charts/graphs, pictures, videos and even art. She understands that many science related terms wouldn’t be too clear for many people so she uses visual representations to help people understand many different concepts. I really enjoyed her artistic project called “40 Orbits” which was performed as a dance in the air using electronic sound effects and LED lights. I  felt as if I was watching a movement of a star in space – her aura and her movements made it seem like magic. Lucianne understands that many people are visually oriented so she created a meditation space where a person can sit and not only watch the stars and many constellations, but also listen to the stars move around! It is simply unimaginable. Lucianne made this project using her artistic abilities and a lot of technology to represent unearthly sounds of stars. I admire that project the most because it gives people the opportunity to focus on their spiritual aspects by listening to the stars. Many people don’t have the opportunity to even study space so Lucianne makes this experience available to everyone.

What I can learn about how to present my own work from Lucianne is the fact that I have to do the work not only for myself but also for others. My work can be educational and inspiring for others so I want to make my work accessible for everyone because the learning process shouldn’t be done alone. I want to use many visual representations as well in presenting my work to catch the attention and to make the ideas presented seem more easier and understandable. 

https://www.tangledfields.com/about

Eyeo 2019 – Lucianne Walkowicz

Curves

sketch

//Yanina Shavialenka
//Section B

var n;
var heartShape = [];
var theta = 0;
var nPoints = 55;

function setup() {
    createCanvas(480, 480);
}

function draw() {
    background(map(mouseX, 0, width, 0, mouseY));
    heartCurve();
    epitrochoidCurve();
    hypotrochoidCurve();
    astroidCurve();
}

function heartCurve() {
    //https://mathworld.wolfram.com/HeartCurve.html
    push();
    fill(255, 153, 255);
    stroke(73, 84, 216);
    translate(width/2, height/2-35);//changes (0,0) point to center the heart in the middle
    beginShape(); //Begins to draw heart curve
    for (var v of heartShape) {
        vertex(v.x, v.y); 
    }
    endShape(); //Ends drawing heart curve
    //The following equations were taken from teh MathWorld
    var radius = height / 40; //sets how big the heart is on the canvas
    var xPos = 16 * pow(sin(theta), 3) * radius;
    var yPos = (13 * cos(theta) - 5 * cos(2 * theta) - 2 * cos(3 * theta) - cos(4 * theta)) * -radius;
    heartShape.push(createVector(xPos, yPos));
    theta += 0.8; //changes the angle by 0.8 each time which increases the outer blue stroke
    pop();
}

function epitrochoidCurve() {
    //https://mathworld.wolfram.com/Epitrochoid.html
    var b = 3.5; 
    var h = (b + 5) + mouseX/100;
    var a = mouseX/b;
    push();
    noFill();
    stroke(0, 0, mouseX);
    translate(180, height/2-50);
    /*
    Changes (0,0) point to center the epitrochoid on the 
    left side of a heart.
    */
    beginShape(); //Begins to draw epitrochoid curve
    //The following equations were taken from teh MathWorld
    for(var t = 0; t <= TWO_PI; t += PI/110){
        var xPos = (a+b) * sin(t) - h * sin(((a+b)/b) * t);
        var yPos = (a+b) * cos(t) - h * cos(((a+b)/b) * t);
        vertex(xPos,yPos);
    }
    endShape(); //Ends drawing epitrochoid curve
    pop();
}

function hypotrochoidCurve() {
    //https://mathworld.wolfram.com/Hypotrochoid.html 
    var b = 3.5; 
    var h = mouseY/2; //As height increases, the get little sharp crown circles
    //As height decreases, we get oval star curves instead of crown circles
    var a = mouseX/b;
    push();
    noFill();
    stroke(mouseX, 0, 0);
    translate(width/2+70, height/2-35);
    /*
    Changes (0,0) point to center the hypotrochoid on the 
    right side of a heart.
    */
    beginShape(); //Begins to draw hypotrochoid curve
    //The following equations were taken from teh MathWorld
    for (var i = 0; i <= nPoints; i ++) {
        var t = map(i, 0, 50, 0, TWO_PI);
        var xPos = (a-b) * cos(t) + (h * cos(((a-b)/b) * t));
        var yPos = (a-b) * sin(t) - (h * sin(((a-b)/b) * t));
        vertex(xPos,yPos);
    }
    endShape(); //Ends drawing hypotrochoid curve
    pop();
}

function astroidCurve() {
    //https://mathworld.wolfram.com/Astroid.html
    var a = map(mouseX, 0, width, 0, height);
    push();
    noFill();
    stroke(0, mouseX, 0);
    translate(width/2, 300);
    /*
    Changes (0,0) point to center the astroid at the 
    bottom of a heart.
    */
    beginShape(); //Begins to draw astroid curve
    //The following equations were taken from teh MathWorld
    for (var i = 0; i < height; i++) {
        var t = map(i, 0, width, 0, TWO_PI);
        var xPos = 3 * a * cos(t) + a * cos(3 * t);
        var yPos = 3 * a * sin(t) - a * sin(3 * t);
        vertex(xPos,yPos);
    }
    endShape(); //Ends drawing astroid curve
    pop();
}

|

In this project I drew the curve of a heart and inside of a heart there’s 3 addition curves. Epitrochoid and hypotrochoid in my opinion were kind of like opposite of each other since epitrochoid draws ellipses inside and hypotrochoid draws ellipses outside. For me it was kind of challenging to do this because I had to research a lot of new functions such as Math.pow and many things for me didn’t work so I had to change the curves multiple times for them to work. It was interesting to analyze how angles of 0.1 or 1 would affect the curves, sometimes the smaller the angle the bigger the shape became which is polar opposite of what would I have expected.

Information Visualization

The project that I chose for this week’s Looking Outwards is called “Selfiecity” and it was coordinated by Dr. Lev Manovich. Selfiecity is an interactive project that analyzes the way people take selfies: in 5 different cities – Bangkok, New York, Moscow, Berlin, and Sao Paulo – the data of people’s selfies was collected to find many different patterns such as who smiles the most, who has more reserved looks, do angry people tilt their heads more strongly or what is a characteristic mood for people in Moscow. 

I admire this project because it focuses on different cities all around the world instead of focusing on just specific ethnicity, culture or gender which shows more inclusion and diversity.  

Selfiecity used different theoretic, artistic, quantitative, computational and data visualization methods to collect all the data. For example, Manovich’s team created an algorithm called Imageplots that assembled thousands of selfies to reveal interesting patterns and the team also created an interactive application called Selfiexploratory which allowed them to navigate the whole set of 3200 photos for the project. Selfiexploratory took into consideration matters such as location (1 of the 5 cities), age, gender, pose of looking up or down, tilt or turn of a head left or right, eyes and mouth open or closed, glasses or no glasses, calm, angry or happy. It’s fascinating how the team was able to create an application to take into consideration all of those things from just a simple selfie! 

“This project is based on a unique dataset we compiled by analysing tens of thousands of images from each city, both through automatic image analysis and human judgement.” Manovich’s team randomly selected 120,000 photos, approximately 20,000-30,000 photos per city, from a total of 656’000 Instagram posts. After the selection, the team made 2-4 Amazon’s Mechanical Turk workers tag each photo by answering the simple question of “Does this photo show a single selfie?” The next step was to choose the top 1000 photos for each city and submit them to Mechanical Turk again to more skilled workers to guess the age and gender of the person in the selfies. With the top image selection, the team ran Selfiexploratory app to analyze the details. Finally, one or two members of Manovich’s team examined all these photos manually to find any mistakes and rounded the photos down to only 640 selfies per city. 

The creator’s artistic sensibilities manifest in the final form by finding out many interesting facts about selfies. For example, Manovich’s team found out that only 3-5% of images they analysed were actually selfies. The other 95-97% were pictures of cats, food, houses, artwork, other people like friends, etc. We always assume that people, especially Gen Z, take a lot of selfies lately, however only 3-5% of the photos analyzed were actually selfies. Moreover, the team found that in Moscow 82% of selfies were taken by women rather than men and Moscow has the least smiling selfies. 

I think this project is very interesting because it focuses on the idea of a selfie and analyzes things such as tilt of a head or having glasses on. Many people wouldn’t even think that any data can be collected from a selfie, however data collected from a selfie in different cities can be used to find many cultural differences and lifestyles.

http://selfiecity.net

Dr. Lev Manovich, Selficity, 2014
Process of Selfiecity
Main findings from the project of Selfiecity

Tartan Clock

sketchDownload

//Yanina Shavialenka
//Section B
//yshavial@andrew.cmu.edu

var x = 15;
var y = 15;

var xSpeed = 1;
var ySpeed = 0;

var xCircleSec = 40;
var yCircleSec = 30;

var xCircleMin = 70;
var yCircleMin = 60;

var xCircleHour = 103;
var yCircleHour = 103;

function setup() {
    createCanvas(480, 480);
    background(220);
    text("p5.js vers 0.9.0 test.", 10, 15);
}

function draw() {
    background(160, 160, 160);
    seconds();
    minutes();
    hours();
}

function seconds() {
    stroke(255, 255, 0);
    fill(0, 102, 0);
    square(x, y, 450);

    /*
    These for loops draw the 13 lines on the green square to 
    make space for the seconds.
    Counting starts at top left triangle to the right and 
    continues clockwise.
    */
    for(var i=37.5; i<=420; i+=28.8) {
        stroke(255, 255, 0);
        line(x+i, y, x+i, y+37.5);
    }
    for(var i=37.5; i<=420; i+=28.8) {
        stroke(255, 255, 0);
        line(x+412.5, y+i, x+450, y+i);
    }
    for(var i=37.5; i<=420; i+=28.8) {
        stroke(255, 255, 0);
        line(x+i, y+412.5, x+i, y+450);
    }
    for(var i=37.5; i<=420; i+=28.8) {
        stroke(255, 255, 0);
        line(x, y+i, x+37.5, y+i);
    }
    
    // These are 4 corner lines for seconds.
    line(x, y, x+37.5, y+37.5);
    line(x+450, y, x+412.5, y+37.5);
    line(x+450, y+450, x+412.5, y+412.5);
    line(x, y+450, x+37.5, y+412.5);
    
    //Ball for seconds.
    fill(0);
    circle(xCircleSec, yCircleSec, 10);

    /*
    These if-else statements check when to move the position of the ball
    based on the seconds.
    */   
    if(15 <= second() & second() < 30) {
        xCircleSec = width - 32;
        yCircleSec = 38 + 28.8 * (second() - 15);
        xSpeed = 0;
        ySpeed = 1;
    }
    else if(30 <= second() & second() < 45) {
        xCircleSec = width - 38 - 28.8 * (second() - 30);
        yCircleSec = height - 33;
        xSpeed = -1;
        ySpeed = 0;
    }
    else if(second() >= 45) {
        xCircleSec = 33;
        yCircleSec = height - 38 - 28.8 * (second() - 45);
        xSpeed = 0;
        ySpeed = -1;
    }
    else if(second() < 15) {
        xCircleSec = 38 + 28.8 * second();
        yCircleSec = 33;
        xSpeed = 1;
        ySpeed = 0;
    }
}

function minutes() {
    stroke(255, 255, 0);
    fill(0, 0, 190);
    square(x+37.5, y+37.5, 375);

    /*
    These for loops draw the 13 lines on the green square to 
    make space for the minutes.
    Counting starts at top left triangle to the right and 
    continues clockwise.
    */
    for(var i=75; i<=375; i+=23.07) {
        stroke(255, 255, 0);
        line(x+i, y+37.5, x+i, y+75);
    }
    for(var i=75; i<=375; i+=23.07) {
        stroke(255, 255, 0);
        line(x+375, y+i, x+412.5, y+i);
    }
    for(var i=75; i<=375; i+=23.07) {
        stroke(255, 255, 0);
        line(x+i, y+375, x+i, y+412.5);
    }
    for(var i=75; i<=375; i+=23.07) {
        stroke(255, 255, 0);
        line(x+37.5, y+i, x+75, y+i);
    }
    
    // These are 4 corner lines for minutes.
    line(x+37.5, y+37.5, x+(37.5*2), y+(37.5*2));
    line(x+412.5, y+37.5, x+375, y+(37.5*2));
    line(x+412.5, y+412.5, x+375, y+375);
    line(x+37.2, y+412.5, x+(37.5*2), y+375);
    
    //Ball for minutes.
    fill(0);
    circle(xCircleMin, yCircleMin, 10);

    /*
    These if-else statements check when to move the position of the ball
    based on the minutes.
    */ 
    if(15 <= minute() & minute() < 30){
        xCircleMin = width - 72;
        yCircleMin = 56 + 23.07 * (minute() - 15);
        xSpeed = 0;
        ySpeed = 1;
    }
    else if(30 <= minute() & minute() < 45) {
        xCircleMin = width- 55 - 23.07 * (minute() - 30);
        yCircleMin = height - 72;
        xSpeed = -1;
        ySpeed = 0;
    }
    else if(minute() >= 45) {
        xCircleMin = 72;
        yCircleMin= height- 56 - 23.07 * (minute() - 45);
        xSpeed = 0;
        ySpeed = -1;
    }
    else if(minute() < 15) {
        xCircleMin = 56 + 23.07 * minute();
        yCircleMin = 72;
        xSpeed = 1;
        ySpeed = 0;
    }
}

function hours(){
    stroke(255, 255, 0);
    fill(240, 20, 20);
    square(x+75, y+75, 300);
 
    //These lines divide 24 spaces for hours
    stroke(255, 255, 0);
    line(x+75, y+121.14, x+121.14, y+75);
    line(x+75, y+167.28, x+167.28, y+75);
    line(x+75, y+213.42, x+213.42, y+75);
    line(x+75, y+259.56, x+259.56, y+75);
    line(x+75, y+305.7, x+305.7, y+75);
    line(x+(37.5*2), y+351.84, x+351.84, y+(37.5*2));

    line(x+98.07, y+375, x+375, y+98.07);
    line(x+144.221, y+375, x+375, y+144.21);
    line(x+190.35, y+375, x+375, y+190.35);
    line(x+236.49, y+375, x+375, y+236.49);
    line(x+282.63, y+375, x+375, y+282.63);
    line(x+328.77, y+375, x+375, y+328.77);

    line(113, 113, 367, 367);//Middle division line for hours
    
    //Ball for hours.
    fill(0);
    circle(xCircleHour, yCircleHour, 10);

    /*
    These if-else statements check for the hours.
    The position of a circle updates based on the hour 0-23. 
    Upper and bottom triangles represent 12 am and 12 pm or 
    00:00 and 12:00.
    Counting starts from 00:00 at the top triangle and goes clockwise.
    */
    if(hour() == 0) {
        xCircleHour = 103;
        yCircleHour = 103;
        xSpeed = 1;
        ySpeed = 1;
    }
    else if(hour() == 1) {
        xCircleHour = 140;
        yCircleHour = 110;
        xSpeed = 1;
        ySpeed = 1;
    }
    else if(hour() == 2) {
        xCircleHour = 175;
        yCircleHour = 120;
        xSpeed = 1;
        ySpeed = 1;
    }
    else if(hour() == 3) {
        xCircleHour = 210;
        yCircleHour = 130;
        xSpeed = 1;
        ySpeed = 1;
    }
    else if(hour() == 4) {
        xCircleHour = 245;
        yCircleHour = 140;
        xSpeed = 1;
        ySpeed = 1;
    }
    else if(hour() == 5) {
        xCircleHour = 280;
        yCircleHour = 150;
        xSpeed = 1;
        ySpeed = 1;
    }
    else if(hour() == 6) {
        xCircleHour = 317;
        yCircleHour = 160;
        xSpeed = 1;
        ySpeed = 1;
    }
    else if(hour() == 7) {
        xCircleHour = 340;
        yCircleHour = 185;
        xSpeed = 1;
        ySpeed = 1;
    }
    else if(hour() == 8) {
        xCircleHour = 350;
        yCircleHour = 220;
        xSpeed = 1;
        ySpeed = 1;
    }
    else if(hour() == 9) {
        xCircleHour = 360;
        yCircleHour = 260;
        xSpeed = 1;
        ySpeed = 1;
    }
    else if(hour() == 10) {
        xCircleHour = 360;
        yCircleHour = 305;
        xSpeed = 1;
        ySpeed = 1;
    }
    else if(hour() == 11) {
        xCircleHour = 370;
        yCircleHour = 340;
        xSpeed = 1;
        ySpeed = 1;
    }
    else if(hour() == 12) {
        xCircleHour = 377;
        yCircleHour = 377;
        xSpeed = 1;
        ySpeed = 1;
    }
    else if(hour() == 13) {
        xCircleHour = 340;
        yCircleHour = 370;
        xSpeed = 1;
        ySpeed = 1;
    }
    else if(hour() == 14) {
        xCircleHour = 305;
        yCircleHour = 360;
        xSpeed = 1;
        ySpeed = 1;
    }
    else if(hour() == 15) {
        xCircleHour = 265;
        yCircleHour = 355;
        xSpeed = 1;
        ySpeed = 1;
    }
    else if(hour() == 16) {
        xCircleHour = 235;
        yCircleHour = 340;
        xSpeed = 1;
        ySpeed = 1;
    }
    else if(hour() == 17) {
        xCircleHour = 200;
        yCircleHour = 325;
        xSpeed = 1;
        ySpeed = 1;
    }
    else if(hour() == 18) {
        xCircleHour = 165;
        yCircleHour = 315;
        xSpeed = 1;
        ySpeed = 1;
    }
    else if(hour() == 19) {
        xCircleHour = 150;
        yCircleHour = 285;
        xSpeed = 1;
        ySpeed = 1;
    }
    else if(hour() == 20) {
        xCircleHour = 135;
        yCircleHour = 255;
        xSpeed = 1;
        ySpeed = 1;
    }
    else if(hour() == 21) {
        xCircleHour = 130;
        yCircleHour = 215;
        xSpeed = 1;
        ySpeed = 1;
    }
    else if(hour() == 22) {
        xCircleHour = 120;
        yCircleHour = 175;
        xSpeed = 1;
        ySpeed = 1;
    }
    else if(hour() == 23) {
        xCircleHour = 110;
        yCircleHour = 140;
        xSpeed = 1;
        ySpeed = 1;
    }
}

|

This project was very difficult in the aspect of just coming up with ideas how to make it look like a clock without it actually being a clock. My outer green square represents seconds: each side has 15 seconds such as it is easy to count time by quoters. Blue square stands for minutes with same description for how it works. The pink square represents hours. Two triangles in top left and bottom right corners represents 12 am and 12 pm or 00:00 and 12:00.

I’ve used primary colors of CMU such as green, blue, red, yellow and black to make it a Tartan Clock.