Christine Kim – Looking Outwards-04

1
2
3
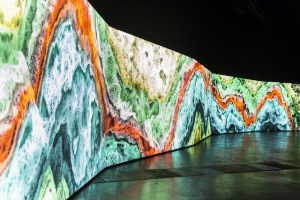
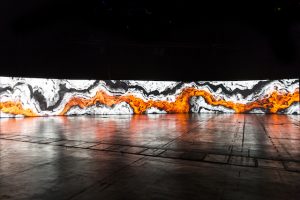
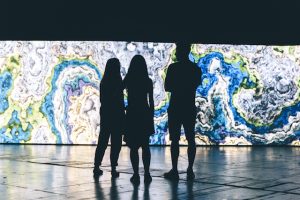
Semiconductor’s ‘Earthworks‘ for SonarPLANTA

The art duo Semiconductors Ruth Jarman and Joe Gerhardt created Earthworks, which is an installation that can replicate the images and sounds of the Earth’s dynamic movement. While the Earth moves, it creates visuals in waveforms with different colors. Jarman and Gerhardt worked with colored layers of sand and recorded the timelapse of the Earth movement over thousands of years and then worked with the seismic data. They record the seismic data and those digital information becomes a waveform that translate to sounds. The main tool for this project was MATLAB (Matrix Laboratory) that packs all the data like location, instrument, frequency, and timeframe, into one packet. I suppose those data along with the sound recording of the Earth movement were computed to create visuals that represent how the Earth was moving for thousands of years. I could not find an exact algorithm that they used. Because the sound generates visuals in this project, you can assume that sound determines how the visuals are formed. This project allows one to connect and feel the Earth. It is so interesting that Jarman and Gerhardt were able to literally record the sound of Earth and from that create images of the Earth movement and formation. Jarman and Gerhardt’s passion for nature, technology, and science clearly show through this project and further leads others to question and explore the Earth.

4
5
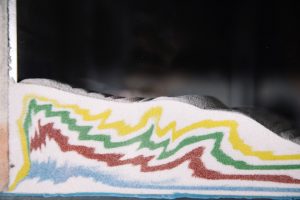
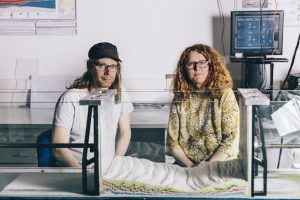
Joe Gerhardt and Ruth Jarman at University of Barcelona with the study model of sand

Earthworks

Sofia Syjuco – Looking Outwards-04

Bach Style Chorale
David Cope
2012

A project that particularly interested me was David Cope’s EMI program, or Experiments in Musical Intelligence. I really admire Cope’s relationship to the project, how he treats it not as a way to exploit loopholes in human expectations of music, or something purely technical, but a natural progression of how we continue to understand composing music. I admire this because, I think too often that new media arts have a controversy surrounding them, and people ask questions like – is this even real art anymore? Can this still count as being creative if the computer does it for you? I personally think that these questions are ridiculous, and really admire how David Cope’s artistic sensibilities and thoughts on this subject manifest in the final form – something that generates music based on data, but ultimately contains mistakes or problems which humanize it in some way, blurring the line between what we consider a pristine and soulless work made by a machine, or a piece of music, perhaps not all too skillfully made but still interesting, created by something affectionately nicknamed “Emmy”.

Kyle Lee Line Art

I wanted to keep the pattern simple and clean. Although this isn’t as groundbreaking or experimental, I certainly helped me understand how to use for loops to create curves.


kdlee-project-04

function setup() {
    createCanvas(600, 600);
}

function draw() {
    background(255);//white
    strokeWeight(1);//thin line
    var spacing = 25; // How far apart is each line
    var increment = 50;// double spacing, offsets lines, growth

    for (var i = 0; i < 25; i = i + 1) {//20 lines
        var x = (0 + i * spacing);
        var y = (0 + i * spacing);

        stroke("#FC4BAB");//pink
        line(x, 0, width, y);

        stroke("#FCCA53");//yellow
        line(0, y, x, height);

        stroke("#03C9BA");//green
        line(0, y, width - x, 0);

        stroke("#343AE9");//blue
        line(x, height, width, height - y);
    }
}

Sofia Syjuco – Project-04

sketch

var strokeColorR = 0; // stroke color R value
var strokeColorG = 255; // stroke color G value
var strokeColorB = 0; // stroke color B value

function setup() {
    createCanvas(640, 480); // make a canvas 800x200
    background (244, 120, 100); // background color
    
  for (var i = 1; i < 10; i++) {// add 1 to i every loop, 10 times
    strokeColorR += 30;// add 30 to stroke R color
    strokeColorG -= 20;// subtract 20 to stroke G color
    strokeColorB += 30; // add 30 to stroke B color
    stroke(strokeColorR, strokeColorG, strokeColorB); // stroke color
    strokeWeight (8); // thicker lines at 8
    line(i*20, 200, 200, 200-(i*20)); // top left quadrant lines
    line(200, 200-(i*20), 400-(i*20), 200); // top right quadrant lines
    line(i*20, 200, 200, 200+(i*20)); // bottom left quadrant lines
    line(200, 200+(i*20), 400-(i*20), 200); // bottom right quadrant lines
  }
 }
function draw() {
}

In my process for this assignment, I sketched out all the points on a piece of paper for one quadrant of the piece, and slowly worked from there. Once I had figured out how the for loop would work with one quadrant, I worked on trying to better understand how altering the values of the first quadrant could accomplish drawing the next three.

rgriswol – LookingOutwards-04

Alex McLean, also known as Yaxu, released an album in 2016 called Spicule. What is unique about this album is that it is released as a live coding device on Pi Zero. You can also digitally download it. You can play mastered Spicule tracks “over high quality line outputs” and you can also plug it into your computer and “live code algorithmic patterns” to change and create “special versions” of Yaxu’s tracks. Yaxu also created TidalCycles, an open source live coding environment based off of his 16 years of experience with making algorithmic dance music. It makes sound through “SuperDirt” which in and of itself is live-codeable. It is also implemented through Haxell, a “pure functional programming language” which allows patterns to be created and combined with code. The patterns are also functions of rational time. Because the project is open source, many musicians can now use the project. Crowdfunding recently ended in August, but contributors got access to the album, pattern reel, and/or device depending on how much they donated.

Project-04-StringArt

sketch

/*
* Rachel Griswold
* rgriswol@andrew.cmu.edu
* Section B
* Project 04
*
*/

function setup() {
    createCanvas(640, 480);
}

function draw() {
	background(140, 205, 255);

	for (var i = 0; i < 320; i ++) {
		var n = (i * 100);
		stroke(252, 258, 192);
        strokeWeight(1);
    	line(width/2, height/2, 0 - n/2, n);
    	// ^ bottom right hand yellow lines
    	line(width/2, height/2, 640 + n/2, n);
    	// ^ bottom left hand yellow lines
    	line(width/2, 0, 0 - n/2, n);
    	// ^ top right hand yellow lines
    	line(width/2, 0, 640 + n/2, n);
    	// ^ top left hand yellow lines
    }
    for (var i = 0; i < 240; i = i + 10) {
    	stroke(252, 89, 83);
    	strokeWeight(2);
    	line(width/2, i, width/2 + i, height/2);
    	// upper right hand red-ish curve
    	line(width/2, height - i, width/2 + i, height/2);
    	// bottom right hand red-ish curve
    	line(width/2, i, width/2 - i, height/2);
    	// upper left hand red-ish curve
    	line(width/2, height - i, width/2 - i, height/2);
    	// bottom left hand red-ish curve

        strokeWeight(1.5);
    	line(width, 0, width/2 + i, height/2);
    	// upper right hand red-ish "triangle"
    	line(width, height, width/2 + i, height/2);
    	// bottom right hand red-ish "triangle"
    	line(0, 0, width/2 - i, height/2);
    	// upper left hand red-ish "triangle"
    	line(0, height, width/2 - i, height/2);
    	// bottom left hand red-ish "triangle"
    }
}


Although I feel like I learned a lot more about lines and loops, I still felt quite frustrated during this process and I feel like I still need to practice much more to be fully comfortable. The almost halo-like effect from the yellow lines wasn’t intentional at first, but after I figured out how to do it I actually ended up liking it.

JihoonPark_project04

sketch

//Jihoon Park
//Section A
//jihoonp@andrew.cmu.edu
//project-04: String Art

var i;
var j;
var k;
var l;
var space = 50; //space between starting points of lines
var countX = 9; //number of lines in X axis of a quarter
var countY = 7; //numver of lines in Y axis of a quarter
var boxW = 150; // width of a box
var speed = 1.3; 
var dir = 1;
var vertX = 0; // x coordinate of vertex
var vertY = 0; // y coordinate of vertex
var vertW = 0.5*boxW; // vertex limit

function setup() {
	createCanvas(640, 480, WEBGL);
	noCursor();

}

function draw() {
	background(255);
	
	
	vertX+=dir*speed;
	if (vertX>=vertW) {
		dir=-dir;
	} else if (vertX<=-vertW) {
		dir=-dir;
	}
	//x coordinate of vertex goes back and forth
	vertY+=dir*speed;
	if (vertY>=vertW) {
		dir=-dir;
	} else if (vertY<=-vertW) {
		dir=-dir;
	}
	
	
	for (var k = -countX; k < 0; k=k+1) {
		beginShape(LINES);
		vertex(k*space, -height, 0);
		vertex(vertX, -vertY, 0);
		endShape();
		//bottom edge left half lines

		beginShape(LINES);
		vertex(k*space, height, 0);
		vertex(vertX, vertY, 0);
		endShape();
		//top edge left half lines
	}

	
	for (var  l= -countY; l < 0; l=l+1) {
		beginShape(LINES);
		vertex(-width, l*space, 0);
		vertex(vertX, -vertY, 0);
		endShape();
		//left edge bottom half lines
		
		beginShape(LINES);
		vertex(width, l*space, 0);
		vertex(-vertX, -vertY, 0);
		endShape();
		//right edge bottom half lines

	}

	
	for (var i = 0; i < countX; i=i+1) {
		beginShape(LINES);
		vertex(i*space, -height, 0);
		vertex(-vertX, -vertY, 0);
		endShape();
		//bottom edge right half lines
		
		beginShape(LINES);
		vertex(i*space, height, 0);
		vertex(-vertX, vertY, 0);
		endShape();
		//top edge right half lines
	}

	
	for (var  j= 0; j < countY; j=j+1) {
		beginShape(LINES);
		vertex(-width, j*space, 0);
		vertex(vertX, vertY, 0);
		endShape();
		//left edge top half lines
		
		beginShape(LINES);
		vertex(width, j*space, 0);
		vertex(-vertX, vertY, 0);
		endShape();
		//right edge top half lines
	}
	
	
	//box rotates
	rotateX(frameCount*0.02);
	rotateY(frameCount*0.02);
	ambientMaterial(200);
	box(boxW, boxW, boxW);


}

I created lines that could be seen as controlling lines for a box to rotate. However, since the canvas had to be a 3d space, I had to use begin/end shape with vertices.

String Art-04-sehenry

While working on this project, I became very comfortable with the for() function in p5.js. I started off just writing random for() functions but then saw how easy it was to manipulate the distances and lengths and positions of my shapes and variables. I spent a little too long on this because I wanted to make an eye in the middle of the frame but it was fun!

CLICK ON THE EYE!

sketch

//Seth Henry

//Section B 10:30 Tuesday

//sehenry@andrew.cmu.edu

//Assignment-String Art


function setup() {
    createCanvas(640, 480);
   
    text("p5.js vers 0.5.2 test.", 10, 15);
}

function draw() {
	background(220);
	fill('violet blue'); //randomcolors
	rect(0, 0, width, height); //background rectangle
	if (mouseIsPressed) {
	fill(255);
	strokeWeight(2);
	ellipse(width/2, height/2, 250, 250); //eyeball
	fill(0);
	ellipse(width/2, height/2, 100, 100); //pupil
	fill(255);
	ellipse(width/2+20, height/2-30, 10, 10);//whiteball
	strokeWeight(2);
	line(width/2-75, height/2-100, width/2+75, height/2-100); //top eyelid
	line(width/2-75, height/2+100, width/2+73, height/2+100); //bottom eyelid
	line(width/2-40, height/2-100, width/2-40, height/2-120); //eyelashes
	line(width/2, height/2-100, width/2, height/2-125);
	line(width/2+40, height/2-100, width/2+40, height/2-120);
	}
	
 	else {
 	strokeWeight(3);
 	fill(102,51,150);
	ellipse(width/2, height/2, 250, 250); //eyeball
	strokeWeight(3);
	line(195, 240, 444, 240); //eyelid
	line(220, 240, 180, 260); //eyelashes
	line(260, 240, 230, 280);
	line(380, 240, 410, 280);
	line(420, 240, 460, 260);
	for (var ln = 280; ln < 380 ; ln+=40){ //middle eyelashes
		line(ln, height/2, ln, height/2 + 50);
	}
	
	
	}
	strokeWeight(1)
	stroke(random(255), random(255), random(255));
	// for(var i = 1; i<640; i+=10){ //Makes a sequence of straight lines from the top left to the bottom right
	// line(i,50,50,i);	
	// }
	for(var e = 1; e < 640; e += 5){ //Makes a curve arching to the top left of the screen
	line(width-e, 50, 50, e);
	}
	for(var a = 1; a < 640; a += 10){ //Makes a curve arching to the top right 
	line(a, 50, width - 50, a);
	}
	for(var o = 1; o < 640; o += 10){ //Makes a curve arching to bottom right
	
	line(width-o, height -50, width - 50, o);
	}
	for(var p = 1; p < 640; p += 10){ //Makes a curve arching to the bottom left. 
	
	line(p, height - 50, 50, p);
	}

	
}
	//Previous curves that I decided to exclude

// 	for(var y = 1; y<640; y+=10){
// 		line(y,height-y, width-50,y);
// 	}
// 	for(var x = 1; x < 640; x+=5){
// 		line(width-x, height-x, 50, x);
// }


Liu Xiangqi-Looking Outwards-05

“Tilt Brush” is launched by Google, which enables users to paint sound. I think this project rather interesting because vision is still the more intuitive sense to human than other forms. Emotions can be expressed more clearly through visual effects. By converting sounds to images, users can understand the sound more.

The qualities of sound can be divided into volume, tone and tune, as images can be expressed by different colors, shapes and composition. I think the developers might have connect these qualities accordingly–use different qualities of sound to control their counterparts in images.

Information in vision can be more prominent than in hearing, so users might experience the sound more thoroughly.

Here is the link for the project.
The Tilt Brush by Google

Michal Luria – Looking Outwards – 04

AUDFIT

The project I would like to present this week is called “Audfit”, a project that combines sound, choreography and computing. This is a performance of a dancer that is connected to an “audio-costume”. Whenever the dancer moves, the movement sensor connected to a specific body part triggers a sound sequence in the audience’s headphones. Furthermore, the audience can choose from 3 audio channels to listen to while watching the choreography.

AUDFIT in action – a dancer with the audio costume and the sound it produces. credit: Strange Loop (vimeo)

What I like about this project is that the sound is generated according to the dancer’s movement, and that they have an interesting corresponding relationship between them. Also, the audience is able to choose between channels, and their choice of channel would change their experience, as the music is a significant part of the artistic message. Therefore, each person in the audience would have a slightly different experience from this performance, according to the timing in which they switched from channel to channel.

The technology behind this project is movement sensors connected to the dancer’s costume. Each time a sensor indicated motion, it triggered a sound sequence. These sound sequences were then combined to create new and interesting harmonies.