/*  Submitted by: Michal Luria
    Section A: 9:00AM - 10:20AM
    mluria@andrew.cmu.edu
    Assignment-07-Project
*/

var nPoints = 100; //points in the shape

function setup() {
  createCanvas(500, 500);
}

function draw() {
  background("Lavender");
  noStroke();

  push();
  translate(height/2, width/2); //center the work
  drawCurve(); //call curve drawing
  pop();

}

function drawCurve() {
    // base: Hypotrochoid

    var x; //controlled by mouseY
    var y;
    var x2; //controlled by mouseX
    var y2;

    var a = 300; //diam
    var b = a / 2; //radius
    var h = constrain(mouseY / 5, 0, a); //constrain the shape motion using mouseY
    var w = constrain(mouseX / 5, 0, a); //constrain the shape motion using mouseY

    beginShape();
    fill(180, 200, 255);

    //draw the shape according to the number of points it has
    for (var i = 0; i < nPoints; i++) {
        var t = map(i, 0, nPoints, 0, TWO_PI); //map points to a full circle

        x = (a - b) * cos(t) + h * cos((a-b) / b * t); //Hypotrochoid formula
        y = (a - b) * sin(t) - h * sin((a-b) /b * t);

        x2 = (a - b) * cos(t) - w * cos((a-b) * t); //Hypotrochoid formula with variations
        y2 = (a - b) * sin(t) * sin((a-b) * t);

        vertex(x, y); //draw the vertex
        vertex(x2, y2); //draw second vertex
    }
    endShape(CLOSE);

}

function mousePressed() {
    //when mouse is pressed, the number of point is the shape changes
    nPoints = random(70,250);
}
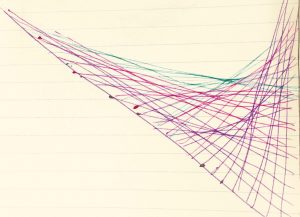
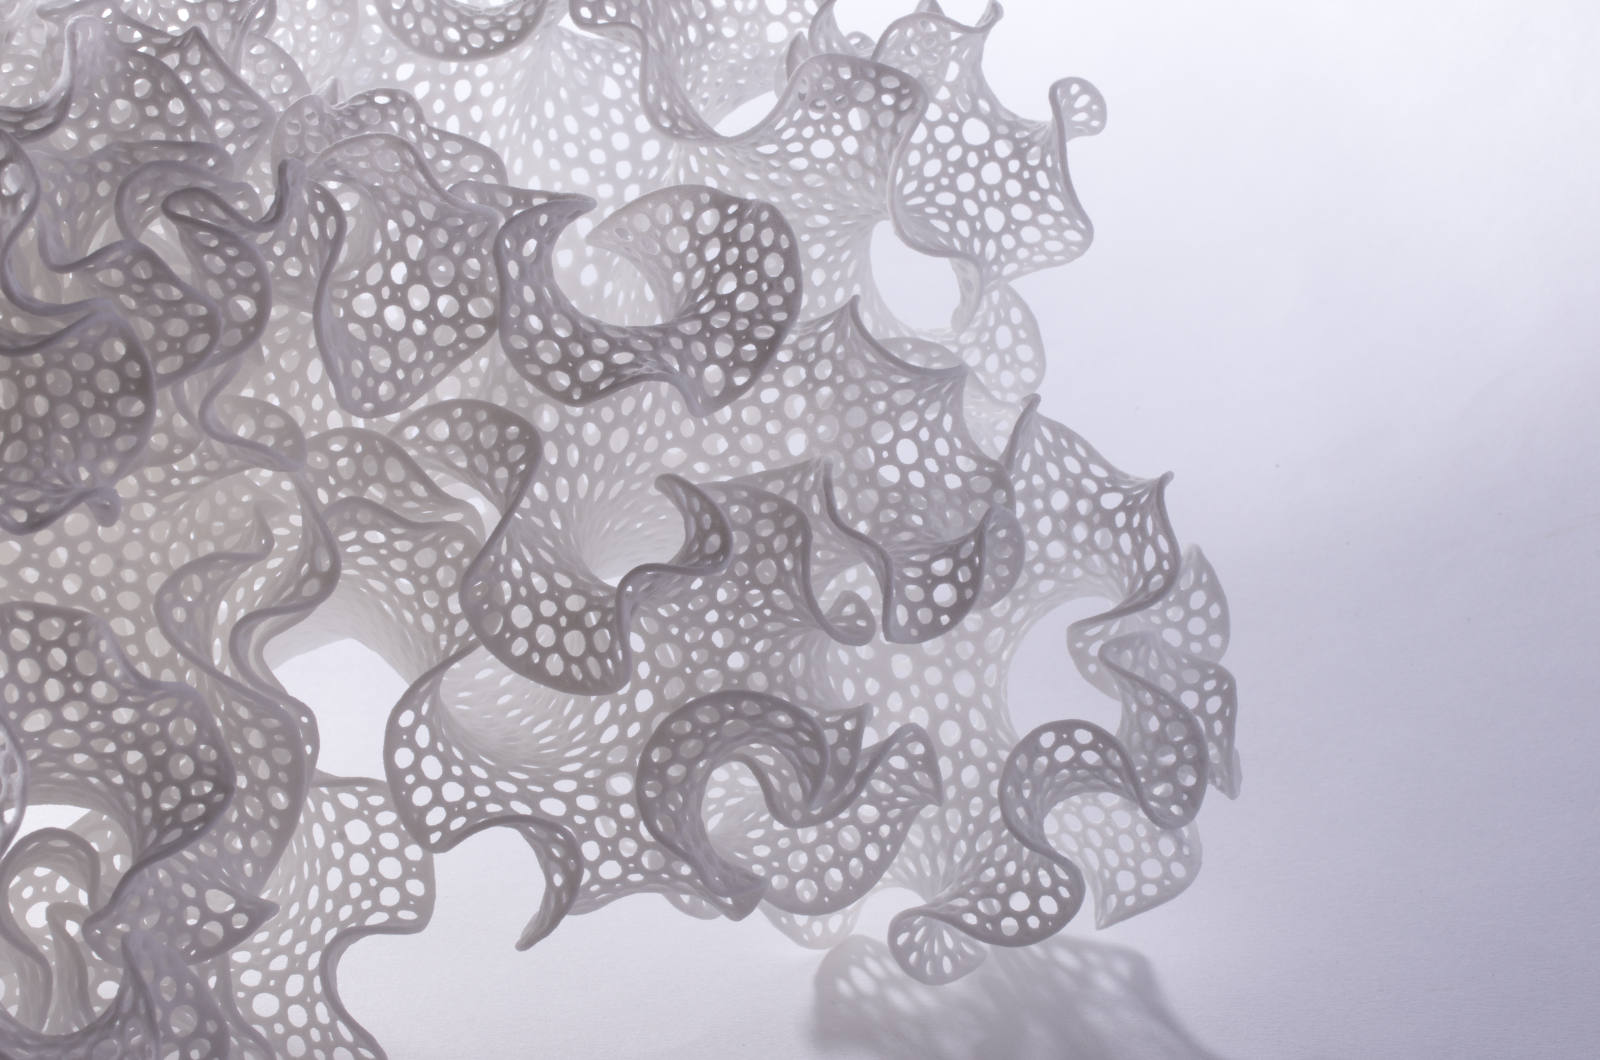
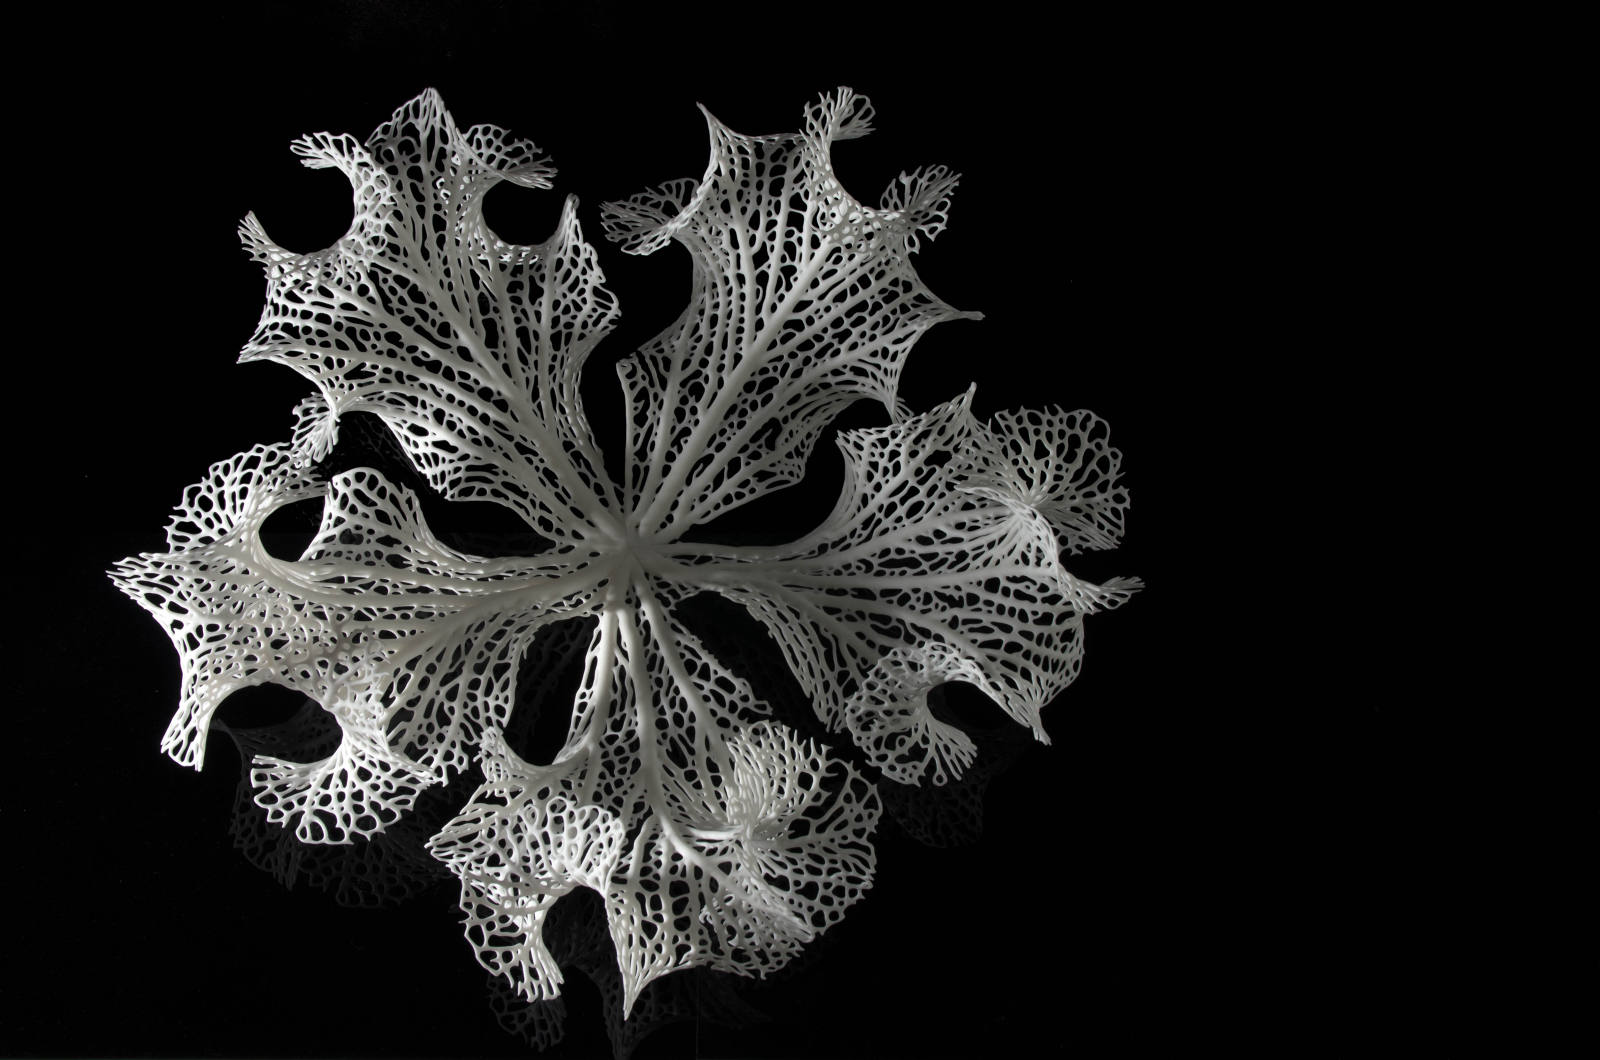
In this project, I started with a pretty simple equation of a Hypotrochoid. The shape turned out to be quite standard, but I wanted to create something that would use curves in a way that would be very difficult to physically draw, but easily computed. This is why I liked the idea of playing with the equation, and so I did. I ended up changing parts of it, which resulted in a interesting shape that evolves and moves according to the mouse coordinates (And it changes with every click!). I think that using the curve equations allowed beautiful continuous motion of a changing shape.
![[OLD – FALL 2016] 15-104 • COMPUTING for CREATIVE PRACTICE](../../../../wp-content/uploads/2020/08/stop-banner.png)
