![[OLD – FALL 2016] 15-104 • COMPUTING for CREATIVE PRACTICE](../../../../wp-content/uploads/2020/08/stop-banner.png)
var c1nPoints = 10; // Number of points for curve 1
var c2nPoints = 7; // Number of points for curve 2
function setup() {
createCanvas(500, 500);
frameRate(15);
}
function draw() {
// Draw the frame
fill(255, mouseX, mouseY);
rect(0, 0, width-1, height-1);
// Draw the curve
push();
translate(width / 2, height / 2);
drawCurve1();
drawCurve2();
pop();
}
// Relying on class notes for drawCranioidCurve() for Week 7 Deliverables
// Drawing this curve:
// http://mathworld.wolfsram.com/Scarabaeus.html - Sextic curve
function drawCurve1() {
strokeWeight(1.2);
fill(mouseX, mouseY, 255);
var x;
var y;
var r;
var a = constrain((mouseX / width), 0.0, 1.0);
var b = constrain((mouseY / height), 0.0, 1.0);
// Color depends on x and y movements of mouse
fill(mouseY, mouseX, 255);
beginShape();
for (var i = 0; i < c1nPoints; i++) {
var t = map(i, 0, c1nPoints, 0, TWO_PI);
// Curve 1 - Used equation from mathworld.com
r = (b + mouseY) * cos(2*t) -
(a + mouseX) * cos(t);
// Using code from class notes under "Deliverables Week 7"
x = r * cos(t);
y = r * sin(t);
vertex(x, y);
}
endShape(CLOSE);
}
function drawCurve2() {
strokeWeight(0.5);
var x;
var y;
var r;
var a = constrain((mouseX / width), 0.0, 1.0);
var b = constrain((mouseY / height), 0.0, 1.0);
// Color depends on x and y movements of mouse
fill(mouseX, mouseY, 255);
beginShape();
for (var i = 0; i < c2nPoints; i++) {
var t = map(i, 0, c2nPoints, 0, TWO_PI);
// Curve 2 - Used equation from mathworld.com
r = (b + mouseX) * cos(2*t) -
(a + mouseY) * cos(t);
// Using code from class notes under "Deliverables Week 7"
x = r * cos(t);
y = r * sin(t);
vertex(x, y);
}
endShape(CLOSE);
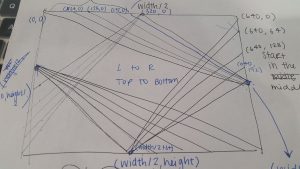
}The process for creating the project this week was different from what I usually do.
Because it was difficult to visualize how changing certain elements of my code would change what I saw, I could not really draw a sketch to plan what I wanted to created.
I went on the website provided to us and just picked a curve and to be honest, I relied pretty heavily on the template code that was provided to us. The end result of this project far exceeded my expectations, and I am super happy with the final result!
I especially really like that at one point when you are moving your mouse (move your mouse to the far left near the middle of the canvas!), the curves create a star.