![[OLD FALL 2017] 15-104 • Introduction to Computing for Creative Practice](../../../../wp-content/uploads/2020/08/stop-banner.png)
//Jihee Kim
//15-104 MWF 9:30
//jiheek1@andrew.cmu.edu
//Project 7 Curves
//section D

var backgroundRed;// Red value of background
var backgroundGreen = 245; // Green value of background
var backgroundBlue = 252;// Blue value of backgound

function setup() {
    createCanvas(480, 480);

}


function draw(){
    background(backgroundRed, backgroundGreen, backgroundBlue);
    //The background color changes from light blue to light pink
    //when mouseY moves from top to bottom of canvas
    backgroundRed = map(mouseY, 0, height, 219, 255); //R value changes

    push();
    translate(width/4, height/3); //push over the generating point of curves
    for (var i = 1; i < 16; i++) { //loop from first to sixteenth value
        //show depth through color and lineweight
        stroke(map(i, 1, 5, 30, 120)); //the stroke turns from grey to lighter
                                       //grey as the curve moves away from
                                       //the focal point of curves
        strokeWeight(map(i, 1, 5, 0.3, 2)); //strokeWeight increases as curves
                                            //get further away from focal point
        //call the drawCurve function to draw curves
        drawCurve(i*2); //use 'i' as scale factor for spacing between curves
        rotate(PI/3); //rotate each time a curve is drawn
    }
    pop();
}


function drawCurve(scaleF) { //using 'i' as the scale factor (scaleF)
    var a = 15;
    var b = (map(mouseX, 0, width, -1, 1)); //the curves form a hypocycloid
                                            //when b(radius of rolling circle)
                                            //is negative, and a epicycloid
                                            //when the value is positive
    noFill();
    //start shape
    beginShape();

    for (var i = 0; i < 200; i++) { //a bigger max gives you a smoother curve
        var t = map(i, 0, 200, 0, 2*PI); //map 't' so that it only rotates
                                         //full circle once (2PI)
        var x = (a + b) * cos(t) - b * cos((a/b + 1) * t);
        var y = (a + b) * sin(t) - b * sin((a/b + 1) * t);
        vertex(scaleF*x, scaleF*y);
    }
    //end shape
    endShape(CLOSE); //this caps the beginning and the end
}
For this project, I created an interactive set of curves that were generated though a mathematical equation. I made it so that the shape that the curves form morphs from a hypocycloid to an epicycloid (left to right) depending on the position of the mouse.
Some other aspects that I manipulated so that the main theme, which is depth, is clear are lineweights, color, and spacing. Using for loops and mapping, I made it so that the stroke turns from grey to a lighter color on the greyscale as the curves move away from the focal point of curves. Moreover, the lineweight of these curves also increases as the curves get further away from the focal point.
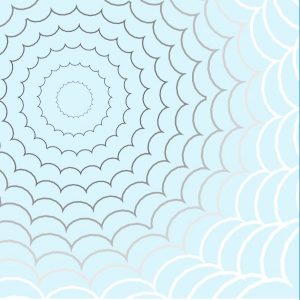

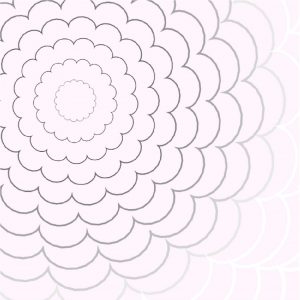
The curves are supposed to look like a sky full of clouds when they are forming a hypocycloid, and a flower when they are forming a epicycloid. The background color varies with the y position of the mouse, adding to the intention behind incorporating both cyclodal curves, as well.