![[OLD FALL 2017] 15-104 • Introduction to Computing for Creative Practice](../../../../wp-content/uploads/2020/08/stop-banner.png)
var iInc;
var colR;
var colG;
var p;
var q;
var curveSize;
function setup() {
createCanvas(480, 480);
}
function draw() {
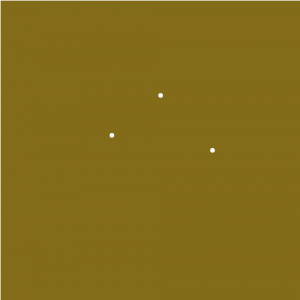
p = map (mouseY, 0, height, 1, 10);
q = map (mouseX, 0, width, 1, 15);
colR = map(mouseX, 0, width, 130, 20);
colG = map(mouseY, 0, height, 60, 110);
curveSize = map (mouseX, 0, width, 100, 200);
var k = p/q;
background(colR,colG, 10);
iInc = map (mouseY, 0, height, 0.05, 1.5);
translate (width/2, height/2);
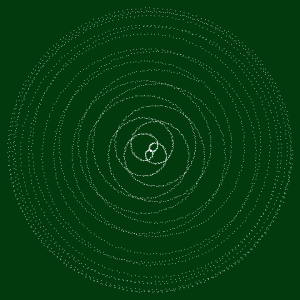
for (var i = 0; i < TWO_PI * q ; i+= iInc*1.2) {
var r = curveSize * cos (k*i);
var x = r * cos(i);
var y = r * sin(i);
fill(255,);
strokeWeight(iInc*5);
point (x+ random (-1, 1), y+random(-1, 1));
}
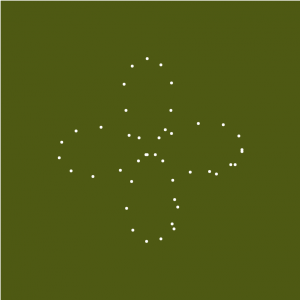
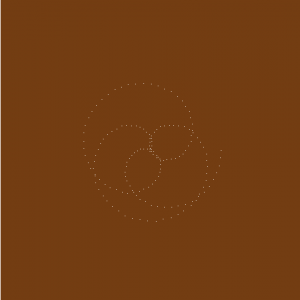
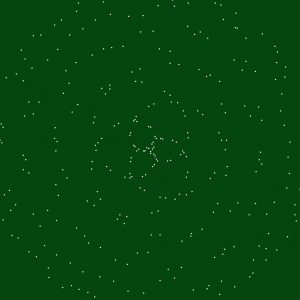
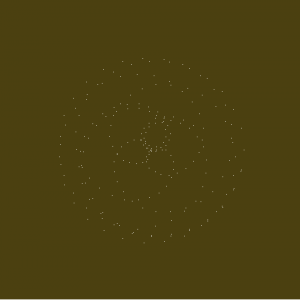
}For this project, I really wanted to play around with the jitter. I’m haven’t done any sort of math in a while so it was challenging for me to find my way around the curves. I decided to have more fun with it aesthetically and use dots to represent the curves because I think they’re more delicate and ephemeral.
The patterns and colours make it feel less mathematical and almost cozy like fall or early winter.