//SunMin Kim
//Section E
//sunmink@andrew.cmu.edu
//project-07

// http://mathworld.wolfram.com/Epicycloid.html

function setup() {
  createCanvas(480, 480);
  frameRate(10);
}

function draw() {
  background(139, 181, 115);
  //drawing is moving in the center
  translate(width/2, height/2);

  //draw the curve
  drawEpitrochoid();

}

function drawEpitrochoid() {
    var nPoints = 500;
    strokeWeight(1);
    fill(86, 149, 204);
    stroke(228, 213, 110);

    var x;
    var y;

    var h = constrain(mouseY, 0, 480);
    //radius of bigger ellipse
    var a = mouseX / 2;
    //radius of smaller ellipse
    var b = mouseX / 400;


    beginShape();
    for(var i = 0; i < nPoints; i ++){
        var t = map(i, 0, nPoints, 0, TWO_PI);
        //epitrochoid equation (x position)
        var x = (a + b) * cos(t) - h * cos (((a+ b)/b)*t);
        //epitrochoid equation (y position)
        var y = (a + b) * sin(t) - h * sin (((a+ b)/b)*t);

        vertex(x, y);
    }

    endShape();
}

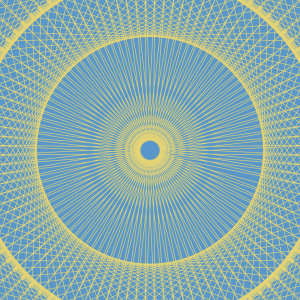
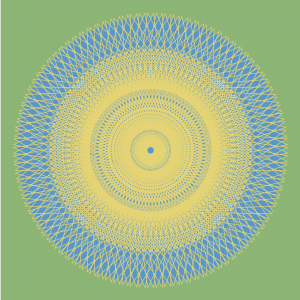
For this project, after reading the sample codes, I was excited to create art using various curves. Thus I took benefit of the formula provided in Wolfram Mathworld website and created this project. Throughout this project, I struggled the most when thinking about appropriate values for each variable. I feel good with the outcome that I successfully used each variable to display what I wanted to show.
![[OLD FALL 2017] 15-104 • Introduction to Computing for Creative Practice](../../../../wp-content/uploads/2020/08/stop-banner.png)