//Hanna Jang
//Section B
//hannajan@andrew.cmu.edu
//Project-07

var numberPoints=200;

function setup() {
	createCanvas(420, 420);
	frameRate(15);
}

function draw() {

//map the color background changes using r, g, b  and mouse
	var r=map(mouseX, 0, width, 0, 255);
	var g=map(mouseY, 0, height, 0, 90);
	var b=map(mouseX, 0, width, 0, 250);
	background(r, g, b, 30);

	//stroke
	stroke(240, 174, 231);
	strokeWeight(0.3);

	translate(width/2, height/2);
	drawEpitrochoid();
}

function drawEpitrochoid() {
	var x;
	var y;
	var h=100;
	var theta;

//variables to help modify change using mouse
	var a=map(mouseX, 0, width, 0, 20);
	var b=map(mouseY, 0, height, 0, 40);

//draw outer epitrochoid
	beginShape();
	for(var i=0; i<numberPoints; i++) {
		theta=map(i, 0, width/2, 0, 360);
		x = (a + b) * cos(theta) - h * cos(((a + b)/b) * theta);
       y = (a + b) * sin(theta) - h * sin(((a + b)/b) * theta);

 vertex(x, y);
	}
endShape();
}
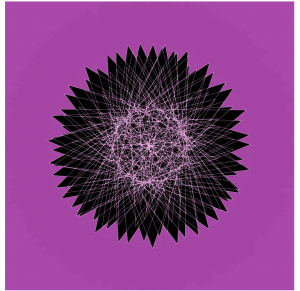
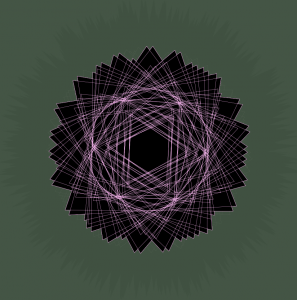
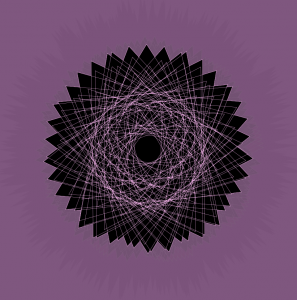
I started this project by looking through the different mathematical curves on the Mathworld curves site. I stumbled upon a specific curve named Epitrochoid that I really liked. It reminded me of a shape of a flower, which is why my project is themed around pink, to give it a pink flower look.
I wanted the background to also change as according to the mouse movement, which is why I also made maps for the different R, G, B variables. It was a bit hard to understand how I wanted the mouse to interact with the different variables of the functions, but once I made maps to form relationships with the mouse and variables a and b, I was set.


(Shown above are examples of different Epitrochoid patterns and sizes according to the movement of mouse)
![[OLD FALL 2017] 15-104 • Introduction to Computing for Creative Practice](../../../../wp-content/uploads/2020/08/stop-banner.png)