![[OLD FALL 2017] 15-104 • Introduction to Computing for Creative Practice](../../../../wp-content/uploads/2020/08/stop-banner.png)
I decided to focus on my friend Sharon’s LookingOutward-03, which focused on the work of David Wicks, who works with data visualization. He quotes, “Making Information Beautiful.” The work she decided to focus on was a map of the US with representation of rainfall and water flow.
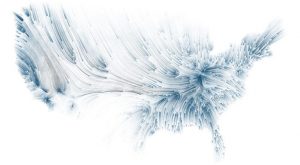
I thought it was interesting that this beautiful visual representation could translate into data information. Although it does not present any numbers, it still provides a general idea of how the water flows. I also thought it was unique that the artist was able to figure out an algorithm that would draw and create such as piece.