dchikows – Section C -Looking-Outwards – 07

Chris Harrison is an Assistant Professor of Human-Computer Interaction at Carnegie Mellon University. Harrison also directs the Future Interfaces Group which is a lab that creates novel computer interfaces and technologies that further a delightful human computer interaction. Harrison’s project called Digg Rings uses data from top news story outlets to create ring like images. The rings of each disk are composed of the ten top news stories that day relating to categories of the news. The disks are tree like in nature. As time goes on they get larger and larger and the rings grow based on the amount of views each story has. I enjoy this data visualization for news stories because of its similarity to how a tree grows in rings. Although, I think it would be interesting to see the project in different colors.

See more of Chris Harrison’s work

Key for data visualization
Up close of data visualization rings
Example of whole rings designated by days of the week

dchikows-Section C-Project-06-Abstract-Clock

sketch

//David Chikowski
//Section C
//dchikows@andrew.cmu.edu
//Project - 06 

function setup() {
    createCanvas(480, 480); 
}

function draw() {
    background(210, 200, 230); // My favorite pink
    
    //calls the current hour, minute, and second
    var H = hour();
    var M = minute();
    var S = second();

    //left circle representing hours 
    fill(255);
    ellipse(85,height/2, (H*4)+50, (H*4)+50);
    
    //middle circle representing minutes 
    fill(3*M,5*M,6*M);
    ellipse(width/2,height/2, (M*4)+50, (M*4)+50);

    //far right circle representing seconds 
    fill(7*S,3*S,5*S);
    ellipse(380,height/2, (S*1)+50, (S*1)+50);

}


I started the project thinking I would utilize the use of lines to base my time off of. I then decided I would switch to circles because I could change the size and how they took up the screen. I really struggled with the create aspect of the project.

dchikows – Section C – Looking Outward – 06

Automatic Drawing

André Masson was a French artist who lived from January 4, 1896 to October 28, 1987. He started with cubism then moved to surrealism. It was this stage of his career that he employed automatic drawing. A practice in which he let his pen randomly move across his paper without having a conceived notion of an image he wanted to create. Once he felt he was done Masson would occasionally make revisions or additions to his work. We can not say that his work is completely random because his pen is not evenly distributed along the canvas which would make it random, but it is very distributed at least to the eye. The randomness is all based on how he subconsciously moved his hand to draw. I enjoy Masson’s work because it allows for the viewer to prescribe his or her own image within the abstract, which Masson lays the foundation of.

Automatic Drawing

Masson’s Work

dchikows – Section C – Project-05-Wallpaper

sketch

// David Chikowski
// Section C
// dchikows@andrew.cmu.edu
// Project - 05


function setup() {
    createCanvas(480, 480);
    background(240, 190, 0);
    angleMode(DEGREES);
    
    //top left
    draw_clover();
   
    //top middle
    translate(100, 10);
    draw_clover();

    //top right
    translate(100, 40);
    draw_clover();

    //bottom left
    translate(-400, 0);
    draw_clover();

    //bottom middle
    translate(100, 10);
    draw_clover();
  
    //bottom right
    translate(100, 40);
    draw_clover();

}

function draw_clover() {
    noStroke();
    fill(140,210,0);
    
    translate(0,20);

//left leaves 
    ellipse(50,50,40,25);
    push();
    translate(50,50);
    rotate(-30);
    ellipse(-2,6,40,25);
    pop();

// right leaves 
    translate(40,50); 
    push();
    translate(50,0);
    rotate(30);
    ellipse(2,6,40,25);
    pop();
    ellipse(50,0,40,25);

//top leaves
    translate(27,-22);
    push();
    translate(0,0);
    rotate(30);
    ellipse(10,-5,25,40);
    pop();
    ellipse(0,0,25,40);

//stem
    stroke(0,200,0);
    strokeWeight(4);
    noFill();
    curve(45,40, 20,60, 5, 20, 50,30);

}

I originally started the project with the intent to do lines that related to each other on a grid through variables. Although I realized I wanted to make something more organic so I changed my idea. I then constructed a three leaf clover which I repeated in a pattern on my code. I was going to use a four loop, but I did not account for this early enough in my code so I ended up translate the clover. I learned that for next to

dchikows – Section C – Looking Outward – 05

Pedro Conti’s Work on Moana

Barges
Side view of Barges
Object Layers

Pedro Conti is a freelance character designer from São Paulo. His most recent work is for Walt Disney Animation Studios on the movie Moana. Conti mainly worked on creating the two barges in the movie and the trash on them. It was a total of 140 shots which he had to code to create. The attention to detail is immediately transparent. Hundreds of tiny objects had to be coded. Not only did all of the tiny objects have to be coded, but they had to be textured as well. One of the biggest challenges was that of making the barges look realistic. Conti started with the bigger graphic elements and worked his way down in layers to smaller objects to reach a final image without any intersecting lines.


dchikows – Section C – Project – 04 – String-Art

sketch

// David Chikowski
// Section C
// dchikows@andrew.cmu.edu
// Project-04 


function setup() {
    createCanvas(400,300);
    background(0,0,255);


    //top left line
    x1 = 0;
    y1 = height;
    x2 = 0;
    y2 = 0;
   
   //bottom right line 
    x3 = width
    y3 = height
    x4 = 0
    y4 = height

    //middle left line
    x5 = height
    y5 = width
    x6 = 0
    y6 = 0

    //middle right line
    x7 = height
    y7 = width
    x8 = 0
    y8 = 0

    //for loop for all lines 
    for (loop = 0 ; loop < 20 ; loop += 1) {

        //top left line
        stroke(255,0,0);
        line(x1, y1, x2, y2); 
        y1 -= height/10; 
        x2 += width/10; 

        //bottom right line 
        line(x3, y3, x4, y4);
        y3 -= height/10;
        x4 += width/10;

        //middle left line
        line(x5 -200, y5, x6, y6); //translates curve 200 points 
        y5 -= height/10;
        x6 += width/10;

        //middle right line
        line(x7 - 100, y7 + 150, x8, y8); //translates points 100 left, 150 down
        y7 -= height/10;
        x8 += width/10;


}


    }

I found this to be an interesting project to use for loops on. I believe it will be very useful in the future to use for loops for coding material similar to this since it can save a to of time.

dchikows – Section C – Looking Outward – 04

Ryoji Ikeda is an extremely popular music composer in Japan. He focuses on the “essential characteristics of sound itself and that of visuals as light by means of both mathematical precision and mathematical aesthetics.” One of Ikeda’s works is an installation called The Transfinite. Accompanying the aggressive and static like electronic music are barcode like patterns that move throughout the 54 feet wide by 40 feet tall screen. I believe Ikeda created the music and visuals by the use of loops. He must have had to create different sounds then made them into functions and called them in loops. I am drawn to his work because it is so all encompassing. Just by seeing a video you can tell the world he creates people are a mere spec.

The Transfinite

Ryoji Ikeda’s website

The Transfinite

dchikows – Section C – Category Project – 02 – Variable-Face

sketch

// David Chikowski
// Section C
// dchikows@andrew.cmu.edu
// Project-02


var eyeSize = 12;
var backFinTopX = 541;
var backFinTopY = 162;
var backFinBottomX = 540;
var backFinBottomY = 322;
var mouthOpenTopY = 234;
var mouthOpenBottomY = 245;


function setup() {
    createCanvas(640, 480);
}

function draw() {
    background(130,163,196);

    noStroke();
    fill(191,94,71);
    ellipse(279,238,359,131);
    //Main body

    noStroke();
    fill(191,94,71);
    quad(80,231,139,202,136,277,81,248);
    //mouth

    noStroke();
    fill(130,163,196);
    triangle(79,mouthOpenTopY,80,mouthOpenBottomY,103,242);
    //mouth opening

    noStroke();
    fill(56,54,8);
    ellipse(137,232,eyeSize,eyeSize);

    noStroke();
    fill(191,94,71);
    triangle(240,145,205,182,336,188);
    //top fin

    noStroke();
    fill(191,94,71);
    triangle(backFinTopX, backFinTopY, 403, 242, backFinBottomX, backFinBottomY);
    //Back fin


}


function mousePressed() {
    // when the user clicks, these variables are reassigned
    // to random values within specified ranges. For example,
    // 'eyeSize' gets a random value between 12 and 22.

    eyeSize = random(12,22);
    backFinTopX = random(525, 541);
    backFinTopY = random(145, 162);
    backFinBottomX = random(515, 540);
    backFinBottomY = random(295, 322);
    mouthOpenTopY = random(234,246);
    mouthOpenBottomY = random(235,245);


}


I initially approached the project by trying to make an interactive robot, but my process took a turn when I realized I am not very good at coding yet. So I decided to make a fish instead, but it is okay I really enjoy fishing.

dchikows – Section C – Project-03-Dynamic-Drawing

Sketch

// David Chikowski
// Section C
// dchikows@andrew.cmu.edu
// Project-03-Dynamic-Drawing


var angle = 0;

function setup() {
  createCanvas(640,480);
  strokeWeight(30); //line thicknesses
}

function draw() {
   background(155, 244, 66); // bright lime Green
    if (mouseY < (240)) // if Y cordinate of mouse goes bellow 240 background changed to lime green 
        background(175, 60, 201); // Purple


  var m = max(min(mouseY, 480), 0); //sets limits for lines

  stroke(255);
  line(m - 50, m - 80, 0, 480); 
  //white line

  stroke(24,96,200);
  line(m + 380,m + 120,640,480);
  //blue line

  stroke(255,40,30);
  line(m + 278,m + 400,640,0);
  //red line

  stroke(50,100,50);
  line(m + 140,m + 200,640,480);
  //Green line
  
  //Creates a circle that rotates around the 
  //top point of the white line 
  fill(219, 154, 35); //elipse color
  noStroke();
  push();
  translate(m - 50, m - 80); //set to follow the top point of the white line
  rotate(radians(angle));
  ellipse(10, 10, 10, 10);
  pop();
  angle = angle + 10;

  noStroke();
  fill(155, 244, 66); // bright lime Green
    if (mouseY > (240)) // if Y cordinate of mouse goes bellow 240 ellipse changes to lime green
        fill(175, 60, 201); // if Y cordinate of mouse goes above 240 ellipse changes to Purple
  ellipse(56, 46, mouseY - 200, mouseY - 155); 


}


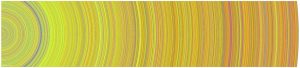
I started to develop my dynamic drawing with the four lines and then worked out from there making adjustments as I went through the process. I decided to strictly use mouseY to control the image so the user could do it faster.


var angle = 0;

function setup() {
createCanvas(640,480);
strokeWeight(30); //line thicknesses
}

function draw() {
background(155, 244, 66); // bright lime Green
if (mouseY < (240)) // if Y cordinate of mouse goes bellow 240 background changed to lime green
background(175, 60, 201); // Purple


var m = max(min(mouseY, 480), 0); //sets limits for lines

stroke(255);
line(m – 50, m – 80, 0, 480);
//white line

stroke(24,96,200);
line(m + 380,m + 120,640,480);
//blue line

stroke(255,40,30);
line(m + 278,m + 400,640,0);
//red line

stroke(50,100,50);
line(m + 140,m + 200,640,480);
//Green line

//Creates a circle that rotates around the
//top point of the white line
fill(219, 154, 35); //elipse color
noStroke();
push();
translate(m – 50, m – 80); //set to follow the top point of the white line
rotate(radians(angle));
ellipse(10, 10, 10, 10);
pop();
angle = angle + 10;

noStroke();
fill(155, 244, 66); // bright lime Green
if (mouseY > (240)) // if Y cordinate of mouse goes bellow 240 ellipse changes to lime green
fill(175, 60, 201); // if Y cordinate of mouse goes above 240 ellipse changes to Purple
ellipse(56, 46, mouseY – 200, mouseY – 155);


}

dchikows – Section C – Looking Outward – 03

MIT runs the Mediated Matter Lab. The group focusses on “Nature-inspired design and design-inspired Nature” to produce research that intersects with design, biology, material science, and digital fabrication. Glass II is a project conducted by the group to focus on digital fabrication and design. G3PD2, is a very exact additive manufacturing technology to create 3D prints of transparent glass structures. The new manufacturing method is the best for this application because it has a four axis pivot, integrated thermal sensors, and is able to produce prints faster. Glass II made to demonstrate the machine’s power is also beautiful. It creates an amazing patterns of light on the ground that all lead back to the structure. Since the structure is so transparent and sizeable the transition from the light and the structure feels as if it is flawless. Glass II was showcased at the Milan Triennale in 2017. I find this project very exciting as I am currently learning Solid Works.

See Glass II


Instalation of Glass II