jknip-Project-07-curves

sketch

/*Jessica Nip
Section A
jknip@andrew.cmu.edu
Project-07
*/

 //-------------------------
function setup() {
    createCanvas(480,480);
}
 
 //-------------------------
function draw() {
    background(80);

//draw hypotrochoid curve
//define parametric variables, map and constrain mouseX and Y 
    var h = map(mouseY, 0, height/4, height/2, height/4);
    var a = constrain(mouseX, 0, width/4);
    var b = 5;

//set visual variables
    stroke(255,165,175);
    fill(255,165,175);

//set up for loop to consider all 360 degrees
    for (var t = 0; t < 360; t++) {
        //convert parametric equation of curve
        var x = width/2 +((a-b)*cos(radians(t)))+h*cos(((a-b)/b)*(radians(t)));
        var y = height/2 + ((a-b)*sin(radians(t)))-h*sin(((a-b)/b)*(radians(t)));
        //create tiny ellipses that repeat parametrically and create interactive collage
        ellipse(x, y, 1, 1);
    }  
}
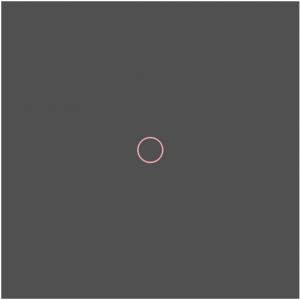
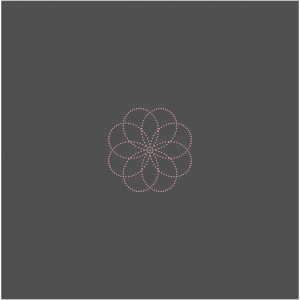


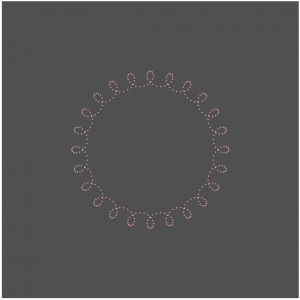
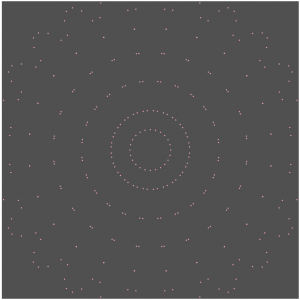
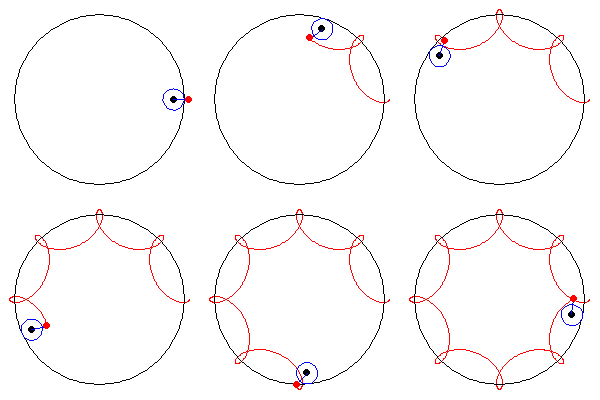
Inspired by the hypotrochoid, I enjoyed looking at its ‘drawing’ mechanism that considers a smaller circle rolling around the inside of a bigger circle and the form of curves it draws. I wanted to recreate it through fireworks-inspired specks, that form both typical geometric forms (e.g. circle) and its exploded perspectives — I also wanted this relationship to be mapped with the movement of mouseX and mouseY, which I have mapped and constrained to smaller sections of the canvas. The aesthetics of the project was also inspired by this minimalist ‘flicker’ of the supposedly ‘specks’  of the form, so I used two colors that drew a distinct contrast.

jknip-SectionA-LookingOutwards-07

“Digg Rings” by Chris Harrison (2007-2008)

Between 2007 and 2008, Harrison grabbed the top 10 most dugg stories every day and rendered tree-ring-like visualizations based on the data. I really admire how each tree-ring created such different visual illusions and how certain colors/data categories are more prominent across each day of the week — Harrison describes that these variations occur as rings are cumulative. Randomness is unlikely to be found within this project, as the artist visualizes these rings based on real data. There may be some flaws in the algorithm as he notices that some days have fewer than 10 top stories, which is unusual. Harrison’s artistic sensibilities can be found in his choice of color palette, along with scale and presentation of the final rings. Each coded ring creates such different visual perspective depending on the scale it is shown.

http://www.chrisharrison.net/index.php/Visualizations/DiggRings

jknip-Project-06-abstract-clock

sketch

/*Jessica Nip
Section A
jknip@andrew.cmu.edu
Project-06
*/

var sealevel = 250;
var boatlevel = 230;
var rodX = 230;
var rodY = boatlevel+35;
var manX = 170;
var manY = 200;

 //-------------------------
function setup() {
    createCanvas(360, 360);
}
 
 //-------------------------
function draw() {
    background(209,236,245);
    noStroke();

//fetch the current time
    var H = hour();
    var M = minute();
    var S = second();
    var mappedS = map(S, 0, 59, 0, rodX);

//create text elements for hours and minute on top
    fill(0);
    textStyle(BOLD);
    text("x " + H, 60,40);
    text("x " + M, 310,40);

//create fish icon
    fill(253,189,3);
    noStroke();
    arc(290, 35, 22, 15, 0, TWO_PI-QUARTER_PI, PIE);
    triangle(275, 45, 270, 35, 290, 35);

//create fish bucket icon
    fill(120);
    rect(20, 20, 30, 30, 5);
    noFill();
    stroke(120);
    arc(35, 25, 30, 20, PI, TWO_PI);

//create sea
    fill(26,91,147);
    rect(0, sealevel, width, height);

//create fishing rod
    noFill();
    stroke(120);
    arc(rodX, rodY, 80, 210, PI+QUARTER_PI, TWO_PI);

//create fisherman
    fill(29,70,149);
    noStroke();
    ellipse(manX, manY, 15, 15);
    arc(manX+10, manY+18, 40, 40, 0, PI+QUARTER_PI, PIE); //add additional spacing between head and body

//create fish bucket
    fill(120);
    rect(manX-80, manY+15, 30, 30, 5);
    noFill();
    stroke(120);
    arc(manX-65, manY+20, 30, 20, PI, TWO_PI);

//create boat
    noStroke();
    fill(235,121,85);
    arc(width/2.5, boatlevel, width/2, height/5, 0, PI);

//create fish
    fill(253,189,3);
    noStroke();
    //map fish movement to seconds of clock
    arc(mappedS+35, rodY, 22, 15, 0, TWO_PI-QUARTER_PI, PIE);
    triangle(mappedS+15, rodY, mappedS+35, rodY, mappedS+20, rodY+10); 

}

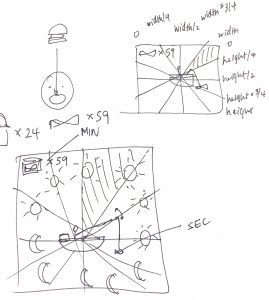
When thinking about how to best represent the passing of time, I considered different active and passive activities from eating, exercising, etc. I decided to represent the passage of time in fishing — letting the fish bucket represent hours, the number of fishes caught as minutes, and the movement of fish as seconds.

jknip-SectionA-LookingOutwards-06

“Game of Life” by Charlotte Dann (2016)

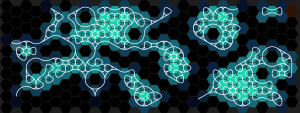
Charlotte Dann is an artist interested in using p5.js to create a more exciting visualization activity of hexagonal Game of Life. She found that establishing the data structure for hexagons and defining how they relate to one another was really difficult in the beginning. With the use of random variables in her code, she strived to create a clustering effect across the hexagons. I like how she showcased her whole range of exploration in her project, where she played with coded, linear agents to random agents, describing how they aligned or misaligned with her design intentions. In terms of the randomness in Game of Life, she coded for the ‘ants’ to leave a trail behind it, moving shapes either left, right, or go straight ahead. She also established relationships between this randomness and their aim for emptier areas on the canvas through this algorithm. In the final form, Dann discovered over 1416 possible combinations for every hexagon, and she played with how she could represent her aesthetic sensibilities through every iteration.

https://codepen.io/pouretrebelle/post/hexagons

jknip-Project-05-wallpaper

sketch

/*Jessica Nip
Section A
jknip@andrew.cmu.edu
Project-05
*/

function setup() {
    createCanvas(400, 400);
    background(255,254,208);
    var tw = 80; //horizontal spacing between circles
    var th = 40; //vertical spacing between circles
    var oy = 0; //y position of circles
    var ox = 0; //x position of circles
    var circlesize = 20;

//for odd rows
    for (var y = 0; y < 6; y++) { //create 6 rows
        for (var x = 0; x < 6; x++) { //create 6 circles in each row
            var py = oy + y * th * 2; //y position = position + row  * vertical spacing distance
            var px = ox + x * tw; //adjust x spacing to accomodate 2*space + one circle
           
    //shadow behind avocado
            fill(138,86,47);
            noStroke();
            ellipse(px+2, py, circlesize, circlesize*1.2);
            ellipse(px+2, py+11, circlesize*1.3, circlesize*1.8);

    //avocado       
            fill(186,217,64);
            noStroke();
            ellipse(px, py, circlesize, circlesize*1.2); // top half of avocado
            ellipse(px, py+11, circlesize*1.3, circlesize*1.8); //bottom half of avocado
            
    //pit
            fill(138,86,47);
            ellipse(px-1, py+13, circlesize/2, circlesize/1.7);
        }
    }


//for even rows
    for (var y = 0; y < 5; y++) { //create 5 rows
        for (var x = 0; x < 6; x++) { //create 6 circles in each row
            var py = oy + y * th * 2 + circlesize*2;
            var px = ox + x * tw + circlesize*2; //adjust x spacing to accomodate 2*space + one circle
    
    //shadow behind avocado
            fill(138,86,47);
            noStroke();
            ellipse(px+2, py, circlesize, circlesize*1.2);
            ellipse(px+2, py+11, circlesize*1.3, circlesize*1.8);
        
    //avocado  
            fill(186,217,64);
            noStroke();
            ellipse(px, py, circlesize, circlesize*1.2); // top half of avocado
            ellipse(px, py+11, circlesize*1.3, circlesize*1.8); // bottom half of avocado
           
    //pit
            fill(138,86,47);
            ellipse(px-1, py+13, circlesize/2, circlesize/1.7); //avocado pit
        }
    }
    noLoop();
}


function draw() {
    // draw is not called due to noLoop() in setup()
}

Inspired by a friend’s graphic design work, I wanted to create a simple avocado wallpaper that mimics the fun in her work. I was also inspired by the hexagonal pattern from the previous assignment.


jknip-SectionA-LookingOutwards-05

Michael Theodore’s Scratchboard Engravings (2014)

Theodore collaborated with the Boulder Engineering Studio to create a robotic arm that creates millions of tiny straight lines through computer code. The interesting part of this project is how the robotic arm can etch patterns in a three dimensional quality, which would have been significantly more different if done through the human hand. I really admire the patterns as they form very intricate patterns and in real life, reveals more about the white clay canvas. The algorithms forms original line formations and combinations, and it takes between 10 to 16 hours to produce each piece. Theodore was able to capture the artistic, natural and gestural quality of the human hand through this mechanical etching method.

http://michaeltheodore.info/

https://creators.vice.com/en_us/article/aeng5g/robotic-drawings-turn-computer-code-into-intricately-etched-patterns

jknip-Project-04-string-art

sketch

/*Jessica Nip
Section A
jknip@andrew.cmu.edu
Project-04
*/

function setup() {
    createCanvas(400, 300);
}

function draw() {
    background(240);

    //set mouseX and mouseY as controles of color change
    var mouseR = mouseX;
    var mouseG = mouseY;
    var mouseB = 150;

    //set up for loop and increments
    for (var i = 0; i < 30; i+=1) {

    //set line characteristics
        stroke(mouseR-50, mouseG-50, mouseB); //define stroke RGB in relation to mouseR, mouseG, mouseB
        strokeWeight(1); //define weight to 1
        noFill(); //set fill to colorless

    //draw lines from left to right
        line(0 , i*10, mouseX+i*10, height);
        line(width/3+10*i, i*10, mouseX+i*10, height);
        line(width/3+4*i , height, width, height-(mouseX+15*i));
        line(width/2+10*i, 0, width, mouseX+i*10);
    }
}

I wanted to generate different curves from different sides of the canvas, and have colors randomize by a factor through the movement of the mouse. The result was an abstract line piece.

jknip-SectionA-LookingOutwards-04

“Sonic Pendulum” by Yuri Suzuki Design Studio in collaboration with QOSMO (2017)

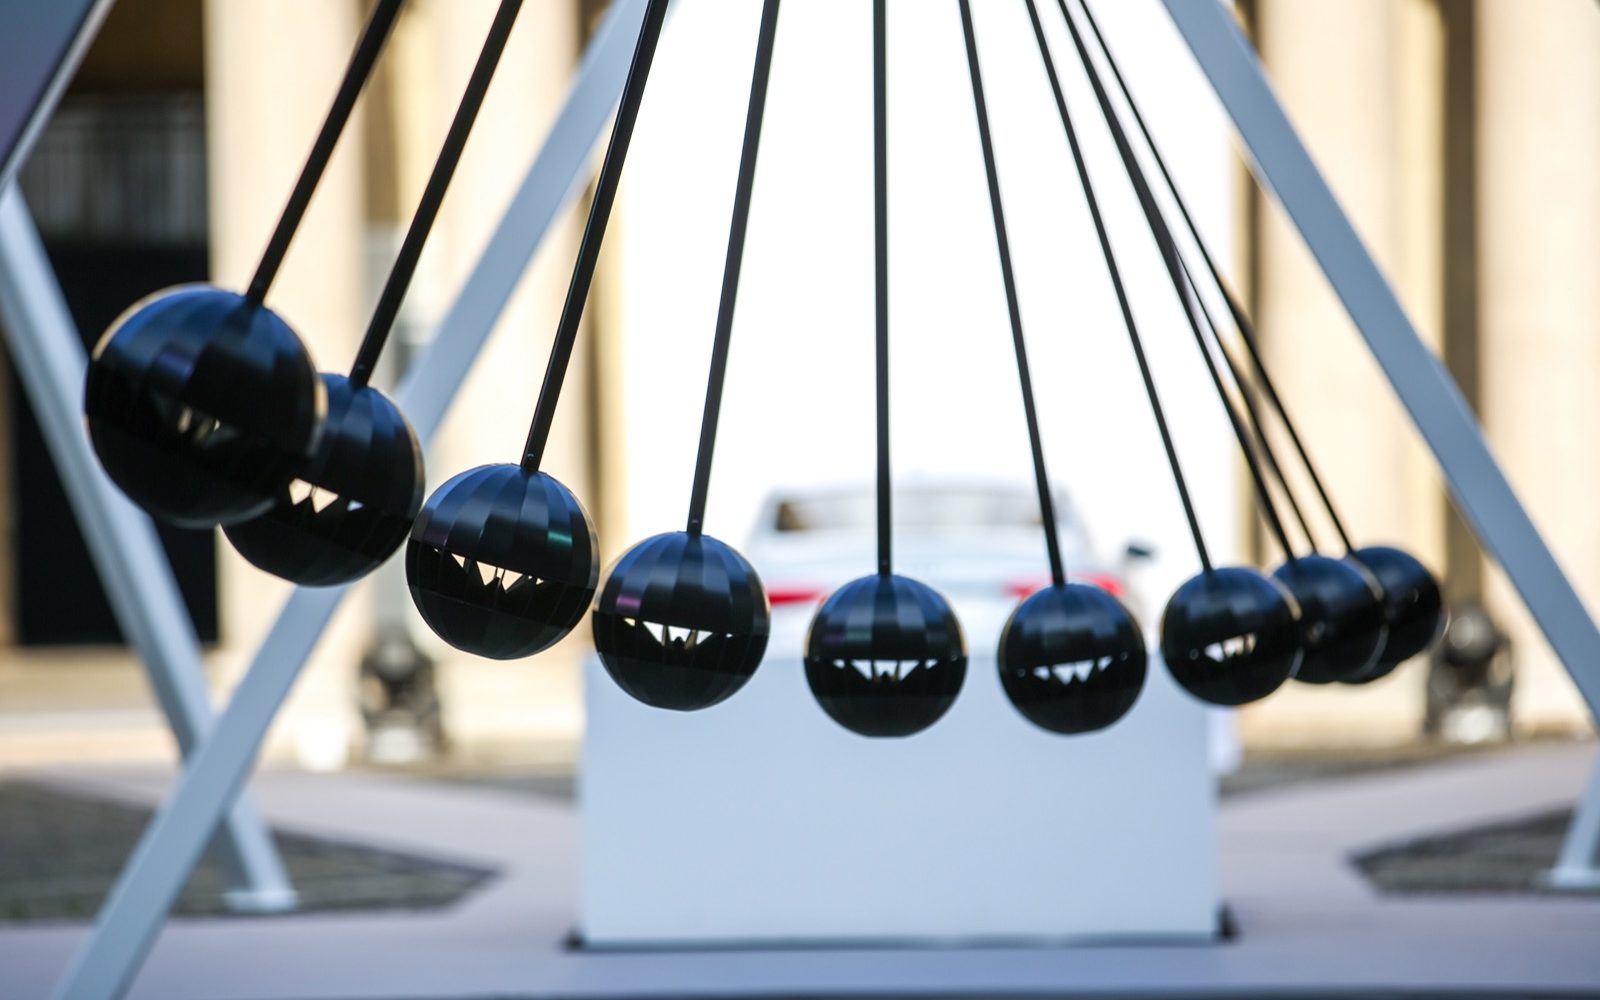
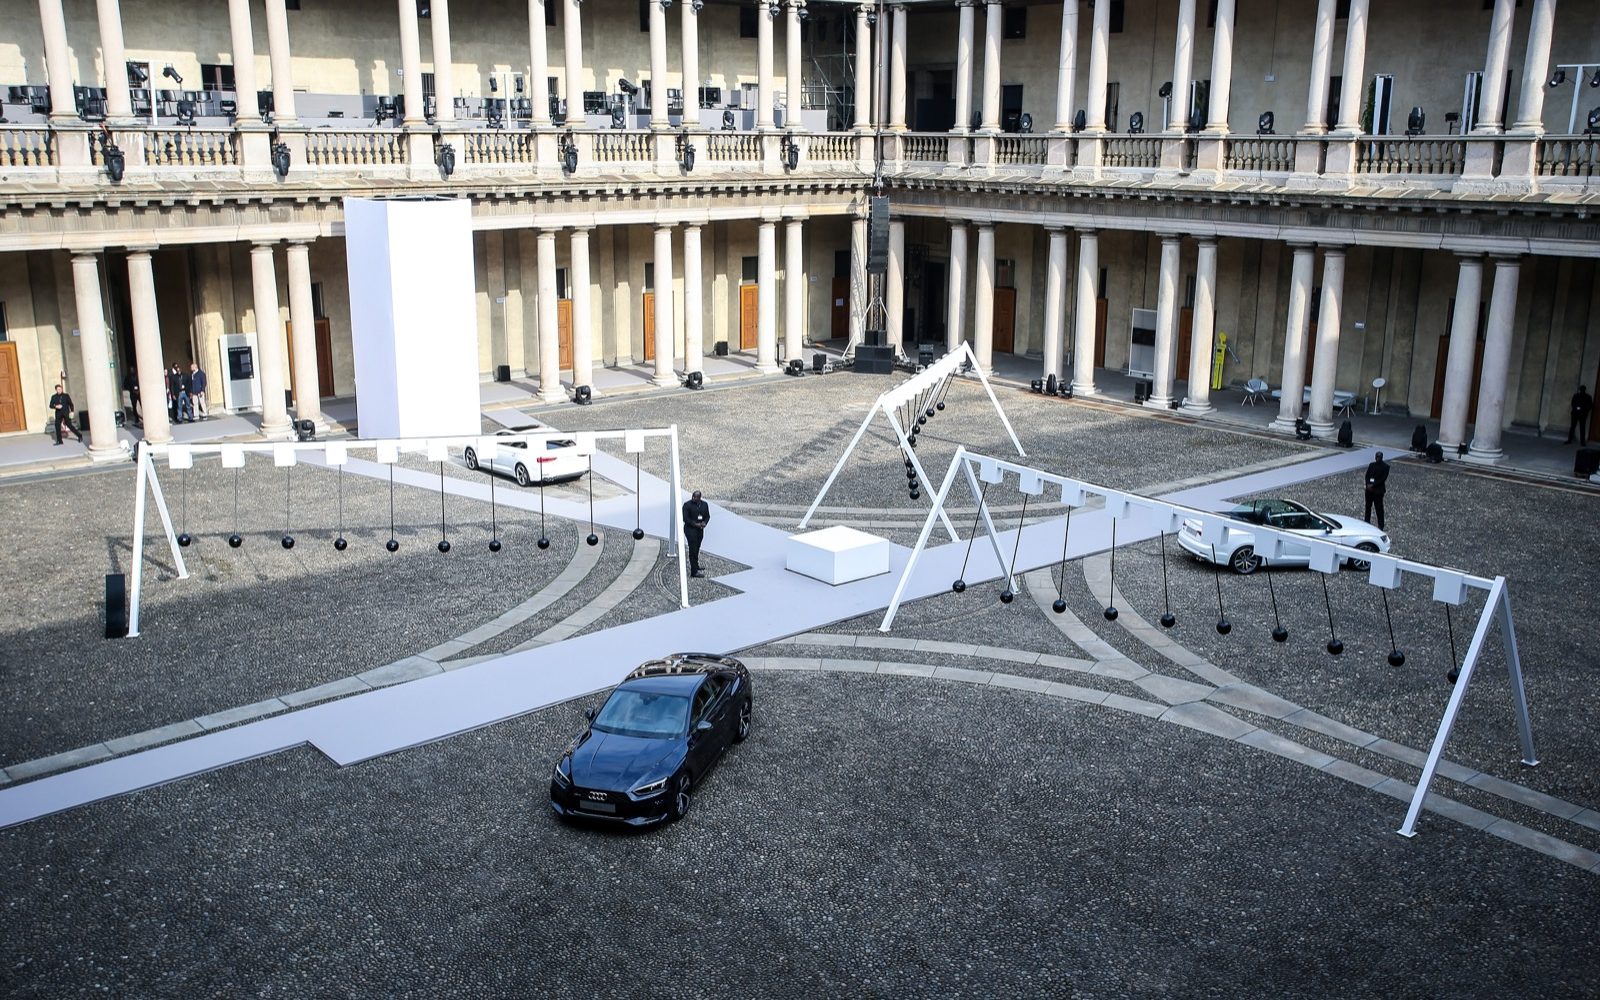
Sonic Pendulum is a sound installation that utilizes artificial intelligence to create an endless soundscape. Inspired by the client’s new Audi A5 line, the installation is made up of 30 pendulums, which simulates sound through speakers and crowd movement. Networked camera and computer vision systems set up around the installation provides an understanding of the crowd size and movement, which directly correlates with the music volume, soundtrack, etc. I really admire how the artist wanted to create a form of conversation through movement and sound, where the installation is almost ‘activated’ by the visitors’ movement, and in turn responds with the most original sound that never repeats itself.

The AI algorithms used to create Sonic Pendulum was trained by a team to create an infinite composition, which reacted to movement in live space, creating moment-to-moment experiences. An application called MAXMSP was used to further train the algorithm, delivering compositions that matched the sound intensity of the space.

In terms of artistic sensibilities, not only did the studio require a working algorithm, they also had to consider space, scale, composition and rendering of installation, and also how the Audi cars aligned with the arrangement. What resulted were multiple triangular forms that encouraged interaction with passerby.

http://www.creativeapplications.net/maxmsp/sonic-pendulum-ai-soundspace-of-tranquility/

https://vimeo.com/214206048

http://yurisuzuki.com/design-studio/sonic-pendulum

jknip-SectionA-LookingOutwards-03

MIT Media Lab Silk Pavilion

“Silk Pavilion” by Mediated Matter / MIT Media Lab (2013)

Silk Pavilion was an architectural experiment conducted with 6,500 live silkworms. Mediated Matter led by Neri Oxman, studied productivity in nature in conjunction with computerized efficiency in fabrication. I admire how the group found an intersection across the artificial and natural, and was able to effectively apply fabrication understanding across such a large scaled dome installation. What’s also really admirable is how Oxman decided to develop custom CAD tools for the project, specifying specific thread properties of the pavilion that couldn’t have been altered elsewhere.

Using an algorithm inspired by the silkworm’s natural ability to create cocoons out of thread, the system assigns single threads across patches with varying density levels. Silkworms were then physically deployed as a real-time “3D printer”. The final form was not fully controlled by the creators, as the texture and features of the dome were difficult to predict due to the emergent behavior of the worms. Through deep understanding of silkworms as a medium, the group learned how to utilize them as a sophisticated, multi-axis printing medium.

SILK PAVILION from Mediated Matter Group on Vimeo.

https://www.media.mit.edu/projects/silk-pavilion/overview/

https://vimeo.com/67177328

jknip-Project-03-dynamic-drawing

sketch.js

// Jessica Nip
// Section A
// jknip@andrew.cmu.edu
// Project-03

var R = 0;
var G = 0;
var B = 0;
var R2 = 0;
var G2 = 0;
var B2 = 0;
var R3 = 0;
var G3 = 0;
var B3 = 0;
var R4 = 0;
var G4 = 0;
var B4 = 0;

function setup() {
    createCanvas(640, 480);
    rectMode(CENTER);
}

function draw() {
    background(255,215,122);
    fill(R,G,B); // control rect color explicitly
    noStroke();
    var m = max(min(mouseX, 480), 0);
    var size = m * width / height/2;
    rect(m, mouseY, size, size);
    rect(m/2.2, mouseY, size/2, size/2);
    rect(m/7, mouseY, size/3, size/3);

	fill(R2,G2,B2);
    rect(m, mouseY/3, size, size);
    rect(m/7, mouseY/3, size/3, size/3);
    rect(m/2.2, mouseY/3, size/2, size/2);
   
   	fill(R3,G3,B3);
    rect(m, mouseY/1.6, size, size);
    rect(m/7, mouseY/1.6, size/3, size/3);
    rect(m/2.2, mouseY/1.6, size/2, size/2);

	fill(R4,G4,B4);
    rect(m, mouseY*1.5, size, size);
    rect(m/7, mouseY*1.5, size/3, size/3);
    rect(m/2.2, mouseY*1.5, size/2, size/2);

    stroke(255);
    strokeWeight(12);
    line(450, 0, mouseX, mouseY); // White line
    stroke(50);
    var mx = map(mouseX, 0, width, 180, 250);
    line(120, 0, mx, mouseY); // Black line

    if (mouseX > width/2) {
 		R = 146; //purple
 		G = 129;
 		B = 159;
 		R2 = 6; //blue
 		G2 = 67;
 		B2 = 90;
 		R3 = 45; //dark purple
 		G3 = 35;
 		B3 = 56;
 		R4 = 231; //peach
 		G4 = 165;
 		B4 = 150;

    } else if (mouseX > width/3) {
    	R = 196; //mauve/pink
    	G = 155;
    	B = 168;
    	R2 = 101; //lighter blue
 		G2 = 128;
 		B2 = 139;
 		R3 = 74; //purple
 		G3 = 48;
 		B3 = 76;
 		R4 = 231;// rich peach
 		G4 = 165;
 		B4 = 130;

    } else if (mouseX > 0 < width/3) {
    	R = 196; //light purple grey
    	G = 176;
    	B = 174;
    	R2 = 190; //lightest blue
 		G2 = 200;
 		B2 = 230;
  		R3 = 110; //pinkish purple
 		G3 = 66;
 		B3 = 87;
 		R4 = 231; //dark peach
 		G4 = 165;
 		B4 = 110;
    }

}


In this project, I wanted to play with ascending shapes in scale and gradients. I would love to incorporate more complex motion into this set in the future.