//scarlet tong
//sntong@andrew.cmu.edu
// Section A
// Project 07 - Composition with Curves


//intitalize a value before using it for the x and y equations
var a = 0;

function setup() {
    createCanvas(300, 300);
    angleMode(DEGREES);
}

function draw(){
  //changing the alpha channel allows the movements of the dots to "lag" behind
  //creating interesting "tails" for each dot
  background(250,170,23,100);
  push();
  translate(150, height/2); // so that we can see the curve on the cancaus
  beginShape();
  for(var i = 0; i < 200; i++){
    var theta = map(i,0,100,0,360);
    // a controls how much the curve "bends" and loops
    var a = map(mouseX, 0,480,-7,7);
    //Conchoid of de Sluze equation from Wolfram MathWorld
    var x = (1/cos(theta)+(a*cos(theta)))*cos(theta);
    var y = (1/cos(theta)+(a*cos(theta)))*sin(theta);
    // color of the dots changes according to mouse position
    var col = map(mouseY, 0,300,0,255);
    var jitter = map(mouseY, 0,300,0,7);
    noStroke();
    fill(col);
    //"polar array" the Conchoid from the center
    rotate(90);
    //the first dotted line
    ellipse(x*20+random(0,1),y*20+random(0,1),2,2);
    //the second dots are rotated on a different angle of offset
    rotate(45);
    //the second dotted line
    fill(255-col);
    ellipse(-x*10+random(0,1),-y*10+random(0,1),2,2);
    // another layer of dots with larger diameters are then introduced to highlight
    //specific paths the curve took.
    if(i%4==0){
      ellipse(x*20+random(0,1),y*20+random(0,1),3,3)
    }
  }
  endShape(CLOSE);
  pop();

}
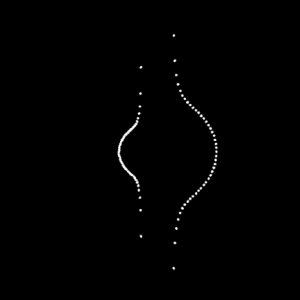
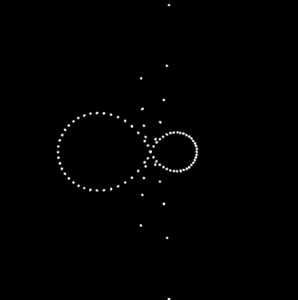
For this project I choose the to use the Conchoid of de Sluze equation found on Wolfram MathWorld as my base curve. I did more experimenting while I was coding and layer more alterations to the curve configuration each step. In this assignment I wanted to explore the use of density so that it implies a set of lines; however once the image is static it becomes harder to tell which dots make up a specific curve. I started off with a set of mirrored curves where one is scaled to a factor to another. Then I added motion of the curves by tracking mouseX and mouseY. From there color change is referred to mouse position and rotation is introduced to the curves.


![[OLD FALL 2017] 15-104 • Introduction to Computing for Creative Practice](wp-content/uploads/2020/08/stop-banner.png)