![[OLD FALL 2017] 15-104 • Introduction to Computing for Creative Practice](wp-content/uploads/2020/08/stop-banner.png)
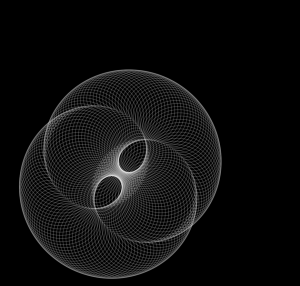
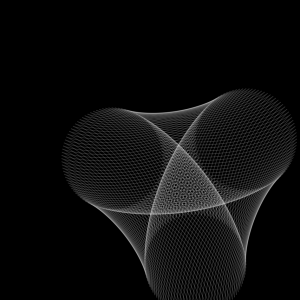
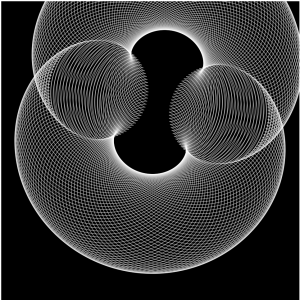
In this project, I chose the Astriod and Deltoid curve equations. I was originally trying to combine the two curves, yet I found it visually too clustered. So I made it alternating when mouse is pressed. Basically, the mouse movement will determine the the rotation speed, the size and form of the curves. I also modified the transparency so that the curves will be brighter when it is bigger in shapes and darker when is smaller, which I intended to create a sense of perspective in the space.
//Zining Ye
//15104 lecture 1 recitation C
//ziningy1@andrew.cmu.edu
//Project-07

var t=1;
var state; //set state for changes when mouse pressed

function setup() {
    createCanvas(480, 480)

    state = 1; //start with state 1

}

function draw() {
    background (0);
    var offset=0;

    translate(width/2, height/2-offset); //move curve to center
    angleMode(DEGREES);

    t+=1+(mouseX+mouseY)/40;  //change rotation speed according to mouse position
    rotate(t); //rotate around center
    pattern(); // call pattern function and draw the shape


}


function hypocycloid(){
    var a= 30;
    var points=500;


    var n = map(mouseX,0,width,70,150); //map the changing ranges


    noFill();
    stroke(255,255,255,(mouseX+mouseY)/8); // change opacity with mouse movement

    beginShape();

    for (var i=0; i<points; i++){

        //map angle changing range to 0-360 degree
        var t=map(i, 0, points, 0, 359);

        //curve equation
        var x=1/3*n*(2*cos(t)+cos(2*t));
        var y=1/3*n*(2*sin(t)-sin(2*t));


        vertex(x,y);
    }

    endShape(CLOSE);
}

function astroid(){

    var points=500;

    var a=map(mouseX,0,width,5,40); //map the size change range


    noFill();
    stroke(255,255,255,(mouseX+mouseY)/8); //change opacity with mouse movement


    beginShape();
    for (var i=0; i<points; i++){

        //map angle changing range to 0-360 degree
        var t=map(i, 0, points, 0, 359);

        //curve equation
        var x=3*a*cos(t)-a*cos(3*t);
        var y=3*a*sin(t)-a*sin(3*t)


        vertex(x,y);

    }
    endShape(CLOSE);
}


function pattern(){


    for(var i=0; i<100; i++){

        //set x,y position that it goes in draw the shapes in a circle
        var x=5*cos(3.6*i);
        var y=5*sin(3.6*i);

        translate(x,y) //change postiion to draw shapes


        //determine which curve to present
        if (state == 1){
            hypocycloid();
        } else {
          astroid();
        }
    }
}


function mousePressed(){

    //when mouse pressed, the state changes, so the curve chaneges.
    if (state == 1){
    state = 2;
    } else {
        state = 1;
    }
}