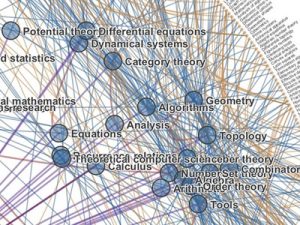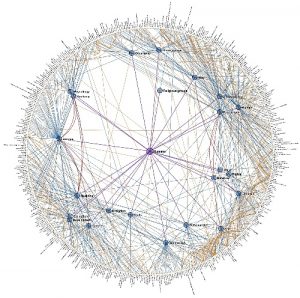
This is a project chosen by Zining Ye. I found this project to be really interesting as I am also interested in the field of data visualization and HCI. I appreciate how he has demonstrated a clear instruction of how the project actually works that I feel very easy to access the whole project. One little suggestion I have is to have the pictures of the actual work to be a little bit larger so the details are better shown. When I was looking at it, I was connected to thinking about web and how our thoughts are also connected and weaving like individual threads. If I was to access this project, I would try to find some specific example of how these levels of Wikipedia category pages and their interconnections connect. Furthermore, I looked into this work on other websites other than Chris’ own website, expecting to find more interesting information of the project. It is demonstrated in “Visual Complexity” that the clustering component of this visualization is vital. As Chris explains: “The mere presence of information isn’t all that interesting; there is no context or relevance to be gleaned. However, the structure of information is revealing about where fields intersect and diverge, and ultimately about how humans organize information”.


![[OLD FALL 2017] 15-104 • Introduction to Computing for Creative Practice](wp-content/uploads/2020/08/stop-banner.png)