Looking Outwards on Daniel Noh
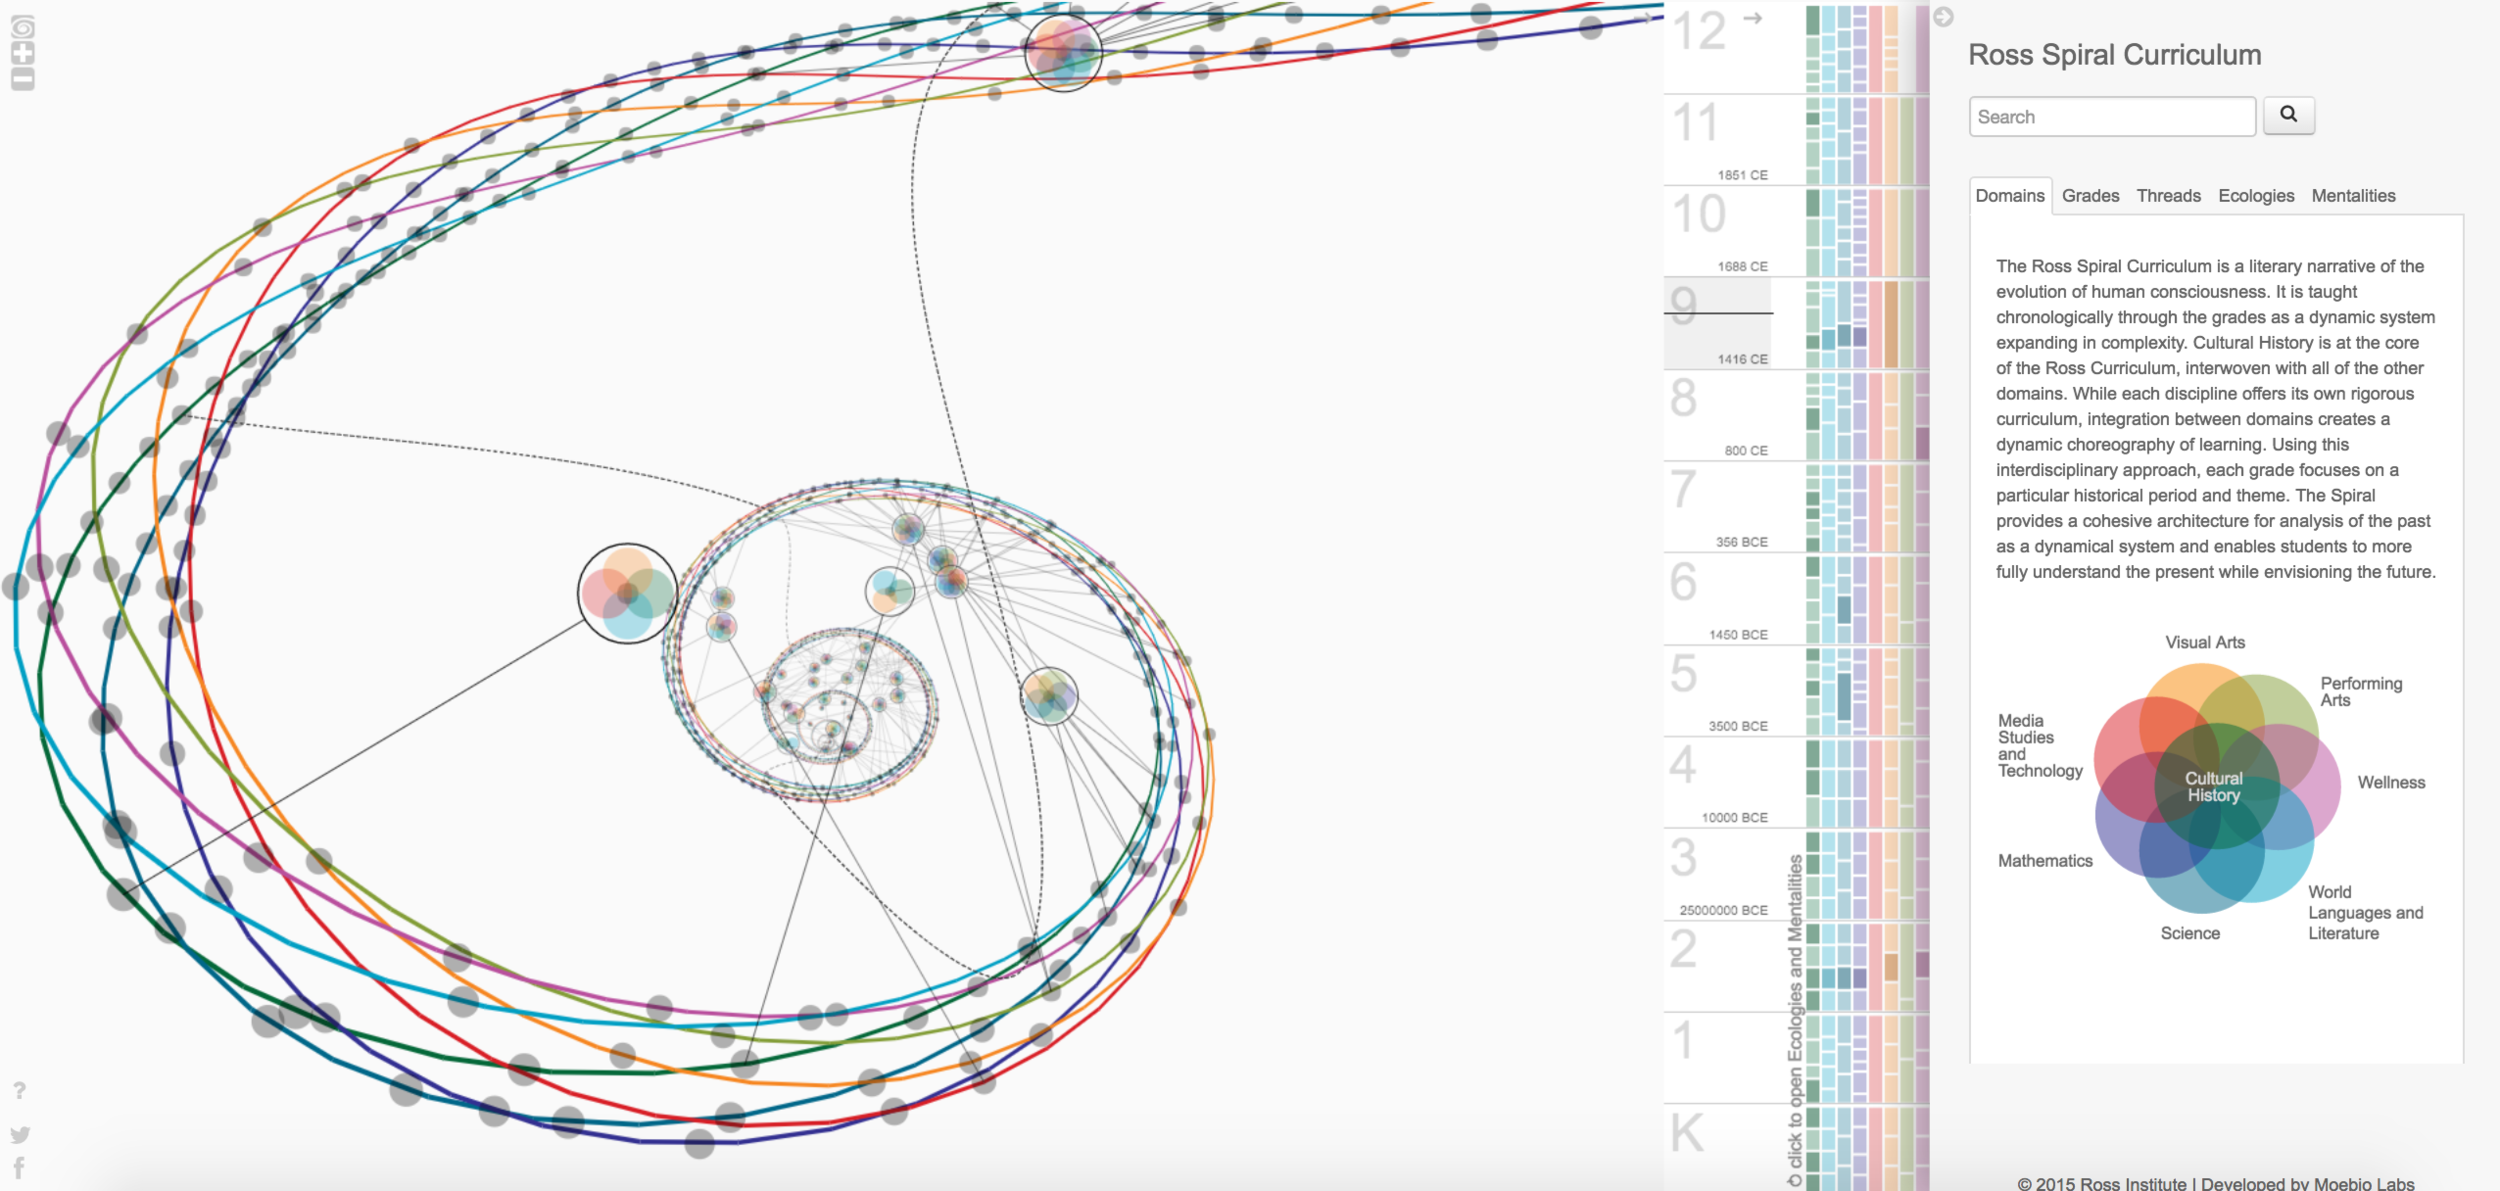
Daniel is a peer from my architecture studio, in this Looking Outwards post I am looking into one of his posts from week 7. Ross institute is a school that focuses on applied, advanced research, modelling, and dissemination, they strive to minimize the delay between research and application. The Ross Spiral represents the data of subjects in curriculum K through 12. in Daniel’s post he has stated that he thinks it is “far more impressive” as a 3D diagram and interactive map compared to a 2D drawing. I think this is an interesting way of representing data meant for spatial learners, however, it did take some time to figure out how to interact with the diagram and extract data from it. I think it would be useful to have a fuller data spreadsheet of how this graph is generated, and what each shape represented.
![[OLD FALL 2017] 15-104 • Introduction to Computing for Creative Practice](wp-content/uploads/2020/08/stop-banner.png)
