Jenna Kim (Jeeyoon Kim)- Project Proposal- Week 12

With my proposed collaborator, Rachel Lee from Section E, we decided to create an interactive game. There will be a spaceship trying to collect cheerios to go an adventure in the cereal world. The objective of the game is to collect the cereal floating around outer space to fuel the spaceship; the more cereals one collects, more points the person gets. In the beginning of the game, there will be a start button and an instruction explaining the point of the game (“Go save the cereal world by collecting the cereal rocks! Press ‘start’ to start the game”). Possibly, there will be “dangerous” cereals that float around, and if the spaceship touches them, it may cause the game to be over. There will be a one minute timer on the upper right corner of the page to time the game. In the background, there will be cereal boxes to show that the spaceship is in a cereal world setting.

Jenna Kim (Jeeyoon Kim)- Looking Outwards- Week 12

Uber Game
Puppet Parade

For our project (collaborating with my partner), we are planning to make an interactive digital story for young children.Therefore, I looked into educational related digital projects. One project that I looked over is “Puppet Parade, made by design I/O. It is an interactive installation allowing children to use their body to move large puppets that are projected on the wall. Another project is “The Uber Game- Financial Times”, which is an online game made by the Financial Times. It is a form of journal that is also a game built from interviews. I admired “Puppet Parade” because i love the idea of children’s’ telling their own story depending on what kind of movement they do. “The Uber Game- Financial Times” is also admirable because it was made in a fun way to tell a story (interviews/ journal) through interaction game. They are created in two different ways, but they are very similar because they only tell a “story” through interaction; they’re not just in a form of writing or reading. I would love to do a project similar to these to make reading or delivering a message in more communicative way.

Jenna Kim (Jeeyoon Kim)- Looking Outwards Week 10- Sound Art

final product of wassiliscope

How light frequency is translated to sound


Christopher Yamane’s “wassiliscope” is a project in which Yamane developed a telescope that translates light frequencies from the eyes to audible frequencies. I admire this because it is a fresh, original idea of something transparent to a form that you can feel and hear at the same time. I personally like how there is less of subjectivity and abstraction to this sound art because it also involves some concepts from physics. I also admire the form of the wassiliscope because of its simplicity, but translation process from sound to music is not so simple. The wassiliscope analyzes the average frequency of the light waves to the center of the telescope with a camera inside Then, the light waves are sent to the triangle wave oscillator and transfer to the head phones that are attached to the telescope. There is artist’s sensibility to the form of the wassiliscope because he made the wassiliscope look as though the telescope and the headphones are one object. There is no unnaturalness to the form although the headphones are attached to the back of the telescope. Also, the simple white color of “wassiliscope” gives a nice delicate, simple feeling.

URLs:
https://superduperstudio.co/wassiliscope/

christopher yamane turns light into sound with wassiliscope

Jenna Kim (Jeeyoon Kim) – Project 11 – Composition

jeeyoonk-11

var turtle
var a = 5;

function setup(){
    createCanvas(400,400);
    background(94,69,255);
    frameRate(10);
    turtle = makeTurtle(random(0,width), random(0,height));
    //create geometric shape
}

function draw(){
    //circular geometric shape 
    for (var i = 0; i < 50; i++){
        turtle.setColor(color(243, 231, 177));
        turtle.penDown();
        turtle.setWeight(.2);
        turtle.right(20); //turns 100 degrees every times it loops
        turtle.forward(a);

}
    turtle.left(20);
    a += 0.1; //the length increases
    turtle.penUp();

    if (mouseIsPressed){ //BIRD creating a NEST
    fill(240, 77, 37) //BODY
    ellipse(mouseX + 30, mouseY + 10, 50, 30);
    fill(254, 225, 115); //beak
    triangle(mouseX, mouseY, mouseX-5, mouseY-5, mouseX-20, mouseY+20);
    fill(240, 77, 37) //HEAD
    ellipse(mouseX, mouseY, 20, 20);
    fill(146, 211, 203) //eye
    ellipse(mouseX - 1, mouseY, 5, 5);
    }

}


function mousePressed(){
    turtle = makeTurtle(mouseX, mouseY);
}


function turtleLeft(d){this.angle-=d;}function turtleRight(d){this.angle+=d;}
function turtleForward(p){var rad=radians(this.angle);var newx=this.x+cos(rad)*p;
var newy=this.y+sin(rad)*p;this.goto(newx,newy);}function turtleBack(p){
this.forward(-p);}function turtlePenDown(){this.penIsDown=true;}
function turtlePenUp(){this.penIsDown = false;}function turtleGoTo(x,y){
if(this.penIsDown){stroke(this.color);strokeWeight(this.weight);
line(this.x,this.y,x,y);}this.x = x;this.y = y;}function turtleDistTo(x,y){
return sqrt(sq(this.x-x)+sq(this.y-y));}function turtleAngleTo(x,y){
var absAngle=degrees(atan2(y-this.y,x-this.x));
var angle=((absAngle-this.angle)+360)%360.0;return angle;}
function turtleTurnToward(x,y,d){var angle = this.angleTo(x,y);if(angle< 180){
this.angle+=d;}else{this.angle-=d;}}function turtleSetColor(c){this.color=c;}
function turtleSetWeight(w){this.weight=w;}function turtleFace(angle){
this.angle = angle;}function makeTurtle(tx,ty){var turtle={x:tx,y:ty,
angle:0.0,penIsDown:true,color:color(128),weight:1,left:turtleLeft,
right:turtleRight,forward:turtleForward, back:turtleBack,penDown:turtlePenDown,
penUp:turtlePenUp,goto:turtleGoTo, angleto:turtleAngleTo,
turnToward:turtleTurnToward,distanceTo:turtleDistTo, angleTo:turtleAngleTo,
setColor:turtleSetColor, setWeight:turtleSetWeight,face:turtleFace};
return turtle;}

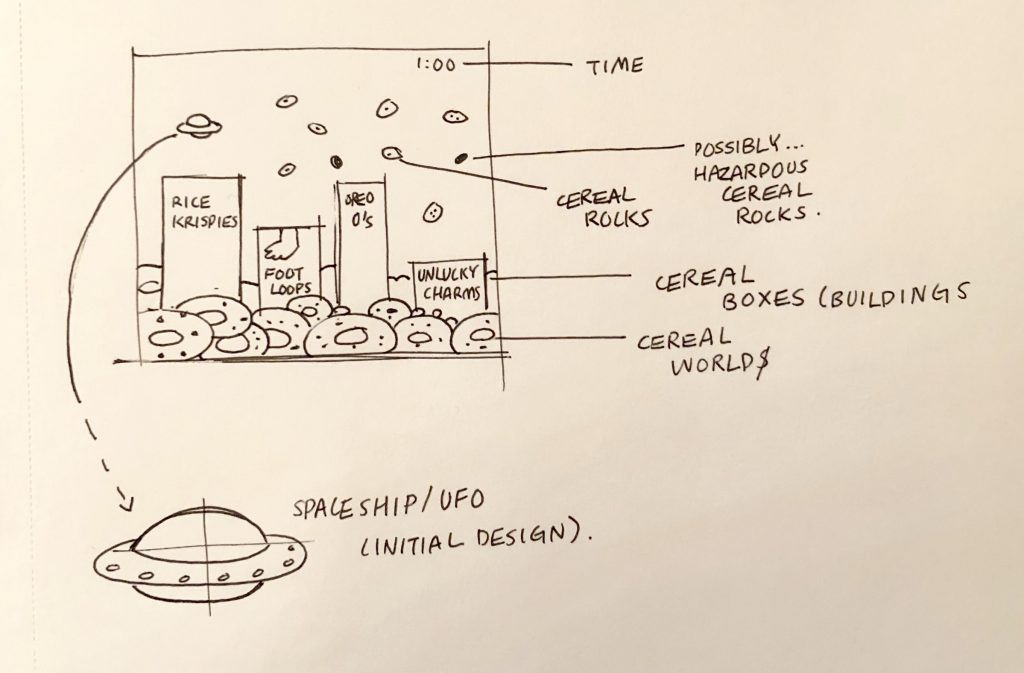
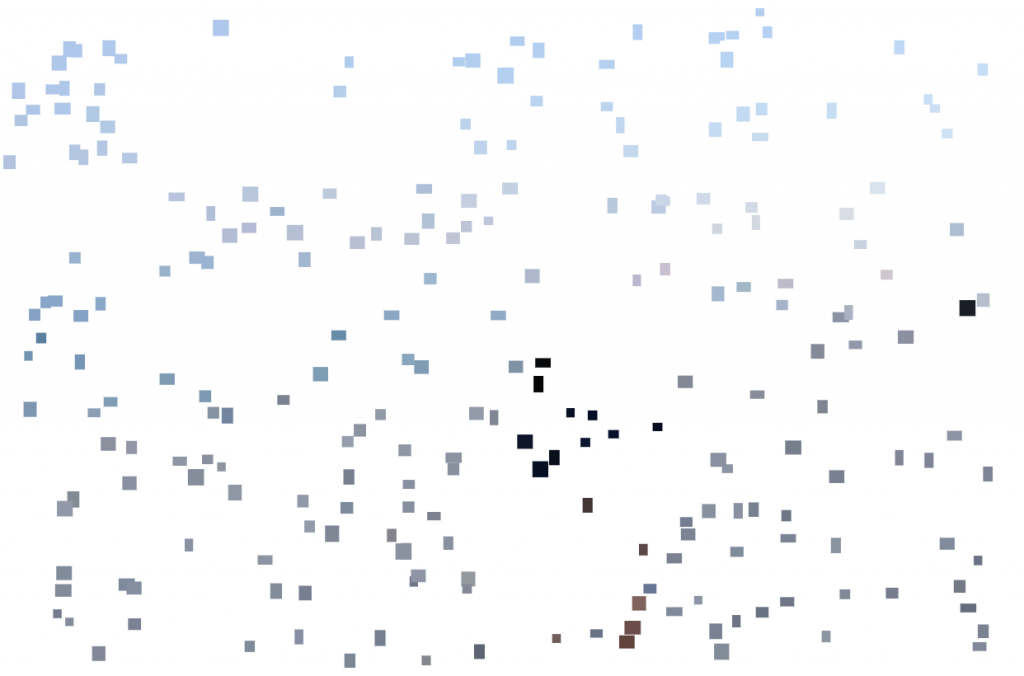
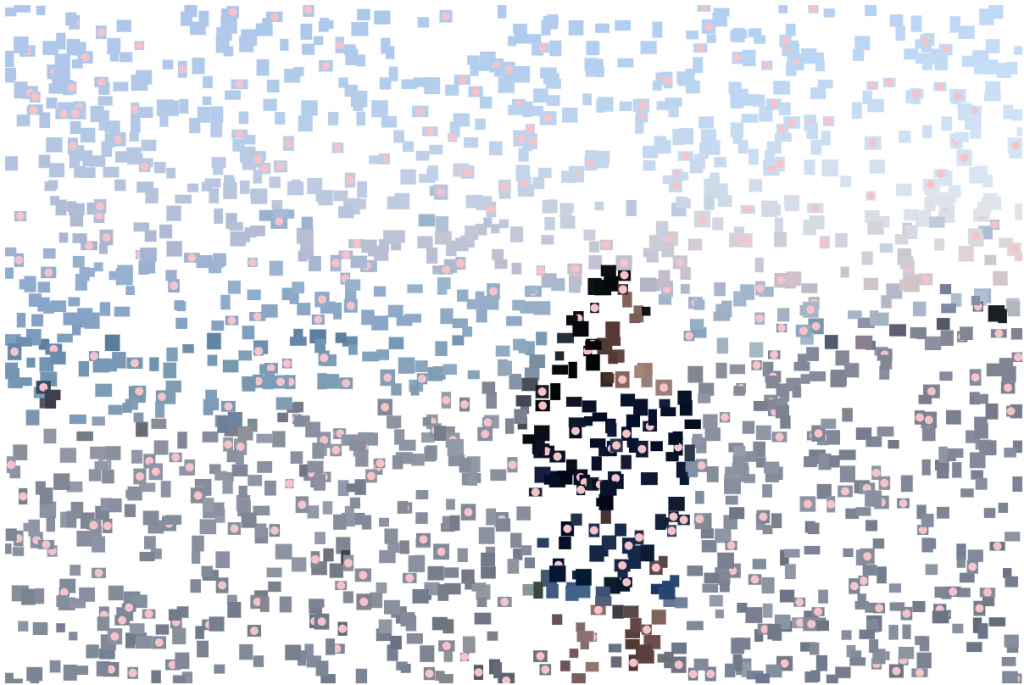
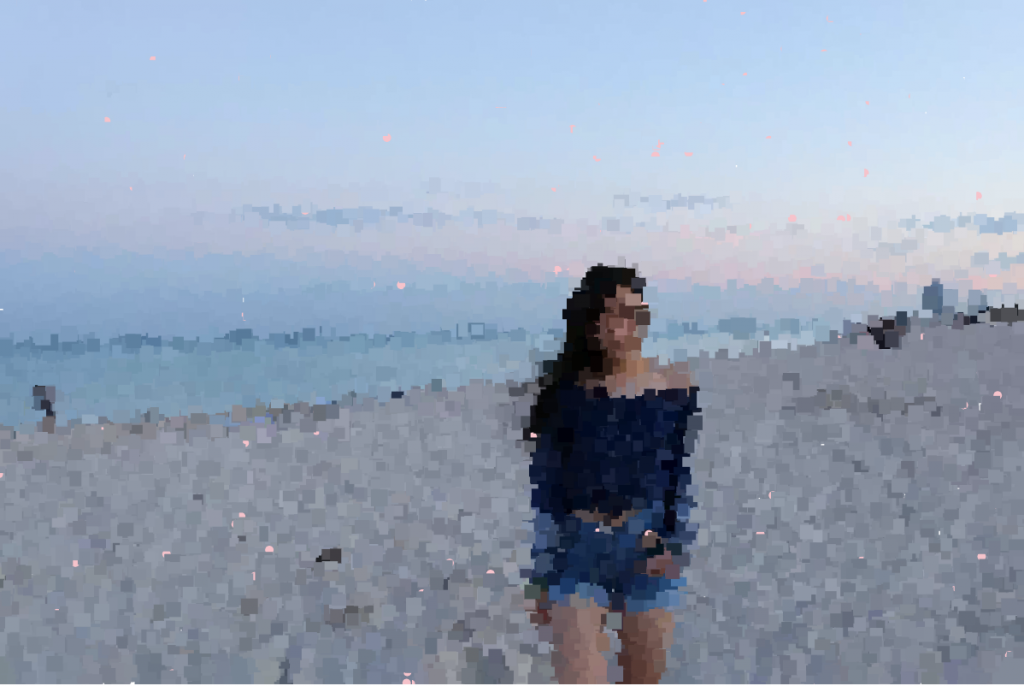
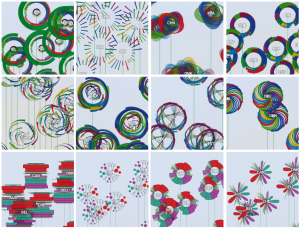
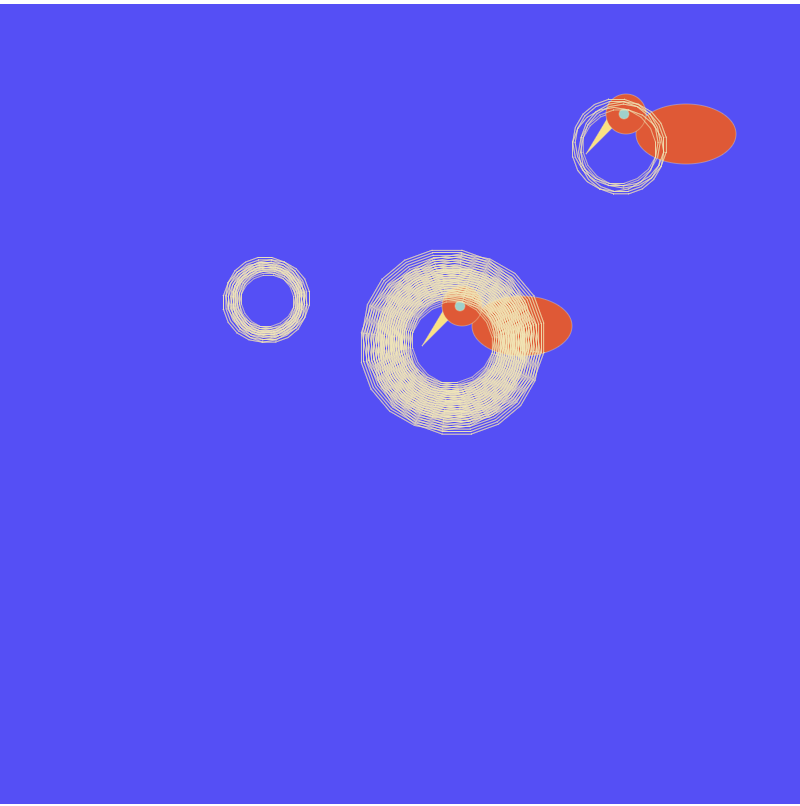
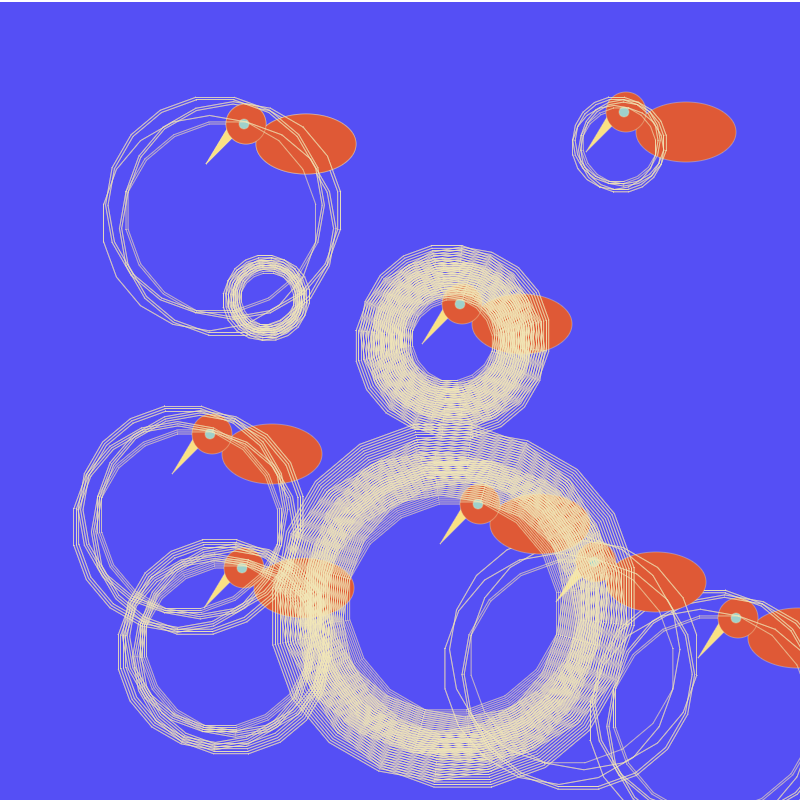
For this project, I used turtle to create a nest for each bird. Every time you click on the screen, a nest and a bird will appear. The nest’s size will eventually keep increasing to create a chaos. It was really enjoyable to experimenting with different angles and sizes.

Below are the screenshots of the results:

Jenna Kim(Jeeyoon Kim)- Looking Outwards- 10

Picture from performance

Of all the innovative women producing interesting works in the field of computational design and new media arts, Tina Frank’s works interested me the most. She is a graphic designer and a media artist who does most of the projects based on web design, cover design, music visualizations, and many more. Tria, and her background is in web design and cover design for electronic music in the 1990s. She is also a founder and a creative director for design office, and she is a heavily influential being because she creates amazing works to visualize music through using generative tools. She is currently a professor for graphic designer in AusOne of the most interesting project she did in the past is called the “A/V performance COH & Frank”. It is a musical performance by two designers who would program to create music and images live. The images were produced during the performance by utilizing the audio frequencies of the music and these went through Synchronator. After it has been put into Synchronator, it tells the computer to play a digital video that can be projected on to the wall. I admire this project because unlike any other musical performances which involve voice or instruments, this project is a performance by designers’ manipulation of the programs, music, and images.

Jenna Kim (Jeeyoon Kim) – Project 10 – Landscape

jeeyoonk10

/* Jenna Kim (Jeeyoon Kim)
Section E
jeeyoonk@andrew.cmu.edu
Project 10
*/

var hillSpeed = 0.00055;
var hillDetail = 0.0055;
var yN = 50;
var trees = [];

var x = [];
var y = [];

function setup() {
   createCanvas(500, 400);

    for (i = 0; i < 100; i++){ //setting for stars placement
        x[i] = random(50, width);
        y[i] = random(50, width / 2);
    }
    //trees
    for (var j = 0; j < 15; j++){
        var rx = random(width);
        trees[j] = makeTree(rx);
    }
    frameRate(10);
}


function draw(){
    background(24, 44, 63);
    var S = second();
     for(i = 0; i < S; i++){ //tiny firefly appears every "SEC"
        fill(255);
        noStroke();
        ellipse(x[i], y[i], 3, 3);
    }
    hill();
    wave();
    updateAndDisplayTrees();
    noStroke();
    ellipse(width-55, 40, 45, 45); //pink moon
}

function star() {
    for(i = 0; i < S; i++){ //star appears every "SEC"
        fill(247, 246, 146);
        noStroke();
        ellipse(x[i], y[i], 4, 4);
    }
}
//drawing hill
function hill() {
    stroke(49, 110, 167);
    beginShape(); 
    for (var x = 0; x < width; x++) {
        var t = (x * hillDetail) + (millis() * hillSpeed);
        var y = map(noise(t), 0,1, 30, height-35);
        //vertex(x, y); 
        line(x, y, x, height);
    }
    noStroke(); //ground
    fill(136, 143, 208);
    rect(0, 380, width, 20)
    endShape();
} 

function wave(){ //drawing waves
    beginShape();
    fill(221, 153, 205);
    var xN = yN;
    for (var x = 0; x <= width; x += 10){
        var y = map(noise(xN, yN), 0, 1, 200, 400);
        //setting the vertex
        vertex(x, y - 0.005); //x dimension
        xN += 0.05;
    }
    yN += 0.055; //y dimension
    vertex(width, height - 20);
    vertex(0, height - 20);
    endShape();

}

// DISPLAYING TREES
function updateAndDisplayTrees(){
    for (var j = 0; j < trees.length; j++){
        trees[j].move();
        trees[j].display();
    }
}

// Trees are removed when hitting the edge
function RTrees(){
    var TreesToKeep = [];
    for (var i = 0; i < trees.length; i++){
        if (trees[i].x + trees[i].breadth > 0) {
            keepTrees.push(trees[i]);
        }
    }
    trees = TreesToKeep;
}

// adding tree to the end
function addrandomTreeswithProbability() {
    var newTreesLikelihood = 0.05;
    if (random(0,4) < newTreesLikelihood) {
        trees.push(makeTree(width));
    }
}

// update position of tree every frame
function treeMove() {
    this.x += this.speed;
}

// drawing the trees
function treeDisplay() {
    var floorHeight = 5;
    var bHeight = this.nFloors * floorHeight * 2;
    noStroke();
    //drawing tree trunks
    push();
    translate(this.x, height - 20);
    fill(24, 44, 63);
    rect(3, -bHeight, this.breadth, bHeight);
    // drawing top part of the tree
    fill(105, 247, 193);
    ellipse(3, -bHeight, bHeight / 2, bHeight / 2);
    pop();
}


function makeTree(birthLocationX) {
    var TRR = {x: birthLocationX,
             breadth: 1,
             speed: -0.5,
             nFloors: round(random(2,4)),
             move: treeMove,
             display: treeDisplay}
    return TRR;
}

For this project, I had fun making this animation, but at the same time, it was very difficult to figure out how to place the trees and try different variations for the mountains. I tried to make this very aesthetic and attractive by thinking a lot about good color combination. I added stars so that they appear every second. The final result is close to what I wanted, and I want to develop it further in the future.

sketch

Jenna Kim (Jeeyoon Kim) – Project 09 – Portrait

jeeyoonk09

/* Jenna Kim (Jeeyoon Kim)
Section E
jeeyoonk@andrew.cmu.edu
Project 9: Portrait
*/

//GLOBAL variable for the IMAGE
var jen;

// preloading image ON THE CANVAS
function preload() {
    jen = loadImage("https://i.imgur.com/gvGuJiN.jpg?1"); 
}

function setup(){
	//canvas setting
	createCanvas(600, 400);
	background(255);
	jen.loadPixels(); //draw image
	noStroke();
	imageMode(CENTER);
	frameRate(150);
} 
function draw(){
	// starting from the first half of the page and then the left
	var jx = random(width);
	var jy = random(height);
	//constraining to canvas
	var jjx = constrain(floor(jx), 0, width - 15);
	var jjy = constrain(floor(jy), 0, height - 15);
	//picking color from the image
	var C = jen.get(jjx, jjy);

	//drawing rectangular pixels
	noStroke();
	fill(C);
	rectMode(CENTER);
	rect(jx, jy, random(5, 10), random(5, 10));

	//when mouse is pressed, pink circles are created
	if (mouseIsPressed){
		noStroke();
		fill("pink");
		ellipse(jx, jy, 5, 5);

	}
}

For this project, I used a portrait of my friend Jenny. I randomized simple rectangular forms to complete Jenny’s portrait. Looking at others’ portraits and trying different codes for my project, I was amazed by how many variations you can use to create a
pixelated portrait. When you click on the screen, pink circles come up because I personally like the pink sky in the back and I wanted the pink color to show up on other parts of the portrait too. It’s fun to look at the pink circles disappear as more rectangular shapes show up.

original photo

middle process
What it’s supposed to look like as the forming of portrait goes to end

Jenna Kim(Jeeyoon Kim)- Looking Outwards- 09

Installation piece in Senyai
Sound Vector Drawing

Peer Review Here!

This week’s Looking Outwards post is a review of Howard’s Looking Outwards post from Week 3. I came across this Looking Outwards because I was so familiar with the architectural installation picture; I have seen it in real life. EPIPTHYTE lab, created by Cupkova and Craig, is an installation piece rests in Senyai restaurant. The cited project amazes me because although it looks like a simple, patterned installation, there is so much meaning and thought into it. The project is combined of 275 different slats pieced together perfectly to control the lighting and the acoustic levels of the restaurant as a whole. The software created the form of each piece and it was finally produced with laser cutter. I agree with the part about vault rising and falling perfectly to demonstrate the sensitivity of the wave like form. As a design student who had visited Senyai before, I want to add that this installation brings the audience a whole new experience; the installation immerses the audience into the space because of its meticulous form and pure white color.

Link to Original Work

Jenna Kim (Jeeyoon Kim)- Looking Outwards-8

Alexander Chen is a creative director at Google Creative Lab. He did various works including MTA.ME, which altered the NYC subway map to a string instrument, and invented “Les Paul Doodle” with his Google Team. He worked with different companies such as The Barbarian Group, Modernista, and Google, where he currently works in. As a both musician and a creative interaction designer, he does body of work that combine both music and coding. He says that seeing his children discover different instruments and playing around with melody inspires him to create coding that lets him see music in inspiring, new ways. One of his project called the “Pianophase” is a visualization that demonstrates Steve Reich’s 1967 piece Piano Phase into lines with different colors and patterns. He made two pianists repeat the the same note in different speed; one musical pattern draws faster than the other one. I really admire his work because as of lover of both coding and music, he figured out a way to make a harmony between the two. Also, the way he tries to show invisible thing, music, into a visual form is a very fresh idea. He presented most of his work and their descriptions in his main portfolio website. His website is generally very easy to interact because of the simplicity and the visuals that are easily accessible. I learned that simplicity in presenting works can help the audience understand the projects much better.

Link to his website: http://chenalexander.com/

Jenna Kim (Jeeyoon Kim)- Looking Outwards-7

Final Product of OECD data visualization

Exploration of different shapes and colors.

OECD Better life Index, a project by Moritz Stefaner, is a data visualization project that compares the well being of the world based on GDP. The purpose of this way to demonstrate the ranking of the world based on data visualization is to promote and brand OECD as a whole. Your Better Life Index helps the users compare the factors that relate to the GDP: education, environment, education, standard of living, and many more. The index as a whole is an interactive data visualization in which the height of the flower represents the total score of the country. Also, each length of the petal represents the topics like income, jobs, education, health, safety and many more. Therefore, the height of the flower becomes taller if the total score rises up, and the length of each petal becomes longer if the rating of the topic is higher than before. Users can also control the rates of the topics based on what they think is important to their lives. I admire this project because this project really thinks about the users and what they would be interested while using this data visualization. User/ Human centered Design, a creative method of problem solving and having strong ties with human perspective. is one of the most important topics we design students are learning through the CMU design. This project by Stefaner blends this major design concept well with how to make data visualization, one of the topics in 104. The algorithm that generated the work required various tools such as webpack, react, Material UI, and many more. He explored different design tools, and coded to make the final product. His artistic sensibilities are demonstrated in both the process work and the final work. He tried different colors and forms/ shapes to find the right fit for OECD. He looked for shapes and colors that users can view the brand as friendly and organic.
LINK: http://truth-and-beauty.net/projects/oecd-better-life-index
–> Shows the code and the design.