/* Jenna Kim (Jeeyoon Kim)
Section E
jeeyoonk@andrew.cmu.edu
Project 7
*/

var nPoints = 360

function setup() {
    createCanvas(500, 500);

}

function draw() {
	//drawing curve
	background(130, 20, 40);
	push();
	translate(width / 2, height / 2);
	drawAstroidCurve();
	pop();

	fill(255, 100);
	textSize (30);
	textFont('Roboto');

	text("CHAOS", width / 2 - 50, 480);
}

function drawAstroidCurve() { //
	// Astroid;
	//Link: http://mathworld.wolfram.com/Astroid.html
	var x;
	var y;
	var xR = constrain(mouseX, 0, 500);
	var ellipseR = map(mouseX, 0, 500, 10, 120);
	var a = map(xR, 0, 500, 40, 30);
	var b = map(xR, 0, 500, 50, 300);
	var h = constrain(mouseY, 0, 400);


	stroke(255);
	strokeWeight(0.5);

	//chaotic ASTROID CURVE
	beginShape();
	fill(130, 20, 40);
	for (var i = 0; i < nPoints; i++) {
		x = (4 * a * cos(i)) + (b * cos(3 * h * i));
	    y = (2 * a * sin(i)) - (b * sin(3 * h * i));
        vertex(x, y);
	};
	endShape(CLOSE);

	noStroke();
	fill(255);
	ellipse(3, 5, ellipseR, 50);
}
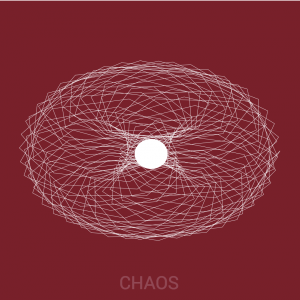
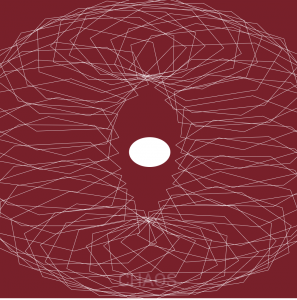
For this project, I wanted curves that combine to create a chaotic feeling. The ellipse in the middle is supposed to represent a ball of string, and make the whole canvas look like the string is “unraveling” from the ball of string (the ellipse in the middle). I used an Astroid curve from the MathWorld site to reference the function. At first, I was confused on how to utilize map(); and constrain(); to explore different curves and its sizes and limits. However, I eventually understood these concepts through this project. Throughout out the project, I was really amazed on how many variations of curves an asteroid that create although I input certain constraints.
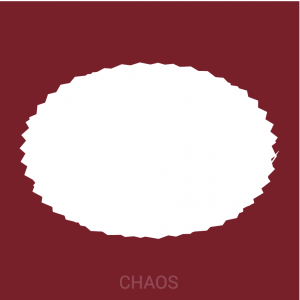
Below are my process work. The top picture shows that I struggled for awhile on how to make the curves show in thin lines. I realized that I had to fill them with background color. The bottom picture is another part of the process. I explored different constrain();.
![[OLD FALL 2018] 15-104 • Introduction to Computing for Creative Practice](../../../../wp-content/uploads/2020/08/stop-banner.png)
 using the “Grasshopper”