![[OLD FALL 2018] 15-104 • Introduction to Computing for Creative Practice](../../../../wp-content/uploads/2020/08/stop-banner.png)
/*
Yingying Yan
Section E
yingyiny@andrew.cmu.edu
Project-07-curve
*/
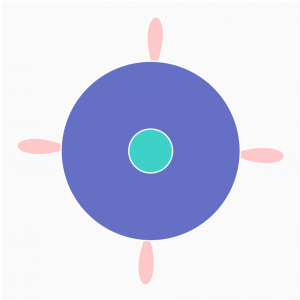
var k = 1; // controls the numbers for the flower
function setup() {
createCanvas(480, 480);
angleMode (DEGREES)
frameRate(15);
}
function draw() {
background(220);
translate(240,240);
stroke(0);
strokeWeight(2);
noFill();
// call the flower function and draw the curve
flower();
}
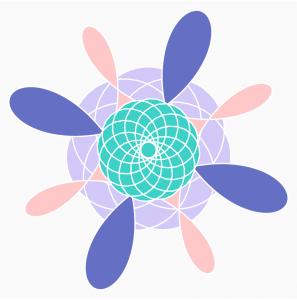
function flower() {
// x = cos(k data) cos(data)
// y = cos(k data) sin(data)
//identify all the variables from the equation
var x;
var y;
var theta = 45;
//map and constrain to make mouseX and mouseY control the size and
//number of panels of the flower
var boundX = constrain(mouseX, 0, 480);
var boundY = constrain(mouseY, 0, 480);
var k = map(boundX, 0, 480, 0, 20);
var theta = map(boundY, 0, 480, 45, 360);
var sizz = map(boundX, 0, 480, 100, 250);
//i has to start at 500 otherwise the size of the flower will be too small
//then plug all variables into the equation from wekipedia
beginShape()
for (var i = 500; i < 1000; i++) {
x = cos(k * theta) * cos(theta)
y = cos(k * theta) * sin(theta)
vertex(x * sizz, y * sizz);
theta += 1; //keep theta changes to make more interesting shape
}
endShape();
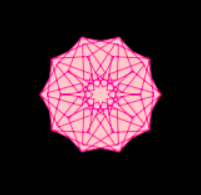
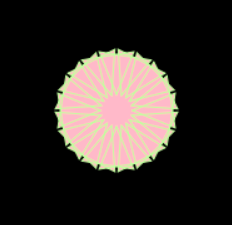
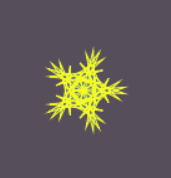
}I used the rose formula from Wikipedia. I think this project is very fun because it is not super hard but simple code creates a crazy result. This project also allowed me to understand “constraint” and “map” better. I never thought that they can be used together, and they are so cool! I do not have enough time to render my drawing, but it turned out fine after all. I enjoy this project a lot.