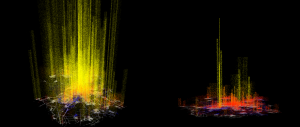
A project called “Amsterdam SMS” developed for MIT Senseable City Lab and Salzburg University.
This project was created by Aaron Koblin, and is an interactive tool that traced texts sent through Amsterdam. The data was provided by KPN mobile, and built with Processing and OpenGL. It’s a visualization of data, and it changes over time (IE more texts sent as the day goes on, the data changes). Aaron believes that data processing is the future of art and story, not just for business and computational related work. He has worked on everything from music videos to VR games and has work showcased around the globe. I like this project because it mixes an artistic sensibility (found in the colors, dimension, and interactivity of the tool) with a sense of use. I could look at this piece of data processing and see how this could could be extremely valuable to a company, as well as to a consumer. As for the created software, the piece was built with Processing and OpenGL.
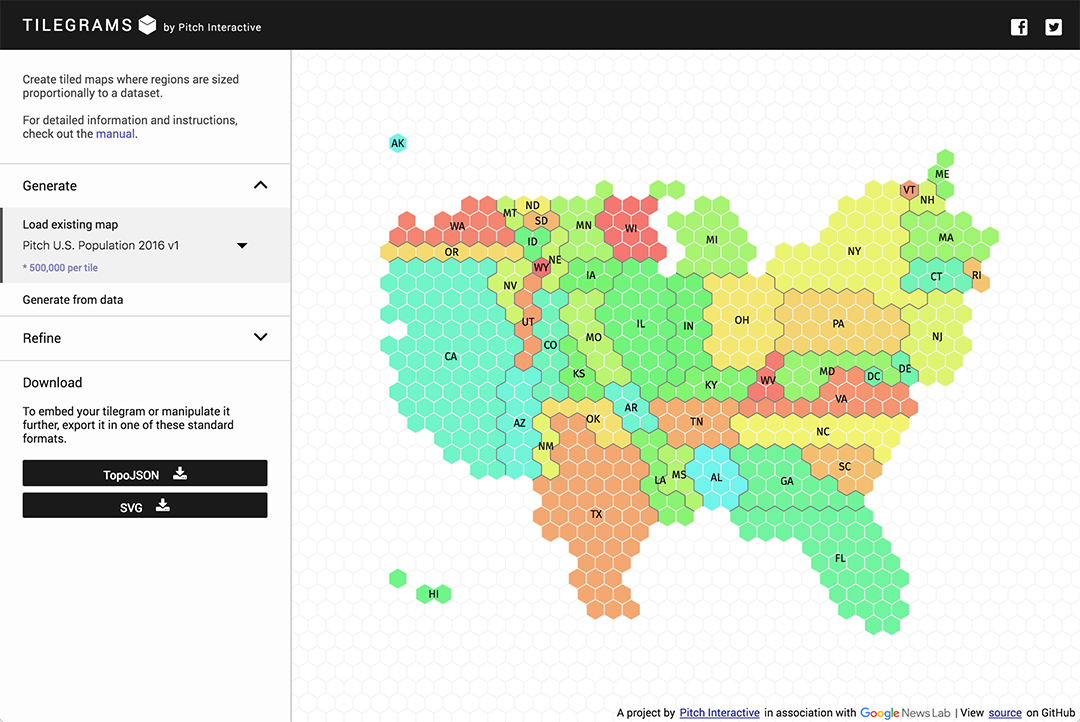
Tilegrams is an open source tool for creating statistically accurate maps. Data-representative tiles are arranged, shuffled, and colour-coordinated to visualize data.
US state map based on 2015 population data.
The Pitch Interactive team, led by Wes Grubbs, designed Tilegrams to employ a cartogram algorithm that balances geographic resemblance with statistical accuracy. The tool ingests a state-level dataset in order to output a cartogram which is them sampled to produce the tile elements––which inspired the name “Tilegrams” from tiled cartograms.
Tilegrams demo, 2016.
Primary design choices were implemented by the creators, allowing for the maps produced by the tool to remain visually consistent. However, drawing tools including drag to move and marquee selection give users the chance to customize and validate information.
I admire the fact that it can take into account a broad scope of data from all different users and produce attractive visualizations in every scenario. Tilegrams is currently being developed to accept beyond country-wide data with the cooperation of Google News Lab.
/*
Yingying Yan
Section E
yingyiny@andrew.cmu.edu
Project-06
*/

function setup() {
    createCanvas(480, 480);
    angleMode(DEGREES);
}

function draw() {

    background(13, 18, 54)

	translate(240,240)
    //change hour, min and sec into variables
	var hr = hour();
    var min = minute();
    var sec = second();

    //rotate the entire canvas so people can read it as a clock

    rotate(-90);
    noFill();

    //remap hour into 360 degree angles and draw an
    //arc that keeps track of the hours
    var mappedHr = map(hr % 12, 0, 12, 0, 360);
    push();
    stroke(5, 167, 221);
    strokeWeight (20);
    arc(0,0,300,300, 0, mappedHr);
    pop();
    //remap min into 360 degree angles and draw an
    //arc that keeps track of the minutes
    var mappedMin = map(min, 0, 59, 0, 360);
    push();
    stroke(223, 230, 244);
    strokeWeight(10);
    arc(0,0,200,200, 0, mappedMin);
    pop();

    //remap second into 360 degree angles
    var mappedSec = map(sec, 0, 59, 0, 360);

    //re rotate the circlces or planets
    push()
    rotate(-45)

    //planet one which follows the hour
    push()
    rotate(mappedHr);
    noStroke()
    fill(42, 51, 127, 100);
    ellipse(100, 100, 50, 50);
    pop();

    //planet two which follows the minutes
    push()
    rotate(mappedMin);
    noStroke()
    fill(181, 175, 215);
    ellipse(70, 70, 25, 25);
    pop()

    //planet three which follows the seconds
    push();
    rotate(mappedSec);
    strokeWeight(2);
    fill(38, 13, 52);
    ellipse(50, 50, 10, 10);
    line(0,0,47.5,47.5);
    pop();
    pop();

}
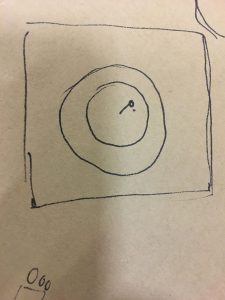
For this project, I wanted to make a simple clock without hands or number. But something similar to how one planet rotates around another in a certain amount of time. So I choose to keep track of hour, minutes and sections with a circle similar to the shapes of the planets. I began with something very complicated but I could not figure out how to do that, so I changed my mind to make something simple and abstract.
/*Dani Delgado
Section E
ddelgad1@andrew.cmu.edu
Project 06
*/

function setup() {
    createCanvas(480, 375);

}

function draw() {
	background(250);

	//set the time variables
    var h = hour();
    var m = minute();
    var s = second();

	//draw the static background / peices
	//draw the "city"
	//draw the buildings
	noStroke();
	fill(60, 60, 80, 90);
	rect(0, 0, width, height / 2 + 20);

	//draw the building shadows
	noStroke();
	fill(20, 20, 40, 90);
	rect(90, 0, 10, height / 2 + 20, 60, 0, 0, 0);
	rect(350, 0, 10, height / 2 + 20, 0, 60, 0, 0);

	//draw a moving person
	//set the moving variables
	var mapp = map(m, 0, 60, width, 0);
    var personX = mapp;
    var speed = m;

	//draw the person walking on a minute long loop
    push();
    personX += speed;
	ellipseMode(CORNER);
	noStroke();
	fill(0, 45, 50, 60);
	ellipse(personX, 70, 40, 40);
	rect(personX, 110, 40, 200, 80);
    pop();

	//draw the window
	fill(230, 247, 255, 40);
	noStroke();
	rect(0, 0, width, height / 2 + 20);

	//draw the window highlights
	stroke(255, 255, 255, 90);
	strokeWeight(50);
	line(300, 0, 480, 200);
	strokeWeight(10);
	line(230, 0, 410, 207);
	strokeWeight(100);
	line(0, 150, 180, 350);

	//draw the window frame shadow
	noStroke();
	fill(80);
	rect(355, 0, 30, height / 2 + 20);
	rect(30, 0, 30, height /2 + 20);

    //window frame
	fill(120);
	rect(355, 0, 25, height / 2 + 17, 0, 0, 50, 0);
	rect(30, 0, 25, height /2 + 17, 0, 0, 50, 0);

	//draw the table
	noStroke();
	fill(157, 115, 70);
	rect(0, height / 2 + 20, width, height);
	fill(137, 95, 50);
	rect(0, 350, width, height);

	//draw the shadow of the mug
	 //make the mug shadow rotate bassed on the hour
    if (h >= 12) {
		h -= 12;
	}
	h = map(h, 0, 11, 0, 360);
	push();
	translate(160, 280);
	rotate(radians(h) - 0.25 * (TWO_PI))
	fill(127, 85, 40, 85);
	rect(0, 0, 100, 80, 60);
	pop();

	//draw the mug
	noStroke();
	fill(204, 255, 212);
	rect(115, 220, 120, 80, 0, 0, 90, 90);
	fill(164, 215, 172);
	ellipse(175, 220, 120, 20);
	fill(77, 51, 0);
	ellipse(175, 225, 100, 10);

	stroke(204, 255, 212);
	strokeWeight(10);
	noFill();
	arc(115, 255, 45, 45, radians(80), radians(300), TWO_PI);

	//draw the steam and make it move
	//the steam moves up and down with each second
	//first set the needed variables
	//and then create an if statement that makes it move up or down every other second
	var steam1Y = 200;
	var steam2Y = 180;
	if ((s % 2) > 0) {
        steam1Y = 200;
        steam2Y = 180;
	} else if (( s % 2) == 0) {
		steam1Y = 190;
		steam2Y = 170;
	}
	//draw the steam itself
	//left puff of smoke
	fill(255);
	noStroke();
	ellipse(155, steam1Y + 10, 8, 8);
	ellipse(152, steam1Y + 5, 10, 10);
	ellipse(159, steam1Y - 2, 15, 15);
	ellipse(155, steam1Y - 10, 15, 15);
	ellipse(162, steam1Y - 14, 16, 16);
    //right puff of smoke
	ellipse(195, steam2Y, 10, 10);
	ellipse(200, steam2Y - 6, 12, 12);
	ellipse(198, steam2Y + 5, 8, 8);
	ellipse(197, steam2Y - 10, 15, 15);
    ellipse(202, steam2Y - 14, 18, 18);
    ellipse(198, steam2Y - 20, 12, 12);


}
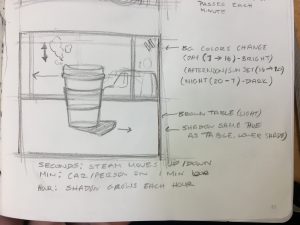
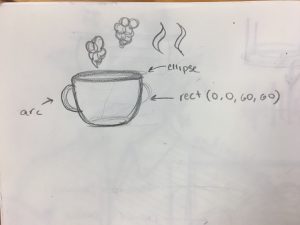
This project was a bit challenging for me, especially when coming up with a concept to go with. However, completing the extra credit assignment really helped me to understand the mechanics that goes into making a clock work. I went with a coffee shop idea after looking at how the shadows around my coffee cup collection on my desk change as the day goes on and I thought that it would make a cute clock idea.
There are a few details I wish I could have ironed out but overall I think that this clock is cute and fun.
The steam moves with seconds, the person outside the window moves along with the minutes, and the shadow of the cup rotates with each hour.
An initial sketch of the clock landscapemug and steam development
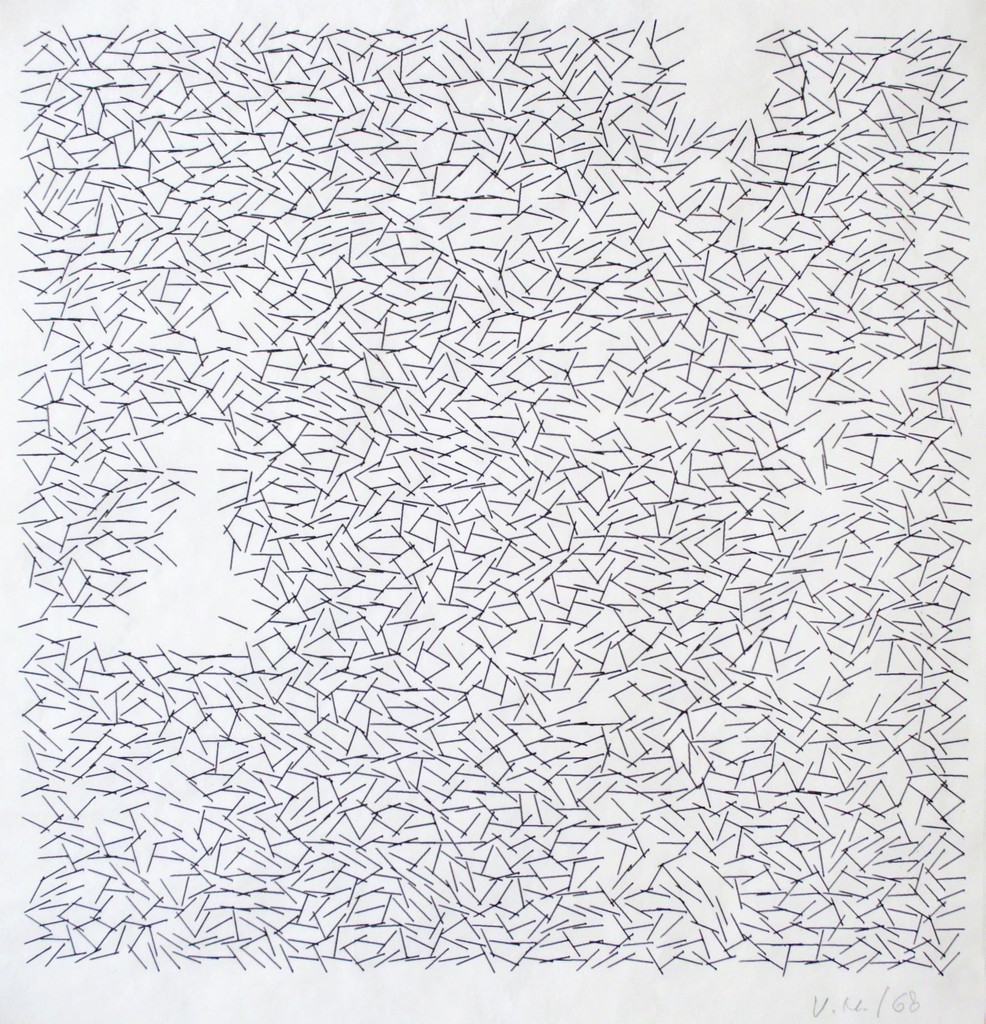
Interruptions (1968) by Vera Molnar is a series of drawings of computer graphics generated by Molnar, herself. Molnar introduced randomness into her practice when she began to use computers because she realized humans could not produce pure randomness without it looking repetitive. From what I’ve gathered through research, Interruptions was made using an iterative process. With each new work, she modified her algorithm to build upon the last, exploring a range of possibilities. This implies that her earliest images in the series can be defined as the most random. As she continued to alter her code, adding new structures, her algorithm generated images more specific to what she desired. Molnar’s meticulousness is apparent upon viewing her work: Viewers can see that Molnar used a grid to structure the placement of a line. There is obviously a set of rules that predetermine how the lines shift. I admire the generative process that Molnar placed her code under. Her use of programming to explore ranges of possibilities is an interesting use of computers. She understood the limitations of humans, and thereby employed computers to do the work for her. She was a pioneer and Interruptions is a manifestation of her ability to think outside of the box.
/* Miranda Luong
Section E
mluong@andrew.cmu.edu
Project-06
*/

var prevSec;
var millisRolloverTime;

function setup() {
    createCanvas(300, 300);
}

function draw() {
    background(154,191,219);

    // Fetch the current time
    var H = hour();
    var M = minute();
    var S = second();

    // Reckon the current millisecond,
    // particularly if the second has rolled over.
    // Note that this is more correct than using millis()%1000;

    if (prevSec != S) {
        millisRolloverTime = millis();
    }
    prevSec = S;
    var mils = floor(millis() - millisRolloverTime);

    // print current time next to corresponding colors
    noStroke();
    fill(0);
    text("Hour: "   + H, 30, 22);
    text("Minute: " + M, 30, 42);
    text("Second: " + S, 30, 62);
    text("Millis: " + mils, 30, 82);

    fill(0);
    ellipse(15,18,12,12);
    fill(255/3);
    ellipse(15,38,12,12);
    fill(255*(2/3));
    ellipse(15,58,12,12);
    fill(255);
    ellipse(15,78,12,12);

    //Hours
    var hStart = 0 - HALF_PI //first arc always starts at 0
    var hRadius = 100+(200/24) //first arc radius
    //loop creates individual wedges, the number of wedges corresponding to current hour
    for (var a = 0; a < H; a ++){
        stroke(255);
        fill(0);
        //creates arc from point of 'start' to 'start' plus the 'i'th wedge
        arc(50 + width / 2, 10 + height / 2, hRadius, hRadius, hStart, hStart + (TWO_PI/24), PIE);
        //reassigns start with the addition of 'i'th wedge
        hStart += (TWO_PI/24)
        hRadius += (200/24)
    }

    //Minutes
    var mStart = 0 - HALF_PI
    var mRadius = 75+(200/60) //first arc radius
    //loop creates individual wedges, the number of wedges corresponding to current minute
    for (var a = 0; a < M; a ++){
        fill(255/3);
        stroke(255);
        //creates arc from point of 'start' to 'start' plus the 'i'th wedge
        arc(50 + width / 2, 10 + height / 2, mRadius, mRadius, mStart, mStart + (TWO_PI/60), PIE);
        //reassigns start with the addition of 'i'th wedge
        mStart += (TWO_PI/60)
        //reassigns radius of next wedge to
        mRadius += (200/60)
    }

    var sStart = 0 - HALF_PI
    var sRadius = 25+(200/60) //first arc radius
    //loop creates individual wedges, the number of wedges corresponding to number of values in array
    for (var a = 0; a < S; a ++){
    //loop generates shades of grey, value increasing in accordance to number of values in array
        fill(255*(2/3));
        stroke(255);
        //creates arc from point of 'start' to 'start' plus the 'i'th wedge
        arc(50 + width / 2, 10 + height / 2, sRadius, sRadius, sStart, sStart + (TWO_PI/60), PIE);
        //reassigns start with the addition of 'i'th wedge
        sStart += (TWO_PI/60)
        sRadius += (200/60)
    }

    var msStart = 0 - HALF_PI
    var msRadius = 0 //first arc radius
    //loop creates individual wedges, the number of wedges corresponding to number of values in array
    for (var a = 0; a < mils; a ++){
    //loop generates shades of grey, value increasing in accordance to number of values in array
        fill(255);
        //creates arc from point of 'start' to 'start' plus the 'i'th wedge
        arc(50 + width / 2, 10 + height / 2, msRadius, msRadius, msStart, msStart + (TWO_PI/1000), PIE);
        //reassigns start with the addition of 'i'th wedge
        msStart += (TWO_PI/1000)
        msRadius += (200/1000)
    }
}
This was a really fun project. I found it interesting thinking of a new way to display time. My project isn’t very abstract, in fact, I think it’s much more literal than a normal clock, seeing as it counts for every increase in every hour, minute and second of time. My code references the tally assignment we had to do the week prior, so it was a great way of implementing old knowledge.
function setup() {
    createCanvas(480, 480);
}

function draw() {
	//create background color
    background(13, 0, 76);

    fill(255, 245, 104);
    rect(0,0, width, height/4);

    fill(255, 245, 104);
    rect(0, 4 * height / 5, width, height/5);

    //set up speed of time
    var H = map(hour() + norm(minute(), 0, 60), 0, 24, 0, TWO_PI * 2) - HALF_PI;
    var M = map(minute() + norm(second(), 0, 60), 0, 60, 0, TWO_PI) - HALF_PI;
    var S = map(second(), 0, 60, 0, TWO_PI) - HALF_PI;

    //declare variables for the centers of ellipses
    var cxH = width / 5;
    var cyH = height / 2;
    var cxM = width / 2;
    var cyM = height / 2;
    var cxS = 4 * width / 5;
    var cyS = height / 2;

    //create three ellipses that represent hour, minute, and second
    fill(255, 255, 255, 90);
    stroke(255);
    strokeWeight(5);
    ellipse(cxH, cyH, 100, 100);
    ellipse(cxM, cyM, 100, 100);
    ellipse(cxS, cyS, 100, 100);

    //print text for colon
    fill(255);
    textSize(40);
    strokeWeight(5);
    text(':', 160, height / 2 + 10);
    text(':', 305, height / 2 + 10);

    //print ellipses for hour, minute, and second based on the speed of time and angle using radians
    fill(255);
    strokeWeight(5);
    stroke(255, 245, 104);
    line(cxH - cos(H) * 50, cyH - sin(H) * 50, cxH + cos(H) * 50, cyH + sin(H) * 50);
    /*
    //trial and error
    fill(200);
    line(cxH, cyH, cxH+cos(H/2)*25, cyH+sin(H/2)*25);
    var startX = cxH+cos(H/2)*25
    var startY = cyH+sin(H/2)*25
    line(startX-cos(H)*40, startY-sin(H)*40, startX+cos(H)*40, startY+sin(H)*40)
    */
    stroke(255, 245, 104);
    fill(255, 245, 104);
    ellipse(cxH + cos(H) * 50, cyH + sin(H) * 50, 10, 10);

    strokeWeight(5);
    fill(255);
    line(cxM - cos(M) * 50, cyM - sin(M) * 50, cxM + cos(M) * 50, cyM + sin(M) * 50);
    stroke(255, 245, 104);
    fill(255, 245, 104);
    ellipse(cxM + cos(M) * 50, cyM + sin(M) * 50, 10, 10);

    strokeWeight(5);
    fill(255);
    line(cxS - cos(S) * 50, cyS - sin(S) * 50, cxS + cos(S) * 50, cyS + sin(S) * 50);
    stroke(255, 245, 104);
    fill(255, 245, 104);
    ellipse(cxS + cos(S) * 50, cyS + sin(S) * 50, 10, 10);

    //print time in text form
    fill(255);
    noStroke();
    textFont('didot');
    textSize(15);
    translate(-40,30);
    text("Hour: " + nfc(H, 0), cxH + 10, 300);
    text("Minute: " + nfc(minute(), 0), cxM + 5, 300);
    text("Second: " + nfc(second(), 0), cxS, 300);

}
As usual, I learned a lot from coding this project. For me, figuring out the specific angles to set it to the speed of the time was the most challenging part. My first attempt was to make the sticks indicating the time the letters, H, M, and S. However, figuring out the angle of each letter based on the center point of the ellipses were challenging since the letters were not symmetrical. I ended up creating this golden clock to visually represent the hour, minute, and second just like how many digital clocks are these days.
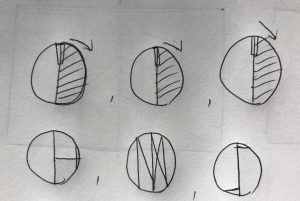
This is my abstract clock. It was challenging to get the fingers to tap and I ended up using a modulus to determine if the number values were even or odd. Pretty proud of myself to be honest. The index finger taps every other second, the middle finger every other minute, and lastly the thumb every other hour.
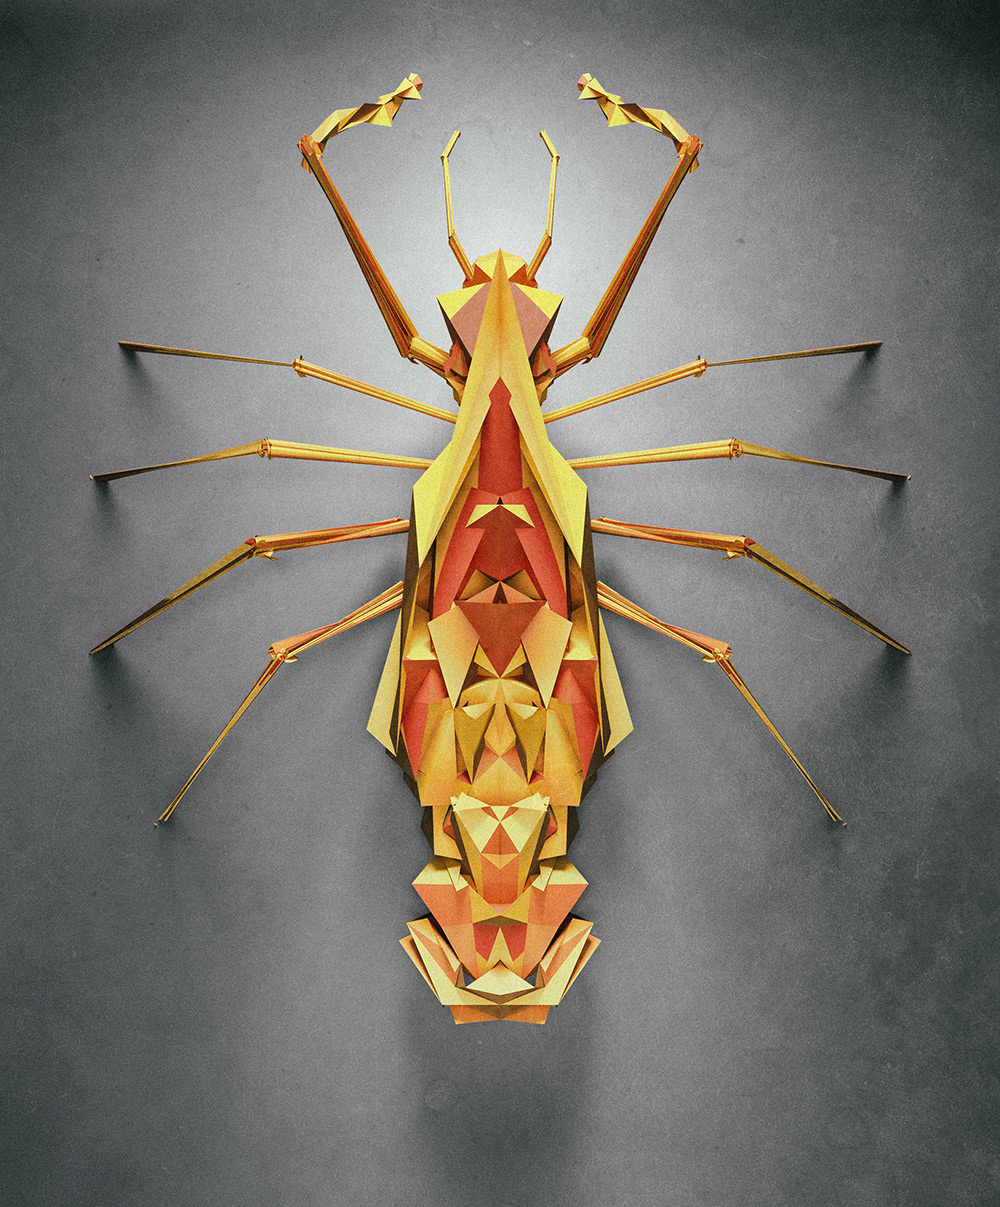
The creative agency Chaotic Atmospheres has a series of randomly generated polygonal insects. They were created in Cinema 4D using random values restricted by size parameters to generate the polygonal insect species.
It’s really interesting to me that they can take these randomly generated values and translate them into points. Afterwards, Chaotic Atmosphere will throw them into Photoshop to finish the render, taking the project to an entirely new level.
/* Rachel Lee
Section E
rwlee@andrew.cmu.edu
Project 06: Abstract Clock */

var tx = []; // flower x position array
var ty = []; // flower y position array

function setup() {
    createCanvas(400, 400);
    angleMode(DEGREES);

    var sec = second();
    var min = minute();
    var hr = hour();

// randomize position of flowers
    for (i = 0; i < 60; i ++) {
        tx[i] = random(85, 270);
        ty[i] = random(65, 260);
    }
}

function draw() {
	background(160, 190, 105);
	noStroke();

    var sec = second();
    var min = minute();
    var hr = hour();


// pond
	fill(160, 155, 160);
	ellipse(180, 170, 305, 305);

// color of pond water changes according to minute time bracket
	if (min >= 0 & min <= 20) {
		fill(65, 150, 150);
		ellipse(180, 170, 270, 270);
	} else if (min > 20 & min <= 40) {
		fill(65, 130, 180);
		ellipse(180, 170, 270, 270);
	} else if (min > 40 & min <= 60) {
		fill(65, 170, 130);
		ellipse(180, 170, 270, 270);
	}

// pebbles
    fill(145, 140, 145);
	ellipse(285, 285, 50, 60);
	fill(105, 100, 105);
	ellipse(310, 245, 35, 30);
	fill(200);
	ellipse(270, 285, 35, 30);
	fill(150);
	ellipse(245, 300, 35, 35);
	fill(220);
	ellipse(290, 255, 20, 20);

// tiny flowers: corresponds to seconds
    for (i = 0; i < sec; i ++) {
        fill(235, 105, 45);
        ellipse(tx[i], ty[i], 5, 5);
    }

// lilypads
    	fill(100, 140, 55);
    	ellipse(95, 183, 55, 40);
    	ellipse(155, 253, 55, 50);
    	ellipse(205, 100, 70, 60);
    	fill(125, 160, 60);
    	ellipse(95, 180, 55, 40);
    	ellipse(155, 250, 55, 50);
    	ellipse(205, 95, 70, 60);
	    fill(65, 150, 150);

// changing little lilypad wedge color according to pond water color
    	if (min >= 0 & min <= 20) {
		    fill(65, 150, 150);
		    triangle(125, 170, 95, 180, 125, 180);
		    triangle(175, 230, 145, 260, 205, 230);
		    triangle(215, 90, 240, 70, 245, 90);
	    } else if (min > 20 & min <= 40) {
		    fill(65, 130, 180);
		    triangle(125, 170, 95, 180, 125, 180);
		    triangle(175, 230, 145, 260, 205, 230);
		    triangle(215, 90, 240, 70, 245, 90);
	    } else if (min > 40 & min <= 60) {
		    fill(65, 170, 130);
		    triangle(125, 170, 95, 180, 125, 180);
            triangle(175, 230, 145, 260, 205, 230);
		    triangle(215, 90, 240, 70, 245, 90);
	    }

// firefly: moves according to hour
    push();
    noStroke();
    translate(width / 2.3, height / 2.5);
    rotate(360 / 60 * hr);
    fill(242);
    ellipse(-20, -40, 55, 20);
    ellipse(20, -40, 55, 20);
    fill(255);
    ellipse(-20, -45, 55, 20);
    ellipse(20, -45, 55, 20);
    stroke(240, 215, 70);
    strokeCap(ROUND);
    strokeWeight(20);
    line(0, 0, 0, -65);
    fill(0);
    noStroke();
    ellipse(-10, -60, 7, 7);
    ellipse(10, -60, 7, 7);
    pop();
}
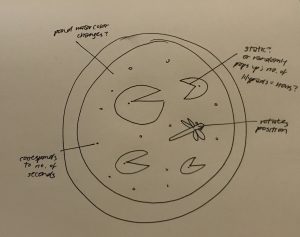
I really enjoy being in nature, so for my project wanted to imitate a scene I saw during a hike this summer. On my abstract clock, the dragonfly’s position represents the hour, the color of the pond water changes based on a particular range of minutes, and the number of orange ‘flowers’ represent seconds. This project was a little challenging, but rewarding to complete. I am very happy with how it turned out.
![[OLD FALL 2018] 15-104 • Introduction to Computing for Creative Practice](../../../../wp-content/uploads/2020/08/stop-banner.png)