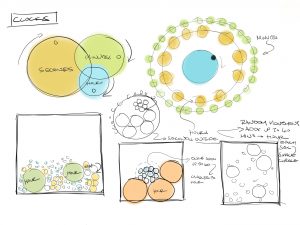
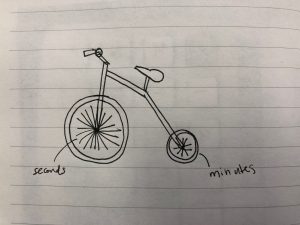
Eunice Choe – Looking Outwards -06

The canvas randomizes after every click.

The lines are random – some are curly and some are straight.

Matt Deslauriers, a creative developer created a generative art project (2016) that shows randomly drawn lines on a composition. In addition, clicking the canvas randomizes the composition into a new random set of lines and colors. I admire this piece because the different textured lines and splotches are visually pleasing without being too overwhelming. I also like the idea of entering a new experience with every click because of the randomized shapes and color combinations. Matt Deslauriers used Node.js to create the piece because it is reliable when working with large resolutions. Deslauriers also took inspiration from the strokes of impressionist paintings but accumulating the lines instead of constantly clearing the canvas. Simplex noise is used to make the particles move, as they are given random positions. In addition, the noise that controls the lines’ movement is randomized, which causes some lines to curl up and others to run straight. Deslauriers’ artistic sensibilities manifest in the piece through the impressionist influence and the randomized color palettes. Deslauriers based the color palettes off of popular and visually pleasing color combinations and ended up using 200 palettes in the final form.

Jason zhu-Project-06-Abstract Clock

sketch

/* Jason Zhu
jlzhu@andrew.cmu.edu
Section E
Project Abstract Clock
*/

var prevSec;
var millisRolloverTime;

function setup() {
    createCanvas(400, 355);
    background(8, 7, 17);
    millisRolloverTime = 0;
}

function draw() {
    noStroke();
    // Fetch the current time
    var H = hour();
    var M = minute();
    var S = second();
    var MS = millis();

    // predetermined function
    if (prevSec != S) {
        millisRolloverTime = millis();
    }
    prevSec = S;
    var mils = floor(millis() - millisRolloverTime);

    // display hour bar
    if (H==0){
        fill(8, 7, 17);
        rect(30,0,60,360);
    } else {
        for(i=0;i<H;i++){
            var r = (i*(255/23));
            var g = (0);
            var b = (0);
            fill(r,g,b);
            rect(30,(i*(300/23)),60,60);
        }
    }

    // display minute bar
    if (M==0){
        fill(8, 7, 17);
        rect(130,0,60,360);
    } else {
        for(i=0;i<M;i++){
            var r = (0);
            var g = (i*(255/59));
            var b = (0);
            fill(r,g,b);
            rect(130,i*(300/59),60,60);
        }
    }

    // display second bar
    if (S==0){
        fill(8, 7, 17);
        rect(230,0,60,360);
    } else {
        for(i=0;i<S;i++){
            var r = (0);
            var g = (0);
            var b = (i*(255/59));
            fill(r,g,b);
            rect(230,i*(300/59),60,60);
        }
    }

    // display milli/second bar
    if (S==1 || S ==3 || S==5 || S ==7 || S==9 || S ==11 || S==13 || S ==15 || S==17 || S ==19 || S==21 || S ==23 || S==25 || S ==27 || S==29 || S ==31 || S==33 || S ==35 || S==37 || S ==39 || S==41 || S ==43 || S==45 || S ==47 || S==49 || S ==51 || S==53 || S ==55 || S==57 || S ==59){
        fill(8, 7, 17);
        rect(330,0,60,360);
    } else {
            fill(255);
            rect(330,0,60,360);
        }
    
}

For this project I hoped to visualize clocks in a linear and color way. I wanted to represent the individual component of my clock with different R,G,B values. By using color, in addition to slight position cues, the goal was to create another more abstract method of keeping track of the time of the day. I developed the idea by trying to think of other ways that people visualized things. Naturally, color was something that was at the precipice of my mind. Overall, I think I learned a good amount about pulling various information from the world into my code. I imagine additional applications to be things such as pulling weather data or humidity data.

Jason Zhu-LookingOutwards-06


This is an image of Tyler Hobbs work, Community 5, created with various algorithms.

http://www.tylerlhobbs.com/writings/probability-distributions-for-artists. Created in 2014 by Tyler Hobbs.

Community 5 is an artwork derived from various algorithmic work. In this case, the artist, Tyler Hobbs, used pseudo-Pareto distribution to vary the length of width of polygons used in the piece. He does this quite successfully in my opinion as it neither seems overly generated or overly humanistic; achieving the right balance of algorithmic work and human effort. The Pareto distribution is a form of power law distribution and is useful in situations where one wants to create balanced objects of various sizes. Other applications of the Pareto distribution include in Hobbs words “the population of cities (many small cities, few very large cities) and the wealth of individuals (many poor indiviuals, few very rich).”

Nina Yoo Project-06-Abstract Clock

sketch

/* Nina Lee Yoo
Section E
nyoo@andrew.cmu.edu
Project-06-Abstract Clock*/

var prevSec;
var millisRolloverTime;
var change = 10

//--------------------------
function setup() {
    createCanvas(300, 300);
    millisRolloverTime = 0;
}

//--------------------------
function draw() {
    background(255,200,200); // My favorite pink
    
    // Fetch the current time
    var H = hour();
    var M = minute();
    var S = second();
    
    // Reckon the current millisecond, 
    // particularly if the second has rolled over.
    // Note that this is more correct than using millis()%1000;
    if (prevSec != S) {
        millisRolloverTime = millis();
    }
    prevSec = S;
    var mils = floor(millis() - millisRolloverTime);
    
    
    var hourBarWidth   = map(H, 0, 23, 0, width);
    var minuteBarWidth = map(M, 0, 59, 0, width);
    var secondBarWidth = map(S, 0, 59, 0, 178);


    // the sun is radiating
        noStroke()
        fill(255,205,109)
        ellipse(0,0,mils,mils)

     //sun grows at every hour
      noStroke()
        fill(237,242,109)
        ellipse(0,0,hourBarWidth,hourBarWidth)

        
	 //for the puddle growing every minute
        noStroke();
		fill(108,158,234);
        ellipse(150,200,minuteBarWidth,20);
    

     //for raindrop falling at a rate of a second
        noStroke();
        fill(255);
        triangle(140,secondBarWidth-5,160,secondBarWidth-5,150,secondBarWidth-20);
        fill(255);
        ellipse(150,secondBarWidth,22,22);


}


    /*noStroke();
    fill(40);
    ellipse(0, 100, hourBarWidth, 50);
    fill(80);
    ellipse(0, 150, minuteBarWidth, 50);
    fill(120)
    ellipse(0, 200, secondBarWidthChunky, 50);
    fill(160)
    ellipse(0, 250, secondBarWidthSmooth, 50);*/

I wanted to make a raindrop to fall into a puddle because rain is something that has a rythm to it so it reminded me of time. From there on I just added more elements to it pertaining to weather by making the puddles minutes, the drops seconds, the sun the hour, and the radiating part of the sun milliseconds. It was fun doing this project and playing around with the limits in order to create different images.

Elena Deng-Project 6 Abstract Clock

sketch

/*Elena Deng
Section E
  edeng1@andrew.cmu.edu
  Project-06
}
*/

function setup() {
    createCanvas(400, 400);
    // var c=canvas
    // c.rotate(90)
    angleMode (DEGREES);
}

function draw() {

    var H = hour(); //calculates hours
    var M = minute(); //calculates minutes
    var S = second(); //calculates seconds
    var colRatio=2;  //reduces the color gradient each for loop
    noStroke(); //no stroke within the circles

    //does the background
      push();
      translate(200,200); //translates into the middle of the canvas
      background(5,15,53); //sets the background color
      pop();

      //hour hand
      for (var h=0; h<H; h++){
        var r=220; //sets r value
        var g=105; //sets g value
        var b=55; //sets b value
        var colRatio=4; //color value reduces more quickly
          push();
          translate (width/2, height/2);
          rotate((15*h)-.25*360) //24 hour clock
          fill(r+(colRatio*h),g+(colRatio*h),b+(colRatio*h));
          ellipse(35,0,20,20);
          pop();
      }

      //minutes hand
        for(var m =0; m<M; m++){
          var r=250; //sets r value
          var g=175; //sets g value
          var b=65; //sets b value
            push();
            translate (width/2, height/2);
            rotate((6*m)-.25*360); //sets minutes and rotates
            fill(r-(colRatio*m),g-(colRatio*m),b-(colRatio*m));
            ellipse(72,0,15,15);
            pop();
          }


      //seconds hand
        for(var s = 0; s < S; s++) {
        var r=120; //sets r value
        var g=105; //sets g value
        var b=15; //sets b value
        push();
        translate (width/2, height/2); //moves to the middle of canvas
        rotate((6*s)-.25*360); //sets seconds and rotates
        fill(r+(colRatio*s),g+(colRatio*s),b+(colRatio*s)); //sets fill
        ellipse(100,0,10,10);
        pop();
    }


}

This project was pretty fun to do! My favorite part of the result was the color palette as well as the overall effect of the circles. I decided to make it a 24 hour clock so that it can tell the difference between AM and PM.

ideation for Clock (didn’t end up going with these ideas)

Eunice Choe – Project-06 – Abstract Clock

sketch

/* Eunice Choe
Section E
ejchoe@andrew.cmu.edu
Project 06*/

// global variables for wheel position and size
var bigX = 160;
var bigY = 320;
var bigDiam = 200;
var smallX = 370;
var smallDiam = 70;

function setup() {
    createCanvas(480, 480);
}

function draw() {
    background(172, 201, 232);
    angleMode(DEGREES);
    var H = hour();
    var M = minute();
    var S = second();
    var cH = map(H, 0, 23, 50, width - 50);
    // sidewalk
    noStroke();
    fill(171, 184, 182);
    rect(0, 320, width, 320);
    // changing sun position depending on the hour
    // changing from sun to moon depending on time
    // 7AM to 7PM shows sun while 7PM to 7AM shows moon
    if(H < 19 & H > 7){
        noStroke();
        fill(237, 232, 73);
    } else {
        fill(88, 92, 94);
    }
    ellipse(cH, 100, 100, 100);
    // Time text
    strokeWeight(0.5);
    fill(82, 9, 6);
    textAlign(CENTER);
    text("Hour: " + H, cH, 100);
    text("Minute: " + M, smallX, 450);
    text("Second: " + S, bigX, 450);
    // thin red bike part
    strokeWeight(10);
    stroke(82, 9, 6)
    line(bigX + 110, bigY - 110, bigX + 120, bigY - 130);
    // yellow bike parts
    stroke(176, 117, 15);
    line(bigX + 30, bigY - 200, bigX + 35, bigY - 230);
    line(bigX + 35, bigY - 230, bigX, bigY - 250);
    line(bigX, bigY - 250, bigX - 20, bigY - 240);
    ellipse(bigX, bigY - 250, 10, 10);
    // bike seat
    fill(176, 117, 15);
    line(bigX + 90, bigY - 160, bigX + 120, bigY - 150);
    ellipse(bigX + 130, bigY - 150, 20, 15);
    // thick red bike parts
    stroke(82, 9, 6);
    strokeWeight(15);
    line(bigX, bigY, bigX + 30, bigY - 200);
    line(bigX + 30, bigY - 160, bigX + 120, bigY - 100);
    line(bigX + 120, bigY - 100, smallX, bigY + bigDiam / 2 - smallDiam / 2);
    // wheels
    noFill();
    strokeWeight(15);
    stroke(255, 250, 202);
    ellipse(bigX, bigY, bigDiam, bigDiam);
    ellipse(smallX, bigY + bigDiam / 2 - smallDiam / 2, smallDiam, smallDiam);
    // the rotating seconds wheel
    for(var s = 0; s < S; s++){
        push();
        translate(bigX, bigY);
        rotate(6 * s); // 60 seconds - 60 spokes
        stroke(255);
        strokeWeight(2);
        line(0, 0, 0, -100);
        pop();
    }
    // the rotating minutes wheel
    for(var m = 0; m < M; m++){
        push();
        translate(smallX, bigY + bigDiam / 2 - smallDiam / 2);
        rotate(6 * m); // 60 minutes - 60 spokes
        stroke(255);
        strokeWeight(1);
        line(0, 0, 0, -35);
        pop();
    }

}

My abstract clock is a bicycle with the big wheel representing seconds, the small wheel represent minutes, and the sun/moon representing the hour. For the second and minute wheels, new spokes appear after every second/minute passes. From 7AM to 7PM, the sun is yellow and from 7PM to 7AM the circle turns gray to represent the moon. In addition, the position of the sun/moon changes depending on what time it is.

I came up with the idea of a bike because of the two circular shapes I could work with to represent minutes and seconds. I had to get a little creative to represent the hours, so I chose to use something in the background. The abstract clock was difficult to figure out at times, but overall I feel better about applying rotation and for loops into my code.


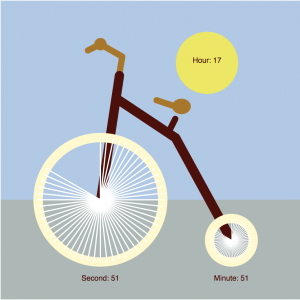
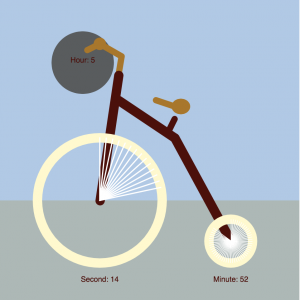
The bike in day time and night time.

Christine Chen-Looking Outwards-06

John Cage, Ryoanji, 1985

Above is the music piece Ryoanji(named the same as the artwork) composed by John Cage in 1985

John Cage was an American composer who is best known for his avant-garde music and his use of randomness in music composition. In addition to composing music, he also uses randomness to create graphic art. For his piece Ryoanji, he had his assistants read computer-generated random numbers off a list. This chooses which rows of rocks to be chosen, which painting brush to be used, and the position of the stone on the paper. The numbers are “truly” random numbers. After this, Cages paints around the stone to trace the outline. In other words, he used computer-generated coordinates which are randomly generated to determine the positions of the graphics in the picture. This piece was created in conjunction with one of his musical piece, which partially composed through randomness, that was named the same title. The is composed of 3375 rock tracings.

What I admire most about this piece is that at first glance, it just seems as if there is nothing special about it. However, after knowing the algorithm that was used to create it, the entire piece seems more interesting. All those lines seem to be random and not random at the same time! Random because the computer chose the numbers through random process and the numbers are entirely dependent on chance. However, at the same time, the piece also seems to be not so random as the values are defined entirely by a machine and drawn according to that. I also enjoy the fact of how it is created to be congruent with the music. Cage’s artistic sensibilities is shown through his choice of only graphite and paper as his medium. The monotone vibe expressed through the piece reflects the serious, heavy experience that the music expresses.

Yingying Yan- Looking Outwards-6

An example of showing pattern within random generation

Coding Architecture: Randomness project is an assignment from Rhode Island School of Design. The project I found interesting is not named, nor is not part of the author’s portfolio anymore. Yet, Daejeong Kim uses algorithms to draw sets of lines in a random but systematic way.

The direction is being controlled

For instance, she used two random number set: A and B and centered at random (A, B) to create a drawing with random lines. Due to the algorithm, the lines together form patterns showing density and directionality. It is also interesting to read the product as a animation and see the changes that are generated by the random numbers. This project caught my attention. Because among all the other project, it uses randomness to result in a non-random form.

random fill converted-superhigh from Coding Architecture on Vimeo.

Jenna Kim (Jeeyoon Kim)- Looking Outwards-6

“PPPP”
He kept developing his original idea (the first photo on the very top).
“PPPP”- more development
His another project called “NNN”

Manolo Gamboa Naon’s project, “PPPP”, is a generative, random digital art had been developed over a long time. Its vibrant colors and interesting geometric forms blend in beautifully. . His project is very admirable because through this project, he shows that making errors is essential to generative artists and errors are “beautiful”. He shows that as he develops more series to this project, he demonstrates growth of his style through series of errors. It is definitely fascinating to see how he develops so many styles and combination of color from one idea. The algorithms and the randomness in the work are generated from Processing, a programming tool that he learned when he started studying design. Although this simple random art seems to be simple with its geometric forms, he manifested his artistic ability in the color palette and the pattern. Although the colors are so bold and striking, the different colors interact well with each other. Also, we can see inspiration from artists and designers such as Ben Fry, Joshua David, Ivan Ivanoff, and many more.

Link: “https://www.artnome.com/news/2018/8/8/generative-art-finds-its-prodigy”

Mimi Jiao – Project 6 – Section E

sketch

/*
Mimi Jiao
wjiao@andrew.cmu.edu
Section E
Project-06
*/

function setup() {
    createCanvas(480, 480, WEBGL);
}

function draw() {
    var H = hour();
    var M = minute();
    var S = second();
    background(0, 0, 255);
    rotateZ(frameCount * .01);

    //in this for loop, as the seconds increase, 
    //the number of "fan" components within this shape increases
    for (var i = 0; i < S * 100; i++) {
        noStroke();
        fill(i * sin(i), i * cos(i), sin(i) * 200);
        beginShape();
        vertex(sin(i) * 1000, cos(i) * 1000, sin(i) * 1000);
        vertex(sin(i) * 1010, cos(i) * 1010, cos(i) * 1010);
        vertex(cos(i), sin(i), sin(i));
        endShape(CLOSE);
    }

    //size of sphere depends on the minute
    push();
    rotateX(frameCount * .005);
    rotateZ(frameCount * .01);
    for (var a = 0; a < M; a++) {
        noFill();
        strokeWeight(.4);
        //stroke color of sphere
        stroke(sin(radians(M)) * 255, sin(radians(M)) * 255, 
               sin(radians(M)) * 255);
        //Scales the size of the sphere for aesthetic purposes
        var mMap = map(M, 0, 60, 10, width);
        ellipsoid(mMap , mMap , mMap );
    }
    pop();

    push();
    //scales the hour by two for aesthetic purpose
    H *= 2;
    //rotates the shapes
    rotateX(frameCount * .05);
    rotateY(frameCount * .01);
    //loop drawing continuous geometric elements
    for (var p = 0; p < H * 50; p ++) {
        //constantly changes color of stroke based on time/sin
        stroke(200 + 25 * sin(millis() / 1000), 
             200 + 25 * sin(millis() / 1000 + HALF_PI),
             200 + 25 * sin(millis() / 1000 - HALF_PI));
        strokeWeight(.5);
        noFill();
        //changing origin so object moves across page
        translate(sin(H) * 24, sin(H) * 24, H);
        //coordinates for drawn geometric shape
        beginShape();
        vertex(p * cos(p) * .1, H * 10 * cos(p), .1 * (p - 1000));
        vertex(p* .01 * .1, p* 0.1 * .1, p*.01 * .1);
        vertex(p * sin(p) * .1, .1 * p * cos(p), 10 * H);
        vertex(p * cos(p + PI) * .1, H * 10 * cos(p + PI), .1 * (p - 1000));
        vertex(p * sin(p + PI) * .1, .1 * p * cos(p + PI), .1 * H);
        endShape(CLOSE);
    }
    pop();
}


I’ve always wanted to play around with WEBGL and seeing Jenny Hu’s clock project pushed me to use it for this assignment. I started out checking out primitive 3D functions like translate, ellipsoid and box to get a better understanding of how it works. I also wanted to explore how to make optical art, so I checked out different math functions in for loops. I played around with trig functions to see how shapes would be affected and also messed around with incorporating the mouseX function into for loops to alter the shape of the shapes I made. After experimenting, I went back into incorporating the ellipsoid to represent time because it was most fitting for my skill level. I initially wanted to do something more complex but I couldn’t quite figure out how to create it using vertex points.

My approach to the abstract clock isn’t very visually intuitive but I wanted to explore mapping time using different math functions in WEBGL.