Christine Chen-Project-07-Curves

Christine Chen-Project-07-Curves

/*
Christine Chen
Section E
cyc1@andrew.cmu.edu
Project-07-Curves
*/

var nPoints = 100;
var eyeSize = 10;
var pupilSize = 5;

function setup() {
    createCanvas(480, 480);
    frameRate(10);
}

function draw(){
    background(189, 232, 252); //blue

    leaves();
    push();
    translate(width/2, height/2);
    drawHeart();
    pop();
    eye();
    blush();
    mouth();
}

function drawHeart(){
    //color
    noStroke();

    //peach turns "ripe" when its big
    if (mouseY > 130){ 
        fill(255, 178, 182); //light pink
    } else {
        fill(192, 222, 188); //light green
    }

    //heart
    beginShape();
    for (var i = 0; i < nPoints; i++) {
        var t = map(i, 0, nPoints, 0, TWO_PI);

        x = 16 * pow(sin(t), 3);
        y = 13 * cos(t) - 5 * cos(2 * t) - 2 * cos(3 * t)
             - cos(4 * t) * mouseX/90;

        mouseX = constrain(mouseX, 80, 70);
        mouseY = constrain(mouseY, 80, 200);

        x = map(x, -1, 15, -1, mouseY);
        y = map(y, -1, 15, -1, mouseY);

        vertex(x, y);
    }
    endShape(CLOSE);
}

function eye(){
    fill(0); //black
    var eyeLX = width/2 - 20 - mouseY/10;
    var eyeRX = width/2 + 20 + mouseY/10;
    ellipse(eyeLX, height/2, eyeSize, eyeSize); //left eye
    ellipse(eyeRX, height/2, eyeSize, eyeSize); //right eye
}

function blush(){
    noStroke();
    fill(229, 51, 60); //red
    var blushLX = width/2 - 20 - mouseY/7;
    var blushRX = width/2 + 20 + mouseY/7;
    ellipse(blushLX, height/2 + 15, eyeSize + 20, eyeSize); //left 
    ellipse(blushRX, height/2 + 15, eyeSize + 20, eyeSize); //right 
}

function mouth(){
    fill(232, 91, 98); //dark pink
    ellipse(240, 260, mouseY/10, mouseY/10);
}

function leaves(){
    noStroke();
    fill(112, 230, 134);

    //bigger leaves
    var leafLX = width/2 - 70;
    var leafRX = width/2 + 70;
    ellipse(leafLX, height/2 + 100, 150, 100); //left 
    ellipse(leafRX, height/2 + 100, 150, 100); //right 

    //smaller shadows on top
    fill(107, 221, 129);
    ellipse(leafLX + 20, height/2 + 90, 110, 80); //left 
    ellipse(leafRX - 20, height/2 + 90, 110, 80); //right 
}


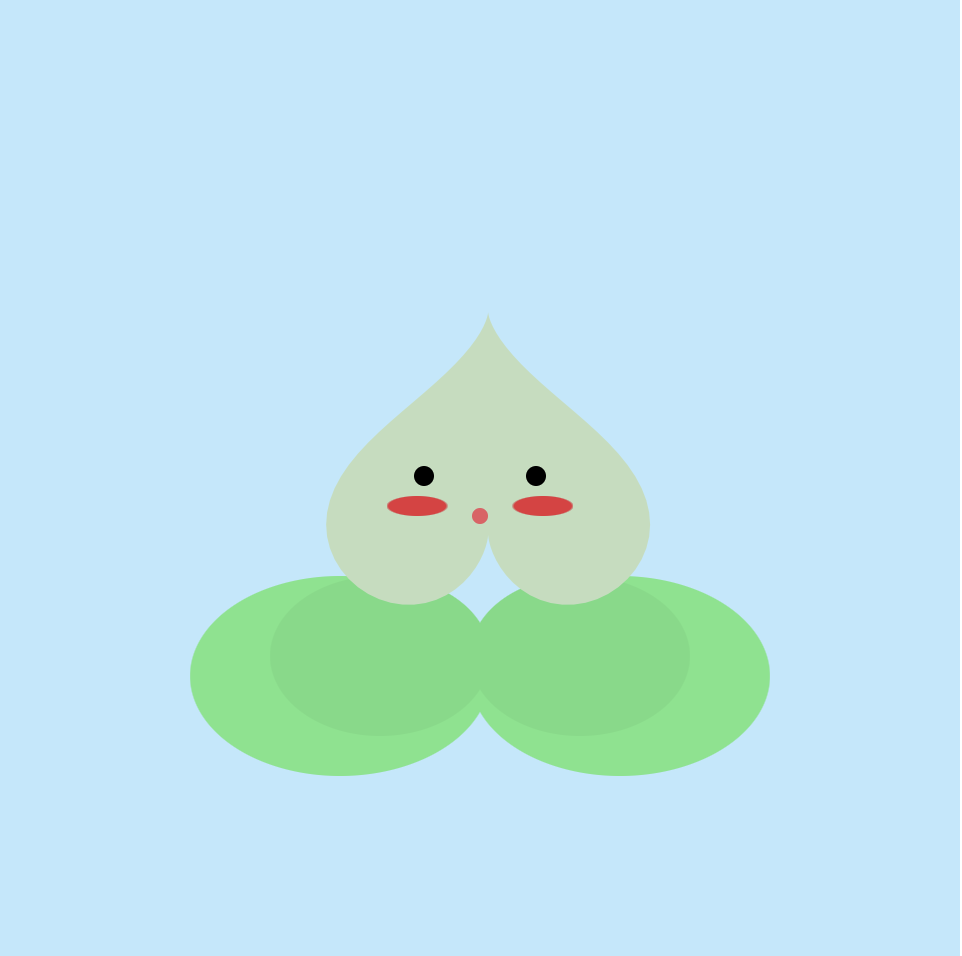
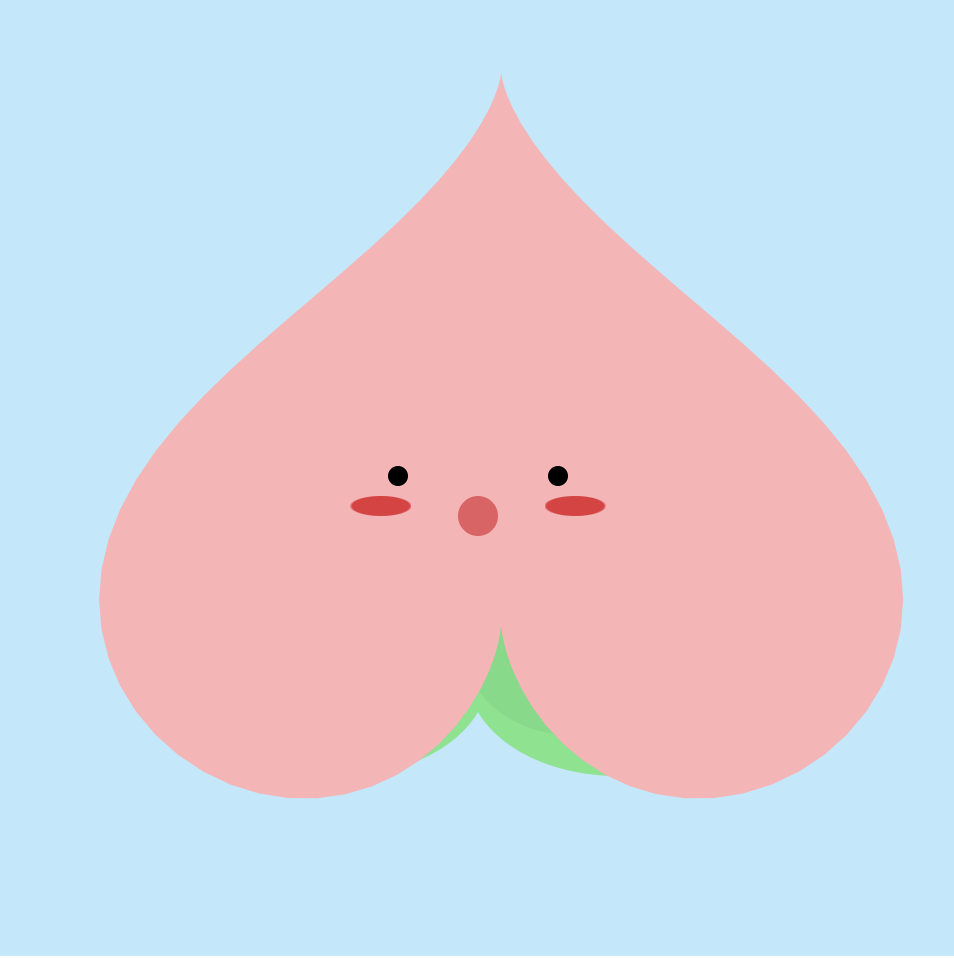
I was initially just playing with the heart curve. Then when I made it pink, the idea of making it into a peach came to my mind. When the peach is small, it is unripe and so it is green. Once it gets big(once mouseY is larger than a particular point) it becomes ripe(pink). I initially wanted to play around with the curve even more, but I realized that doing so would make the shape not a heart, which wouldn’t work with the idea of a peach. Thus, I just play around with making the curves change “rationally”(so it keeps the shapes of a heart) according to the mouse positions.

Unripe State
Ripe state


Vicky Zhou – Project 07 – Curves

sketch

/*Vicky Zhou
Section E
vzhou@andrew.cmu.edu
Project_07_Curves*/

var nPoints = 50; //amount of mapped out points
var EPITROCHOID1 = 0; // parametric form 
var HYPOTROCHOID = 0; //parametric form

function setup() {
    createCanvas(480, 480);
}

function draw() {
	background(15, 15, 25);
	translate(width/2, height/2);
	//draw light blue epitrochoid curve
	drawEPITROCHOID1();
	//draw light pink hypotrochoid curve
	drawHYPOTROCHOID();
	//draw orange circle epitrochoid curve
	drawEPITROCHOID2();
	//draw yellow circle epitrochoid curve
	drawEPITROCHOID3();
}

function drawEPITROCHOID1() {
	push();
	stroke(140, 200, 240);
	strokeWeight(0.75);
	noFill();
	var x; //x pos
	var y; //y pos
	var t = 90; //angle variable
	var b = constrain(mouseX / 100, 0, 10); //outside curve variable
	var h = map(mouseY, 0, mouseY, 30, height/2); //height variable
	beginShape();
	for (var i = 0; i < nPoints; i ++){
		var a = map(i, 0, nPoints, 0, TWO_PI); //inside circle size variable 
		x = (a + b) * cos(t) - h * cos (((a + b) / b) * t); //parametric eq1
		y = (a + b) * sin(t) - h * sin (((a + b) / b) * t); //parametric eq2
		vertex (x + random(0, 2), y + random(0, 2));
	}
	endShape();
	pop();
}

function drawHYPOTROCHOID() {
	push();
	strokeWeight(0.5);
	stroke(190, 140, 140);
	noFill();
	var x; //x pos
	var y; //y pos
	var t = constrain(mouseX / 10, 0, 100); //angle variable
	var b = 5; //outside curve variable
	var h1 = constrain(mouseX/ 2, width/4, width/3); //height variable 1 
	var h2 = constrain(mouseY/2, width/3, width/2); //height variable 2
	beginShape();
	for (var i = 0; i < nPoints; i++){
		var a = map(i, 0, nPoints, 0, TWO_PI); //inside circle size variable
		x = (a - b) * cos(t) + h1 * cos(((a - b)/b) * t);
		y = (a - b) * sin(t) + h2 * sin(((a - b)/b) * t);
		vertex(x, y);
	}
	endShape();
	pop();
}

function drawEPITROCHOID2() {
	push();
	noStroke();
	fill(100, 130, 190);
	var x; //x pos
	var y; //y pos
	var t = 100; //angle variable
	var b = constrain(mouseX / 100, 0, 10); //outside curve variable
	var h = constrain(mouseX/2, 0, 100); //height variable
	beginShape();
	for (var i = 0; i < nPoints; i ++){
		var a = map(i, 0, nPoints, 0, TWO_PI); //inside circle size variable 
		x = (a + b) * cos(t) - h * cos (((a + b) / b) * t); //parametric eq1
		y = (a + b) * sin(t) - h * sin (((a + b) / b) * t); //parametric eq2
		ellipse(x + random(-1, 1), y + random(-1, 1), 5, 5);
	}
	endShape();
	pop();
}

function drawEPITROCHOID3() {
	push();
	stroke(160, 140, 110);
	strokeWeight(0.3);
	noFill();
	var x; //x pos
	var y; //y pos
	var t = 190; //angle variable
	var b = constrain(mouseX, 0, 5); //outside curve variable
	var h = map(mouseY, 0, mouseY, 30, height/2); //height variable
	beginShape();
	for (var i = 0; i < nPoints; i ++){
		var a = map(i, 0, nPoints, 0, TWO_PI); //inside circle size variable 
		x = (a + b) * cos(t) - h * cos (((a + b) / b) * t); //parametric eq1
		y = (a + b) * sin(t) - h * sin (((a + b) / b) * t); //parametric eq2
		vertex(x + random(-5, 5), y + random(-3, 3));
	}
	endShape();
	pop();
}

This project was incredibly satisfying to make! Although it was a bit of a struggle at first to understand what each variable manipulated in the curve, plugging in random values and seeing what was affected was helpful and how I learned how to manipulate my curves into the desired look. I added a bit of “jitter” effect to my curves as well because I enjoy how they make the piece feel like it is constantly interactive even when the user is not altering the curves. For future iterations and/or ideas I think it would be interesting to incorporate equations that are not necessarily parametric, explicit, and/or polar.

Example 1
Example 2
Example 3
Example 4

Eunice Choe – Looking Outwards – 07

This chart represents the seasonal trends of the search term “apricot”. This representation highlights the the patterns.

These charts represent the charts for different fruits.

The Rhythm of Food, by Moritz Stefaner (2015) is a data visualization project that displays patterns of food seasonality based on Google search data over a span of twelve years. This project interested me because it visualizes a set of extensive data in a visually pleasing way through a radial pattern. While this representation is abstract, you can still see the patterns and peaks of food seasonality. The designer developed an algorithm that creates a radial “year clock” that represents food trends. The algorithm is set up so that the distance from the center represents relative search interest, the segments represent search interest in the weeks within the past 12 years, and the color represents the year. The creator implements his artistic sensibilities through color and rhythm. The way the trends are represented radially makes the project seem like a beautiful piece of art at first glance when it actually reflects real life data.

Looking Outwards 07: Jaclyn Saik

Nicholas Felton is one of my new favorite designers. He is a trailblazer in the field of digital data visualisation, and I am especially interested in his story because he came from traditional graphic design and moved on to creating algorithms that collect data after he realized how much he enjoyed representing it through graphics. I have always been interested in editorial design specifically because a lot of times, it involved an interesting combination of powerful aesthetics and thought-out information representation, and it’s hyper focused on making the reader understand what it’s trying to communicate. Felton does this with his in a lot of his work, and especially in the project Daytum.

A screenshot example of the home panel for Felton’s own account, where his personal statistics are graphed elegantly in front of him.
The landing page for the website, which shares data from users around the world as an example of the programs capabilities.

Daytum is a platform an app that collects personal statistics from the user and elegantly communicates them in different ways. The spreadsheets and visuals it produces are created in the spirit of Felton’s famous Annual Reports. Based on the interface and the type of information this app tracks, I’m thinking that it is created with code that takes certain data sets (and has to have different versions or be flexible to different types of data) and then puts them through a program that organizes the data points in relationship to each other and plots/prints them in different formats. What I find interesting, as a communications designer who is currently studying typography, is that the program probably has to account for formatting errors and irregularities that come with differing data: longer words that change the word spacing, numbers that contain decimals or are greater/less than zero, and orphaned words and other paragraph issues. I think what makes this program so elegant is Felton’s eye for clean design, so that these personal data points are plotted neatly and elegantly no matter what they are.

This project was released in 2008. I know there are a lot of similar and far more developed apps out there now, but this is on the first times an iPhone app took on this form, and I think thats important.

Jenna Kim (Jeeyoon Kim)- Project 7- Wallpaper

jeeyoonk07

/* Jenna Kim (Jeeyoon Kim)
Section E
jeeyoonk@andrew.cmu.edu
Project 7
*/

var nPoints = 360

function setup() {
    createCanvas(500, 500);
    
}

function draw() {
	//drawing curve
	background(130, 20, 40);
	push();
	translate(width / 2, height / 2);
	drawAstroidCurve();
	pop(); 

	fill(255, 100);
	textSize (30);
	textFont('Roboto');

	text("CHAOS", width / 2 - 50, 480);
}

function drawAstroidCurve() { //
	// Astroid;
	//Link: http://mathworld.wolfram.com/Astroid.html
	var x; 
	var y;
	var xR = constrain(mouseX, 0, 500);
	var ellipseR = map(mouseX, 0, 500, 10, 120);
	var a = map(xR, 0, 500, 40, 30);
	var b = map(xR, 0, 500, 50, 300);
	var h = constrain(mouseY, 0, 400);


	stroke(255);
	strokeWeight(0.5);

	//chaotic ASTROID CURVE
	beginShape();
	fill(130, 20, 40);
	for (var i = 0; i < nPoints; i++) {
		x = (4 * a * cos(i)) + (b * cos(3 * h * i));
	    y = (2 * a * sin(i)) - (b * sin(3 * h * i));
        vertex(x, y);
	};
	endShape(CLOSE);

	noStroke();
	fill(255);
	ellipse(3, 5, ellipseR, 50);
}

For this project, I wanted curves that combine to create a chaotic feeling. The ellipse in the middle is supposed to represent a ball of string, and make the whole canvas look like the string is “unraveling” from the ball of string (the ellipse in the middle). I used an Astroid curve from the MathWorld site to reference the function. At first, I was confused on how to utilize map(); and constrain(); to explore different curves and its sizes and limits. However, I eventually understood these concepts through this project. Throughout out the project, I was really amazed on how many variations of curves an asteroid that create although I input certain constraints.

Below are my process work. The top picture shows that I struggled for awhile on how to make the curves show in thin lines. I realized that I had to fill them with background color. The bottom picture is another part of the process. I explored different constrain();.


Project-07: Jaclyn Saik

sketch

/* Jaclyn Saik 
Section E
jsaik@andrew.cmu.edu
Project 07
*/

var maxP = 100; //boundary for points plotted by the curve 
var chang = 1; //variable ised for flipping orientation of fish curve


function setup() {
    createCanvas(480, 480);
    noStroke();   
}

function draw() {
    background("PaleTurquoise");
    textSize(10);
    noStroke();
    fill("LightSeagreen");
    text("click me! yay!", 30, 70);
    text("¡a fish that is math!", 80, 300);
    text("math", 270, 400);
    text("glug....glug", 60, 430);
    text("so interactive!", 350, 30);

    translate(width/2, height/2); //puts axis in center of the canvas 
    if (mouseIsPressed) { //sets if statement that inverses fish curve when mouse is pressed
                chang = -1;
            } else {
                chang = 1;
            }
            print(chang); 
    drawFishie(); //calls fish function 
    drawFishie2();
    drawFishie3(); 
    drawFishie4();
}

function drawFishie() {
        var x; //x value for fish curve parametric equation 
        var y; //y value for fish curve parametric equation 
        var a = constrain(mouseY, 20, 450); //constrains a to value between 20 and 450
        var consT = map(mouseX, 0, width, 1, 5); //maps consT so that mouse X plots a number between 1 and 5
        stroke("peachpuff");
        fill("lightpink");
        
        beginShape();
        for (var i = 0; i < maxP; i++) { //for loop that sets maxiumum points form variable above 
            var t = map(i, 0, maxP, 0, TWO_PI); 

        //fish curve
        //http://mathworld.wolfram.com/FishCurve.html

        x = (a * cos(t)) - ((chang)*((a*(sq(sin(t))))) / 2); //change varibale inverses curve when mouse is pressed
        y = (a* cos(t) * (consT)*sin(t));  //constant manipulates the height of
        // the curve based on mouse x position      
        vertex(x, y);
    }
    endShape(CLOSE);
}

function drawFishie2() { //outline, which is slightly off
        var x; //x value for fish curve parametric equation 
        var y; //y value for fish curve parametric equation 
        var a = constrain(mouseY, 20, 450); //constrains a to value between 20 and 450
        var consT = map(mouseX, 0, width, 1, 10); //maps consT so that mouse X plots a number between 1 and 5
        stroke("tomato");
        strokeWeight(2);
        noFill();
        
        beginShape();
        for (var i = 0; i < maxP; i++) { //for loop that sets maxiumum points form variable above 
            var t = map(i, 0, maxP, 0, TWO_PI); 

        //fish curve
        //http://mathworld.wolfram.com/FishCurve.html

        x = (a * cos(t)) - (.5*(chang)*((a*(sq(sin(t))))) / 2); //change varibale inverses curve when mouse is pressed
        y = (a* cos(t) * (consT)*sin(t));  //constant manipulates the height of
        // the curve based on mouse x position      
        vertex(x, y);
    }
    endShape(CLOSE);
}

function drawFishie3() { //outline, which is slightly off
        var x; //x value for fish curve parametric equation 
        var y; //y value for fish curve parametric equation 
        var a = constrain(mouseY, 20, 400); //constrains a to value between 20 and 450
        var consT = map(mouseX, 0, width, 0, 5); //maps consT so that mouse X plots a number between 1 and 5
        stroke("salmon");
        strokeWeight(8);
        noFill();
        
        beginShape();
        for (var i = 0; i < maxP; i++) { //for loop that sets maxiumum points form variable above 
            var t = map(i, 0, maxP, 0, TWO_PI); 

        //fish curve
        //http://mathworld.wolfram.com/FishCurve.html

        x = (a * cos(t)) - (.5*(chang)*((a*(sq(sin(t))))) / 2); //change varibale inverses curve when mouse is pressed
        y = (a* cos(t) * 7*(consT)*sin(t));  //constant manipulates the height of
        // the curve based on mouse x position      
        vertex(x, y);
    }
    endShape(CLOSE);
}

function drawFishie4() { //outline, which is slightly off
        var x; //x value for fish curve parametric equation 
        var y; //y value for fish curve parametric equation 
        var a = constrain(mouseY, 20, 450); //constrains a to value between 20 and 450
        var consT = map(mouseX, 0, width, 0, 6); //maps consT so that mouse X plots a number between 1 and 5
        stroke("orange");
        strokeWeight(5);
        noFill();
        
        beginShape();
        for (var i = 0; i < maxP; i++) { //for loop that sets maxiumum points form variable above 
            var t = map(i, 0, maxP, 0, TWO_PI); 

        //fish curve
        //http://mathworld.wolfram.com/FishCurve.html

        x = (a * cos(t)) - (.7*(chang)*((a*(sq(sin(t))))) / 2); //change varibale inverses curve when mouse is pressed
        y = (a* cos(t) * 10*(consT)*sin(t));  //constant manipulates the height of
        // the curve based on mouse x position      
        vertex(x, y);
    }
    endShape(CLOSE);
}

Fish Curve!
For this project, I had to experiment a lot with figuring out a way to build a shape that relied on the equations I gave it. I hadn’t really thought about it before, but we have been creating equations for the for loops we’ve been generating these past 2 weeks, so once I wrapped my head around this concept, I was able to understand how to plug these equations in and turn them into code. I originally played around with a cruciform curve (which I forgot to screenshot!), but after figuring out the fish curve, I wasn’t as inspired by it’s shape. The fish curve, by the way, is a curve that is based off an ellipse’s equation, with a pedal point at a specific point of eccentricity e^2 = 1/2. I had fun manipulating the variables on my various curves so that the different fish outlines took on slightly different characteristics, and adding interactions (click on screen!).


My first fish I created (after experimenting with a couple other types of curves, which I forgot to document. At first, I wanted to make the fish tiny like an actual fish, but I decided something that grew with the mouse was more exciting.

Mimi Jiao – Project 7 – Section E

click + drag/click to explore

/* 
Mimi Jiao
wjiao@andrew.cmu.edu
Section E
Project 7
*/

var mousepress; //boolean for switching states in mousePressed()
var r = 255; //initial color variable
var power = 33; //exponent for astroid functions
var scaleFactor = 1; //scaling elements variable
var increaseScale = .01; //variable for if statement in altering scale

function setup() {
    createCanvas(480, 480, WEBGL);
    background(0, 0, 255);
}

function draw() {
    background(0, 0, 0);
    strokeWeight(random(.4,.6)); //random strokeweight for jitter effect
    stroke(0, 0, 255);

    //drawing the rainbow background
    push();
    translate(0, 0, -100);
    drawBG();
    pop();

    //drag mouse to rotate astroids around X and Y axis
    if (mouseIsPressed) {
        rotateX(mouseX * .01);
        rotateY(mouseY * .013);
    }
    //rotate astroids 
    rotateZ(frameCount * .02);
    rotateX(frameCount * .001);
    rotateY(frameCount * .01);
    stroke(0, 0, 255);
    ellipsoid(25, 25, 25); //center ellipsoid
    stroke(0, 255, 0);
    scale(scaleFactor); //scaling the astroids

    //constantly scales up and scales down the astroids
    if (scaleFactor < 5 & scaleFactor >= 1) {
        scaleFactor += increaseScale;
    }else if (scaleFactor >= 5) {
        increaseScale = -increaseScale;
        scaleFactor += increaseScale;
    }else if (scaleFactor === .99) {
        increaseScale = -increaseScale;
        scaleFactor = 1;
    }

    //drawing the astroids & rotating them to form a spike
    drawAstroid();
    push();
    rotateZ(5);
    rotateX(3);
    rotateY(4);
    drawAstroid2();
    pop();
    push();
    rotateZ(3);
    rotateX(4);
    rotateY(5);
    drawAstroid2();
    pop();
    push();
    rotateZ(3);
    rotateX(4);
    rotateY(5);
    drawAstroid();
    pop();
    push();
    rotateZ(4);
    rotateX(3);
    rotateY(5);
    drawAstroid();
    pop();
    push();
    rotateZ(4);
    rotateX(3);
    rotateY(5);
    drawAstroid2();
    pop();
    
}

//first draw astroid function
function drawAstroid() {
    mappedMouseX = map(mouseX, 0, width, 0, 12);
    beginShape();
    noFill();
    for(var i = 0; i <  250 * TWO_PI; i ++) {
        stroke(0 , 255, 0);
        vertex(300 * (cos(i)**power), 
             300 * (sin(i)**power));
        //changes color of astroid based on mouseY
        if (mouseY >= height / 2) {
            stroke(r , 0, 0);
        }
       
    }
    endShape(); 
}

//second draw astroid function (different color)
function drawAstroid2() {
    mappedMouseX = map(mouseX, 0, width, 0, 12);
    beginShape();
    noFill();
    for(var i = 0; i < 250 * TWO_PI; i ++) {
        stroke(-r , 255, r);
        vertex(300 * (cos(i)**power), 
             300 * (sin(i)**power));
       
    }
    endShape();
}

//drawing the rainbow background 
function drawBG() {
    push();
    for (var i = 0; i < 1000; i++) {
        noFill();        
        stroke(i * sin(i) + 455, i * cos(i), sin(i) * width);
        beginShape();
        vertex(sin(i) * 900, cos(i) * 900,
               sin(i)* 900);
        vertex(sin(i) * 850, cos(i) * 850,
               cos(i) * 850);
        vertex(cos(i), sin(i), sin(i));
        endShape(CLOSE);
    }
    pop();

}

//if mouse is pressed, change color of specific astroids
function mousePressed() {
    if (mousepress === true) {
        r = random(20, 255);
    } else {
        r = 255;
    }
    mousepress = !mousepress;
}

I wanted to continue along the same path as I did for my project last week by using WEBGL again. This time, I really wanted to create a more 3D object that didn’t only exist on one plane, so I tried to play around with rotating the X, Y, and Z axis for the astroids. For this project, I utilized the mousePressed function and mouseIsPressed to play around with interaction. Here are some of my previous explorations below.


Rachel Lee Project 07 Section E

sketch

/* Rachel Lee
Section E
rwlee@andrew.cmu.edu
Project 07: Curves */

function setup() {
    createCanvas(500, 500);
}

function draw() {
    background(150, 200, 170);
    strokeWeight(1);
    fill(255);
	drawHypothrochoid();
}

function drawHypothrochoid() {
	// radius of circle a changes with mouseX within bounds
	var a = constrain(mouseX, 0, width / 3.5); 
	// radius of circle b
	var b = 10; 
	// distance from center of interior circle changes with mouseY
	var h = map(mouseY, 0, height / 5, height / 2, height / 4); 

    // t considers all values in a circle (360 degrees)
    for (var t = 0; t < 360; t ++) { 
    	// hypotrochoid equations affecting x and y (parametric equations)
        var x = width / 2 + (a - b) * cos(radians(t)) + h * cos(((a - b) / b)) * (radians(t)); 
        var y = height / 2 + (a - b) * sin(radians(t)) - h * sin(((a - b) / b) * (radians(t))); 
        // drawing hypothrochoid inspired ellipse
        ellipse(x, y, 5, 5);
    }

    // color of elements change depending on mouseY position
    if (mouseY <= height / 2) {
        stroke(247, 138, 100);
    } else if (mouseY > height / 2) {
    	stroke(170, 160, 200);
    }
}

For this project, I was inspired by the curves of the Hypotrochoid. I really enjoyed the curves that were being created in by the two simultaneous circles operating at once, and decided to add interaction to alter the tightness of the coils and play around with three dimensionality in space. While this project was initially challenging, I found it really fun to see what kind of results the curve would program.

Example of tighter coiled curve
Example of looser coiled curve

Eliza Pratt – Looking Outwards 07

A breakdown of one of Refik Anadol’s data paintings, “Wind of Boston”, shows how wind pattern data is visualized through abstract art.

Refik Anadol is a Turkish media artist who specializes in “parametric data sculptures.” As demonstrated in his computational paintings, “Wind of Boston,” Anadol uses Processing.js to visualize site-specific data in the form of abstract art and installation. In this specific project, he analyzed the wind patterns around Boston by collecting data from the Boston Logan Airport. By taking factors like wind direction, speed, temperature, and noise fields into account, Anadol created a set of moving, coded displays to reflect these numbers. In his own words, he was motivated to find a “poetic way” to visualize the invisible. I admire this type of work as it finds a method of displaying data that is primarily expressive rather than informative. By embodying large quantities of ever-changing data in the form of an abstract painting, the audience is able to connect with the feeling of the wind patterns rather than the numbers behind it. 

Jenny Hu — Looking Outwards 07

*the above video is the composed music alongside the data-visualization piece. (captioning not available)

Bruises— The Data that we don’t see, is a piece by Giorgia Lupi and Kaki King that uses Data Visualization to ask the following question:

“can a data visualization evoke empathy and activate us also at an emotional level, and not only at a cognitive one? Can looking at a data visualization make you feel part of a story of a human’s life?

What I love about this piece, is that the designers are not just asking how data is scientific and computational, but also sensorial. This piece, in particular, takes in information about a child’s clinical records and her emotional experience as her body changes.

a complete key to the visual piece
The full visual image

To read more about the piece, please read their medium article.