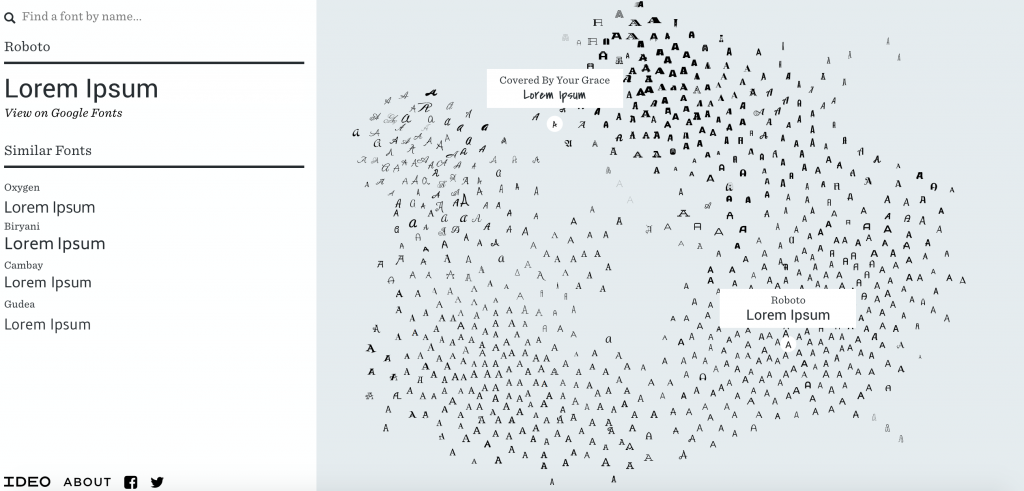
This is a data visualization made by IDEO for mapping a wide variety of fonts. It’s really interesting to see a spectrum of typography laid out in front of you. From calligraphic and more abstract letters to more orderly and well recognized stuff like Roboto or Helvetica, I can imagine this being somewhat useful in helping designers or people working with type to visually see what kinds of fonts they can use. Whats also interesting to note is that the designers at IDEO used an AI that is trained on all kinds of fonts and used it to categorize them in this visualization. While it might be hard for humans to define something mundane like a letter “A”, an artificial intelligence can come up with its own definitions and generate an easy to understand visual for us.
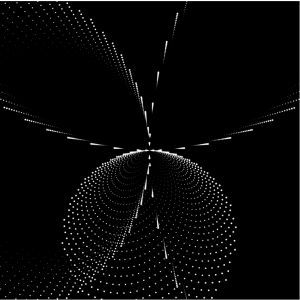
I tried using Vivani spacial curve for this project. I was curious how a 3D function would appear on a 2D surface. It was definitely an interesting exploration, but was also difficult to play with. I wanted to make the visualization look as if the circles are constantly being absorbed into the void, but couldn’t make it happen. Below are some screenshots.
//Danny Cho
//changjuc@andrew.cmu.edu
//Section A
//Composition with Curves


var a = 0;

function setup() {
  createCanvas(480, 480);
  frameRate(10);
}

function draw() {
    background(0)
    translate(width / 2, height / 2)
    fill(255);
    a = mouseX;
    vivani();
    vivani();
    vivani();
    vivani();
}

function vivani() {
    var x = 0;
    var y = 0;
    var move = 1;
    strokeWeight(0);
    rotate(PI / 2);
    for (var i = 0; i < mouseY * 3; i++) {
        x = a * (1 + cos(i * 10));
        y = a * sin(i * 10);
        circle(x, y, i / 500)
        a += 0.1;
    }
}
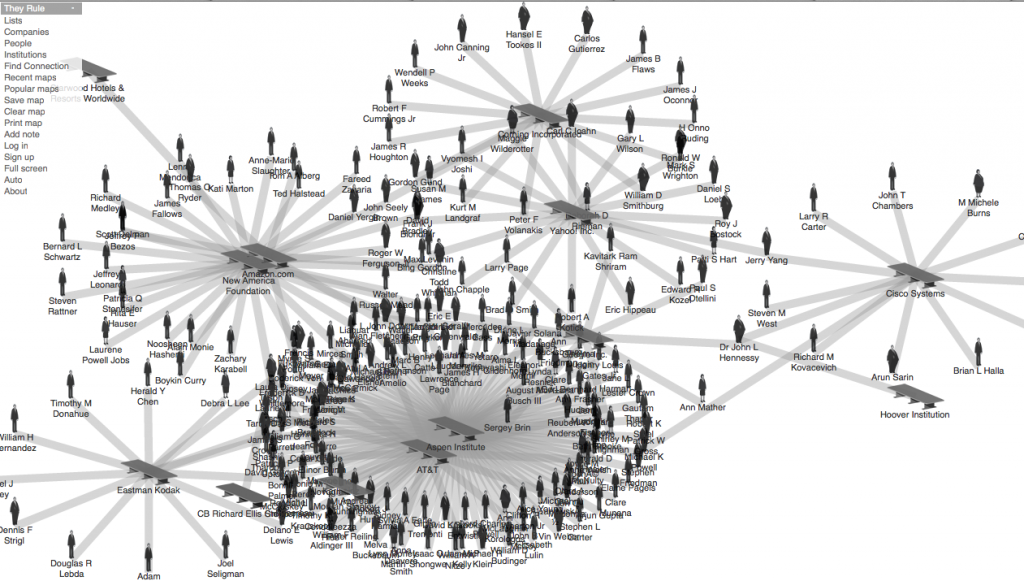
They Rule is a data visualization site where you are able to browse and identify the relationships of the US ruling class. It shows you the boards of the most powerful U.S. corporate companies, such as Google, Yahoo, and Amazon. If you click one of the board members in one of the companies, it will show the connections the individual has to different companies that he/she is involved in. Through the process, the data visualization expands from one to multiple connections of people and companies. It shows you how everything is connected to one another. This information design shows the structure of large corporations and distribution of power in U.S economy.
//Jasmine Lee
//jasmine4@andrew.cmu.edu
//Section C
//Project-07 (Composition with Curves)

var points = 100; //helps control length of curves
var turn = 0; //controls speed of rotation

function setup() {
    createCanvas(480, 480);
}

function draw() {
    background(20, mouseX / 3, 20);

    //"normal" speed curves
    push();
    translate(width / 2, height / 2);
    rotate(radians(turn));
    turn ++;
    drawEpi();
    drawEpi2();
    drawEpi3();
    pop();

    //slowest set of curves
    push();
    translate(width / 2, height / 2);
    rotate(radians(turn / 2));
    turn ++;
    drawEpi();
    drawEpi2();
    drawEpi3();
    pop();

    //fastest spinning set of curves
    push();
    translate(width / 2, height / 2);
    rotate(radians(turn * 2));
    turn ++;
    drawEpi();
    drawEpi2();
    drawEpi3();
    pop();

    //faster spinning set of curves
    push();
    translate(width / 2, height / 2);
    rotate(radians(turn * 1.5));
    turn ++;
    drawEpi();
    drawEpi2();
    drawEpi3();
    pop();

    //creates center of flower
    noStroke();
    fill(255, 255, 255, 50);
    ellipse(width / 2, height / 2, mouseX / 2.5, mouseX / 2.5);
    fill(255, 255, 255, 50);
    ellipse(width / 2, height / 2, mouseX / 4, mouseX / 4);
    fill(255, 255, 255, 50);
    ellipse(width / 2, height / 2, mouseX / 5, mouseX / 5);

}

//draws the smaller epicycloid curve
function drawEpi() {
    var a = map(mouseX, 0, width, 10, 100);
    var b = a / 2;

    //curves
    strokeWeight(3);
    stroke(mouseX / 2, 30, mouseY / 2);
    noFill();
    beginShape();
    for (var i = 0; i < points; i ++) {
        var t = map(i, 0, 50, 0, TWO_PI);
        crvX = ((a + b) * cos(t)) - (b * cos(((a + b) / b) * t))
        crvY = ((a + b) * sin(t)) - (b * sin(((a + b) / b) * t))
        curveVertex(crvX, crvY);
    }
    endShape();
}

//draws the medium epicycloid shape (filled-in)
function drawEpi2() {
    var a = map(mouseX, 0, width, 10, 300);
    var b = a / 2;

    //curves
    fill(mouseY / 2, 50, mouseX / 2, 100);
    beginShape();
    for (var i = 0; i < points; i ++) {
        var t = map(i, 0, 50, 0, TWO_PI);
        crvX = ((a + b) * cos(t)) - (b * cos(((a + b) / b) * t))
        crvY = ((a + b) * sin(t)) - (b * sin(((a + b) / b) * t))
        curveVertex(crvX, crvY);
    }
    endShape();
}

//draws the biggest epicycloid curves
function drawEpi3() {
    var a = map(mouseX, 0, width, 60, 400);
    var b = a / 2;

    //curves
    stroke(mouseY / 2, 60, mouseX / 2);
    noFill();
    beginShape();
    for (var i = 0; i < points; i ++) {
        var t = map(i, 0, 50, 0, TWO_PI);
        crvX = ((a + b) * cos(t)) - (b * cos(((a + b) / b) * t))
        crvY = ((a + b) * sin(t)) - (b * sin(((a + b) / b) * t))
        curveVertex(crvX, crvY);
    }
    endShape();
}
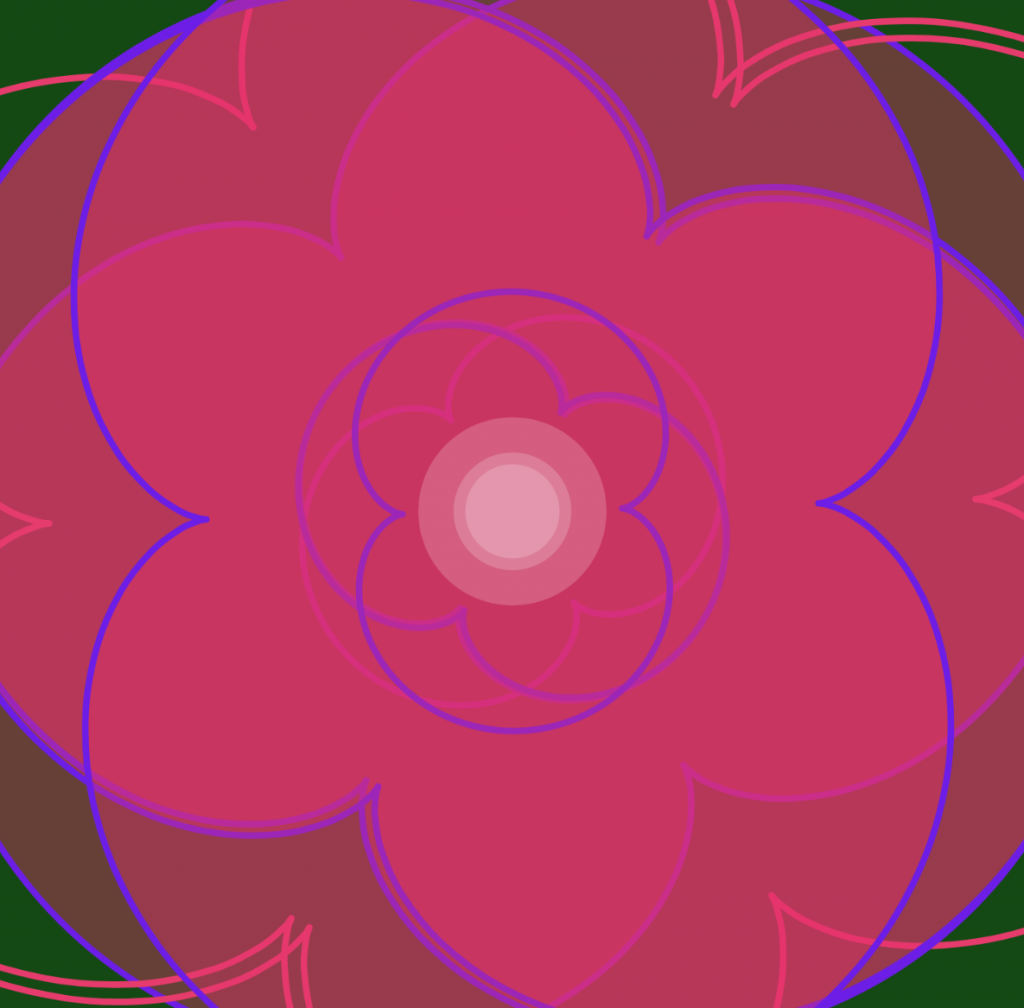
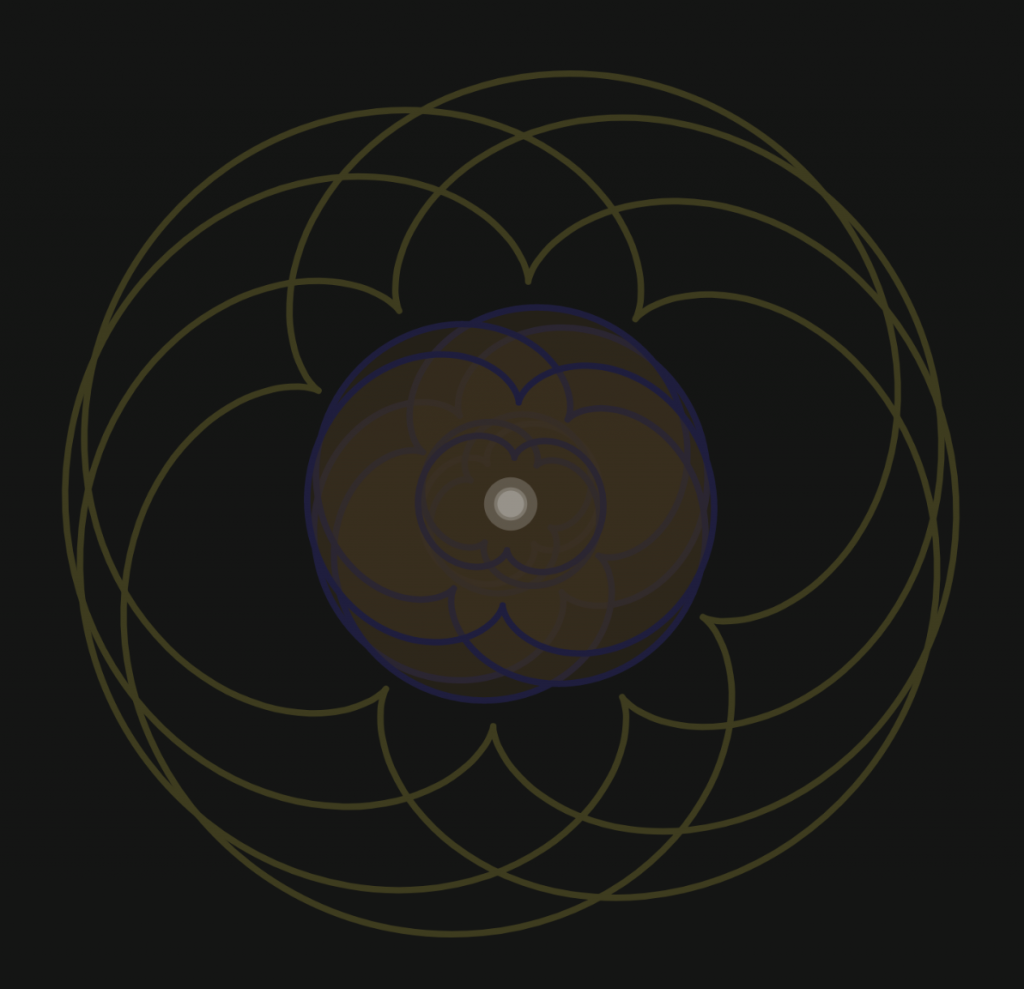
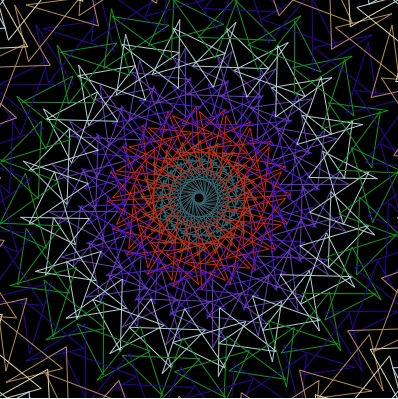
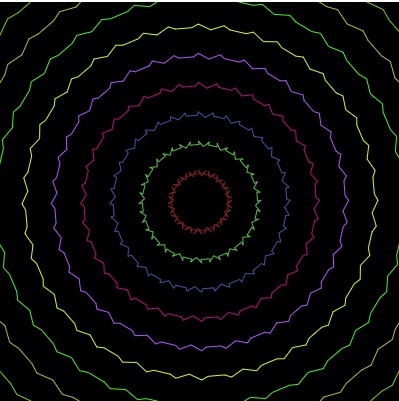
The trickiest part of doing this project was figuring how to create the curves using the mathematical formulas. I had to carefully study the formula to understand it. For this project, I was inspired by the Camellia flowers, which has petals that look as if they’re rotating around the center. It was interesting to be able to see the different curves and colors generated by the movement of the mouse.
The flower is bigger when mouseX is greater (towards the right side of the screen).The colors get darker and more muted as the cursor approaches the top-left corner of the screen.The flower as it appears when the cursor is near the center of the canvas.
For this art project, Jonathan’s initial idea was to make a project that incorporates ideas of ancient language. He thought that since drawings and photographies would be presented wordlessly, therefore viewers would be free to integrate their own interpretations.
Moreover, Jonathan felt that the Internet has become a cacophony, where its promise of informational omniscience no longer feels plausible and desirable. Since he has always fascinated by the concept of “oracles” in shaping human thoughts. He referenced some of the ancient work in different countries — augury (in ancient Rome), the I Ching (in China), the Tarot (in Europe), and Rorschach tests (in western psychology). Jonathan wants to create ambiguity in the rational mind in order to unlock views subconscious, stimulating their own insights to arise.
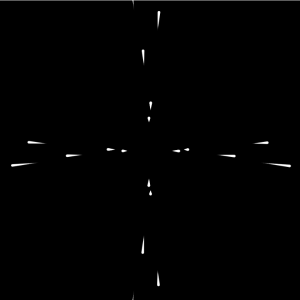
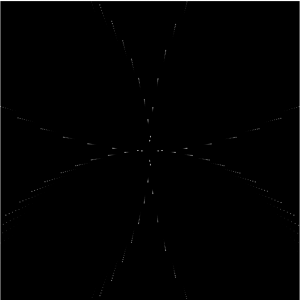
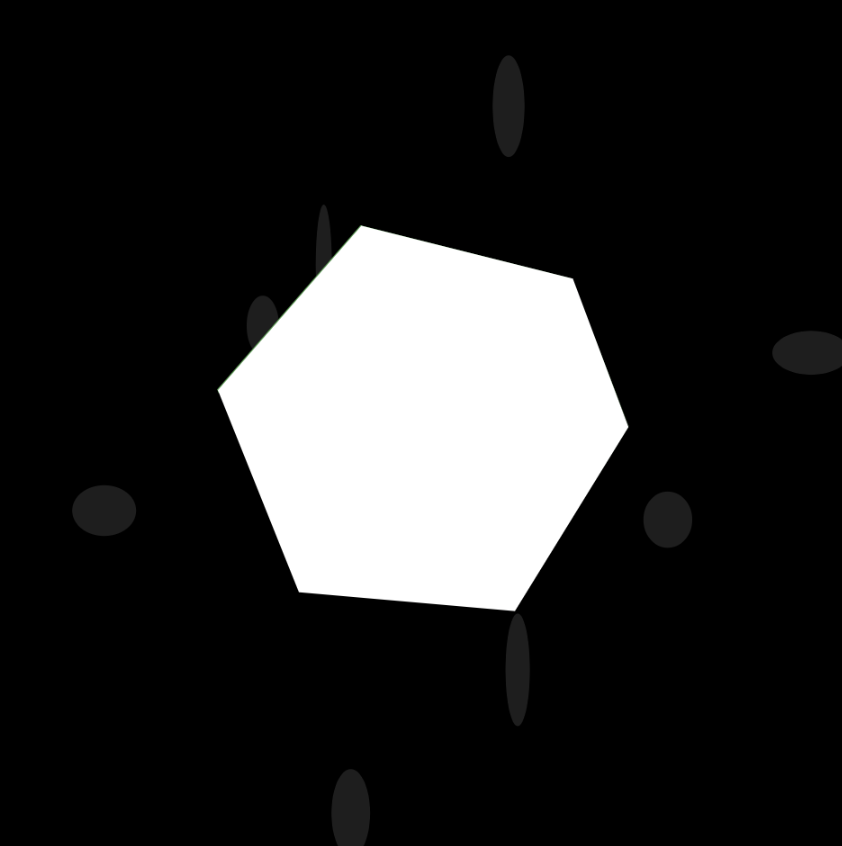
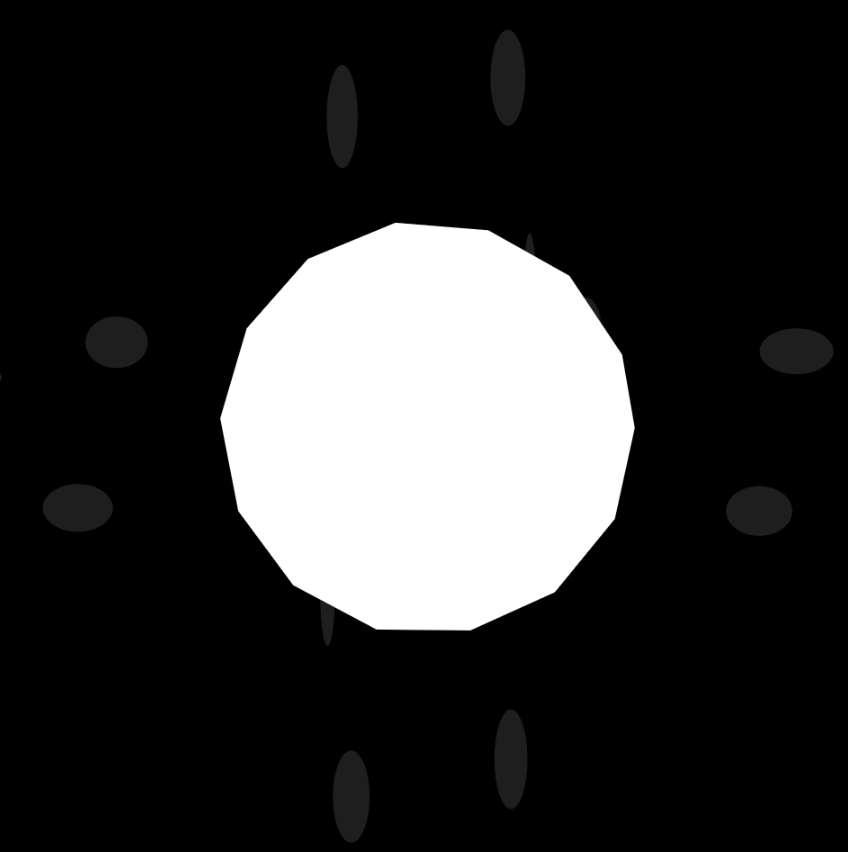
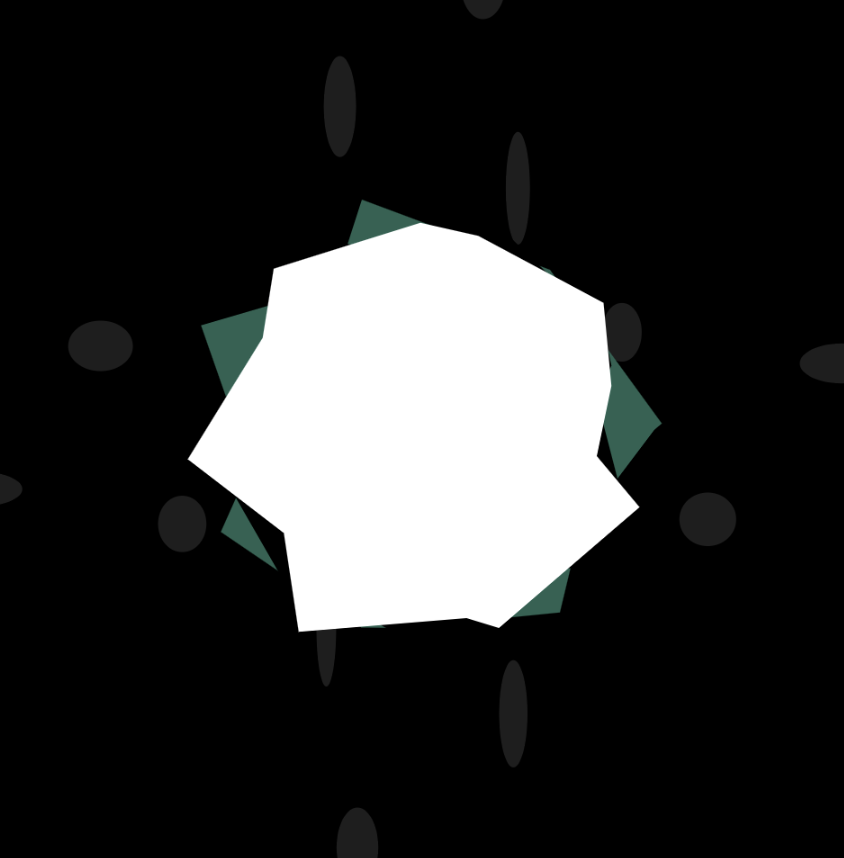
These are different variations of the epitrochoid function. The number of points increases as mouseX increases, so as the mouse drags across from left to right the shape ‘unfolds’ from a line to a triangle to a polygon with several sides. As mouseY increases, this polygon into a more irregular shape dictated by the epitrochoid function. There are three of these shapes, each filled differently (white, black, random color) and with slight variations so that they don’t overlap perfectly. The background circles increase as theta/t/mouseX increases.
/*
Ellan Suder
15104 1 D
esuder@andrew.cmu.edu
Project-07
*/

var randomColor;
var noiset = 0;
var nPoints = 10;

function setup() {
  createCanvas(480, 480);
  noStroke();
}

function draw() {
    noiset+=0.01;
    randomColor = color(noise(noiset+ 180)*205,noise(noiset+160)*205,noise(noiset+60)*205);
    background(0);

    push();
    translate(width / 2, height / 2);
    var x;
    var y;
    var nPoints = 2 + mouseX / 40;
    var a = width/5;
    var b = a/5;
    var h = constrain(mouseY/20, 0, b);
    var ph = mouseX / 50.0;

    fill(30);
    for (var i = 0; i < nPoints; i++) {
        var t = map(i, 0, nPoints, 0, TWO_PI);
        var px = 300 * cos(t);
        var py = 350 * sin(t);
        ellipse(px, py/6, px/5, py/10);
        ellipse(py/6, px, px/10, py/5);
    }

    fill(randomColor);
    beginShape();
    for (var i = 0; i < nPoints; i++) {
        var t = map(i, 0, nPoints, 0, TWO_PI);

        x = (a + b) * cos(t) - h * cos(2 * ph + t * (a + b) / b);
        y = (a + b) * sin(t) - h * sin(t * (a + b) / b);
        vertex(x, y);
    }
    endShape(CLOSE);

    fill(0);
        beginShape();
    for (var i = 0; i < nPoints; i++) {
        var t = map(i, 0, nPoints, 0, TWO_PI);

        x = (a + b) * cos(t) - h * cos(t * (a + b) / b);
        y = (a + b) * sin(t) - h * sin(ph + t * (a + b) / b);
        vertex(x, y);
    }
    endShape(CLOSE);

    fill(255);
        beginShape();
    for (var i = 0; i < nPoints; i++) {
        var t = map(i, 0, nPoints, 0, TWO_PI);

        x = (a + b) * cos(t) - h * cos(t * (a + b) / b);
        y = (a + b) * sin(t) - h * sin(2 * ph + t * (a + b) / b);
        vertex(x, y);
    }
    endShape(CLOSE);
    pop();
}
“Flight Patterns” by Aaron Koblin is a computation information visualization composed by a history of air traffic. Data was collected from FAA data, and it was put together and computed via Processing programming. Koblin used Adobe After Effects and Maya to put together this visual. I personally admired the cohesive nature of this visual. While it showed chaos of air traffic, it portrayed a simple, calm, and unified visual. I personally never considered air traffic like the way I thought about road traffic, so it was an interesting outlook for me to see Koblin’s creation. I suppose that the algorithms used were tracking the departure and destination location and creating curves with those points and using a specific color for each one to specify which curve represented which flight. The creator’s artistic sensibilities were manifested in portraying a unity of air traffic with a variety of curves and color.
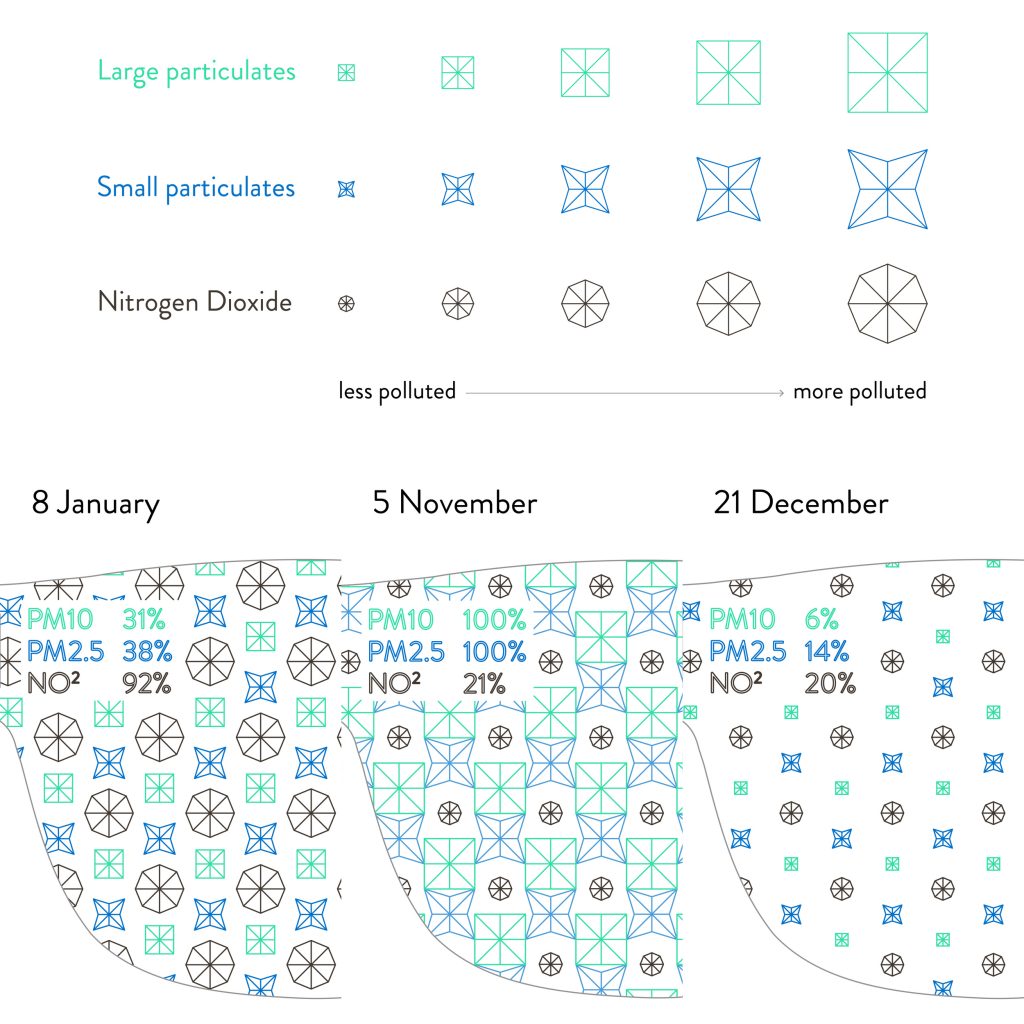
The glasses are the product to visualize the data on air quality. Pattern created through data provided by air quality sensors.
Air Transformed: Better with Data Society Commission is a project by Stefanie Posavec and Miriam Quick in 2015 to use data visualization techniques to communicate air quality. In this looking outwards post, I will be focusing on the aspect of this project called Seeing Air. These are physical acetate glasses that people wear to visualize large particles, small particles, and nitrogen dioxide in Sheffield, UK. These elements were assigned specific icons that are etched onto a layer of the lense. Data is provided through air quality sensors owned by the Sheffield City Council. Stefanie Posavec and Miriam Quick most likely created an algorithm that interprets the data and assigns the scale in which the patterned icons would be set. What I admire is how this data visualization piece is how immersive it is. One can view the designs when not worn but truly experience what it’s like to see out of metaphorical air quality. People may not understand how severe air quality is. Through visualizing this data, people can see the world through a lens that makes people aware of the importance of taking action on climate change.
![[OLD FALL 2019] 15-104 • Introduction to Computing for Creative Practice](../../../../wp-content/uploads/2020/08/stop-banner.png)