Project-07-Curves

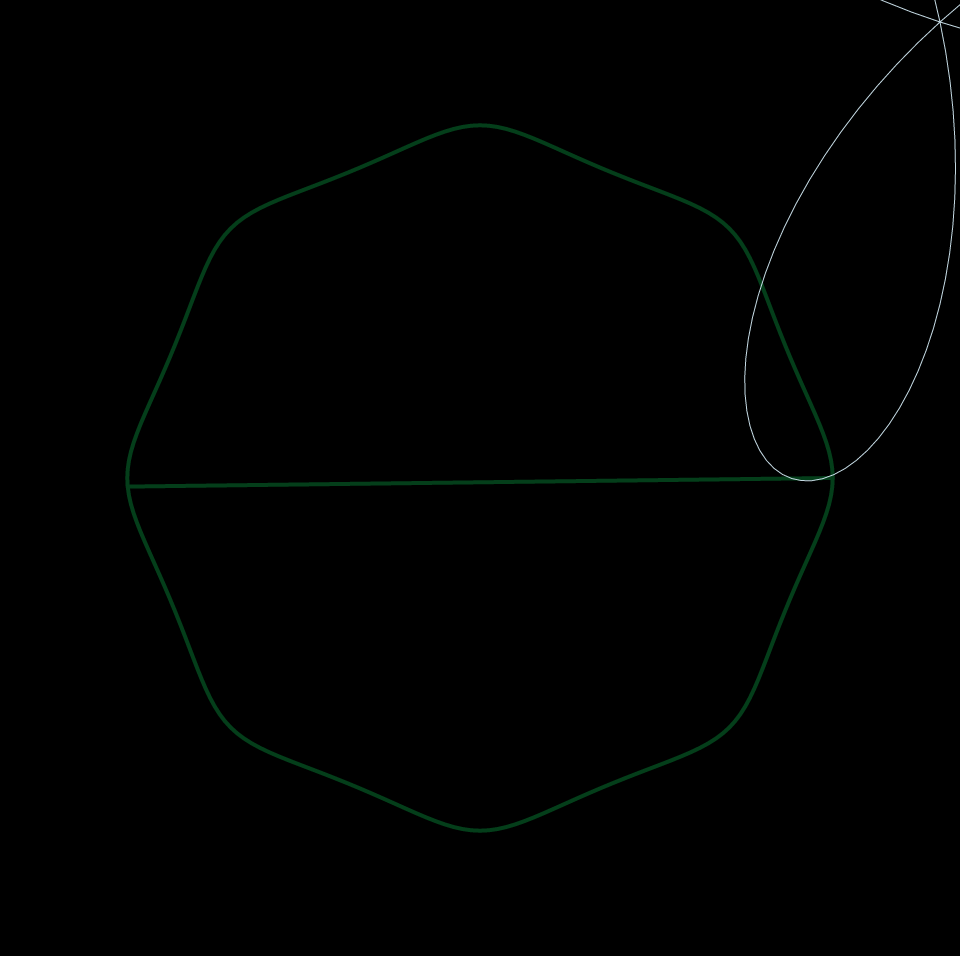
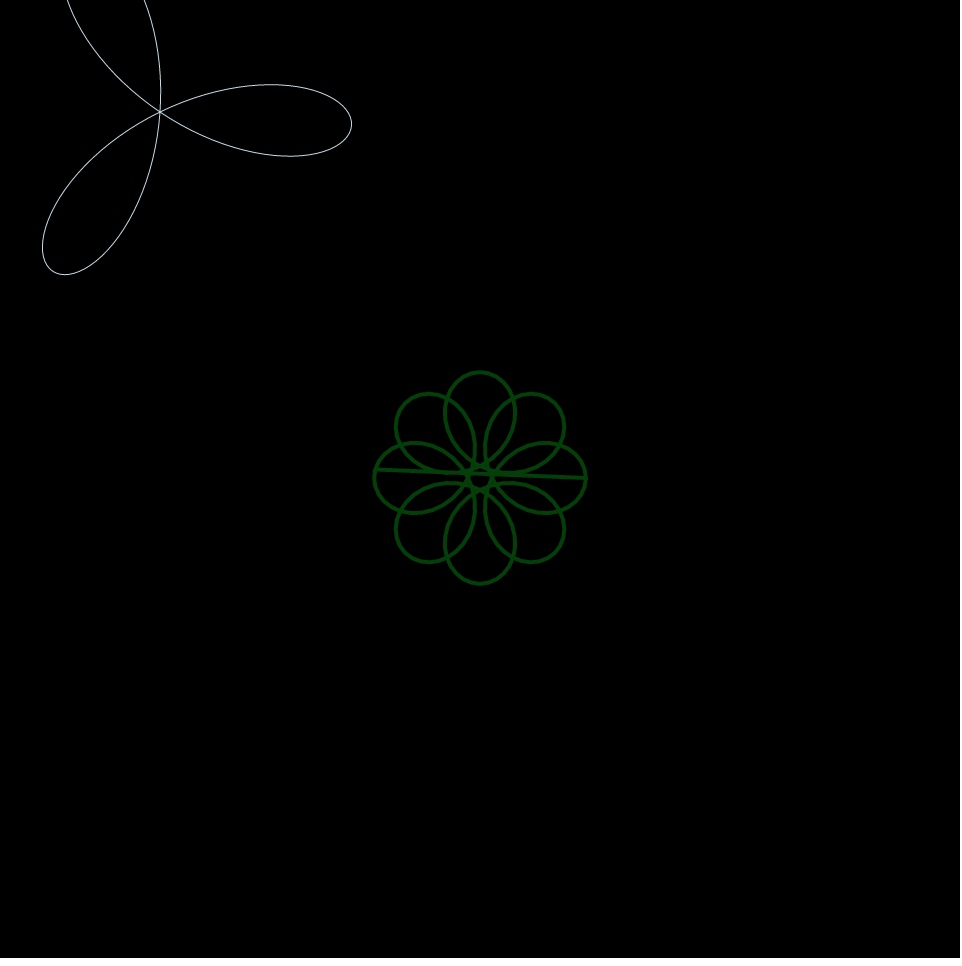
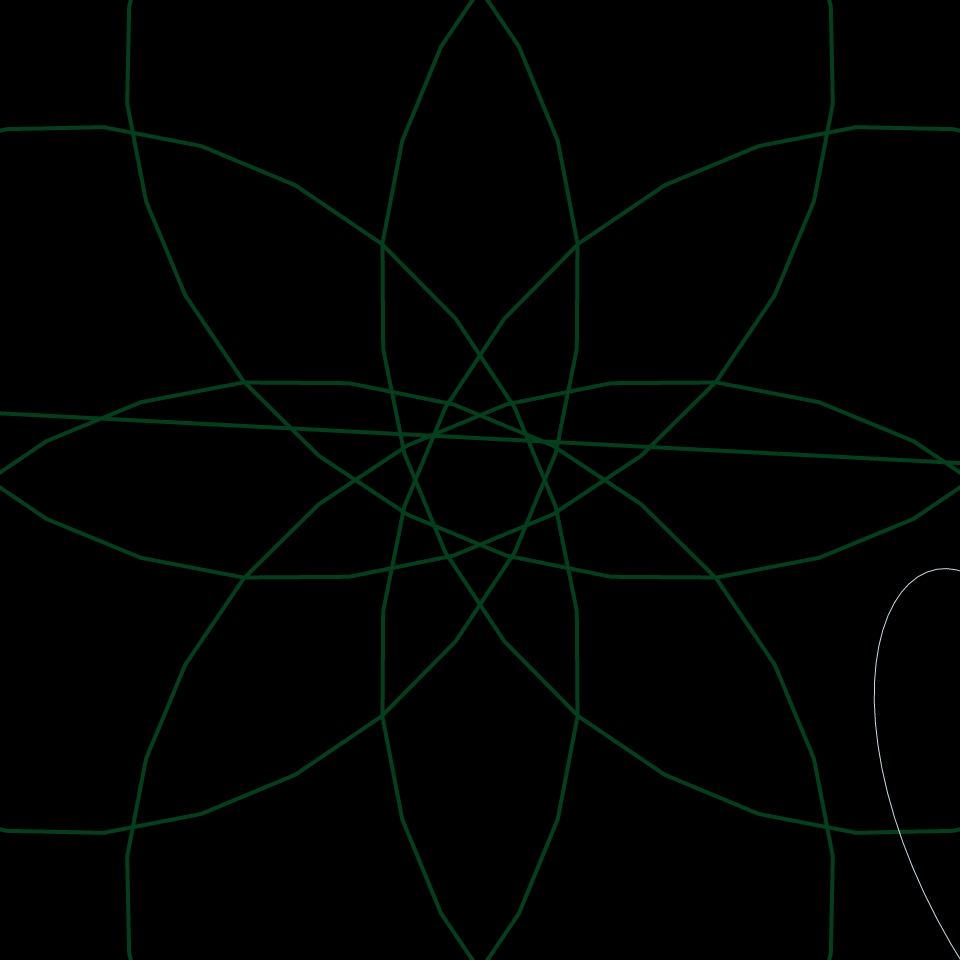
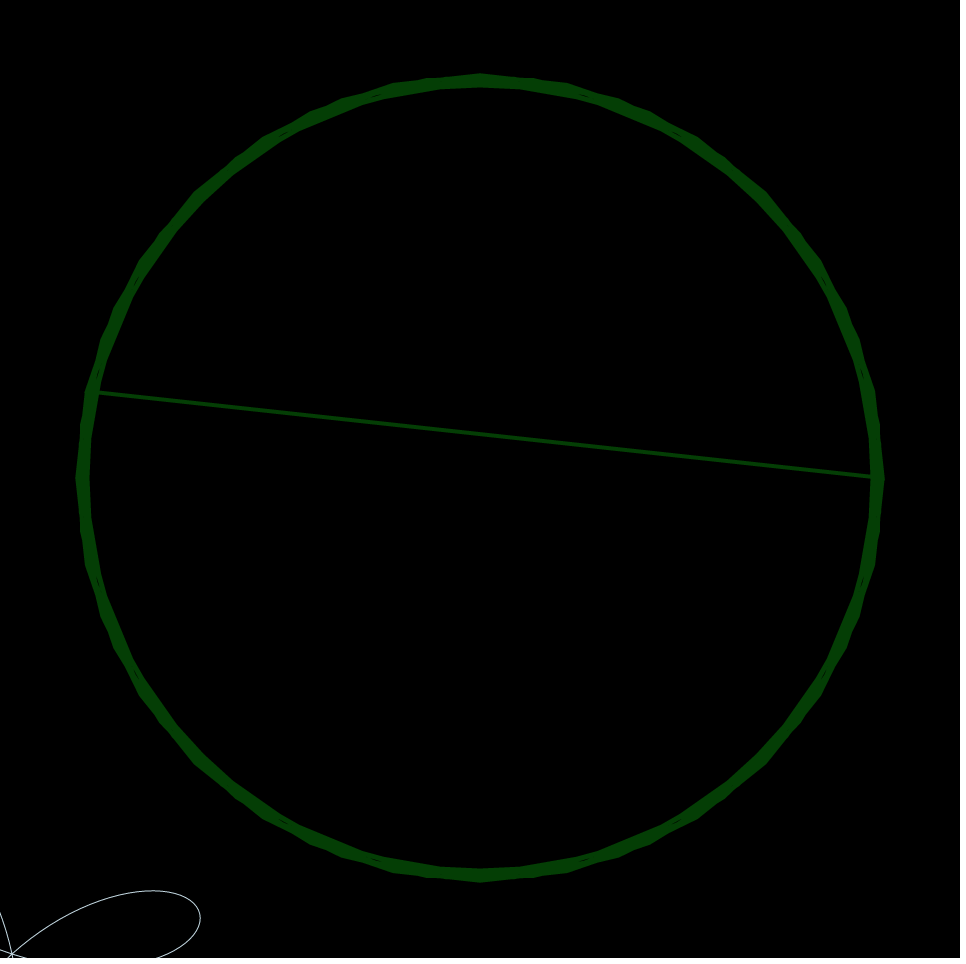
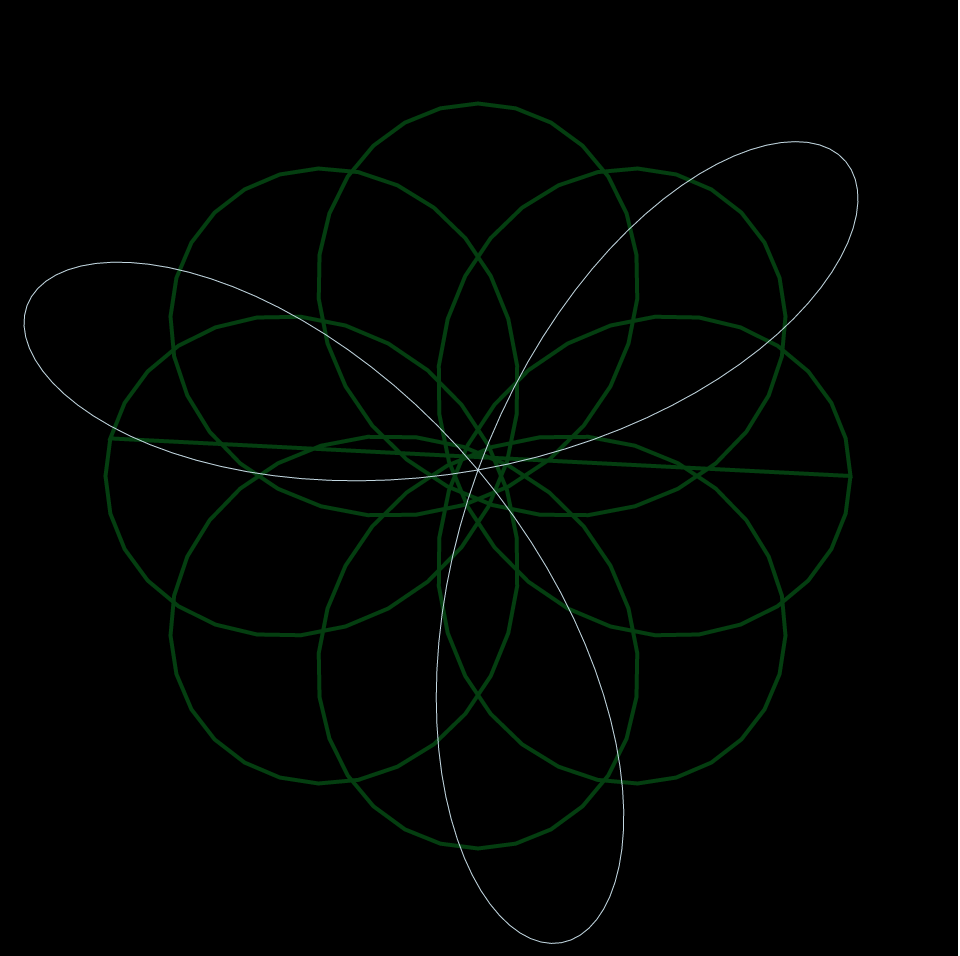
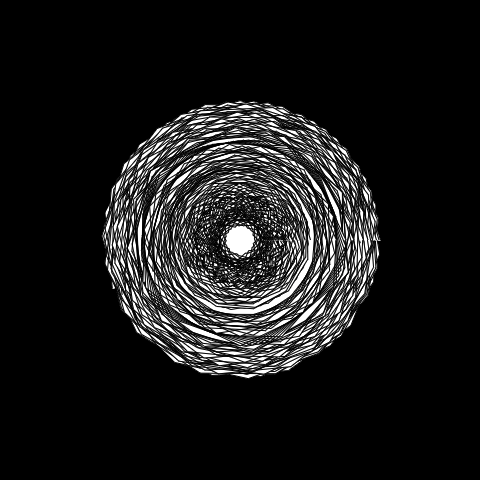
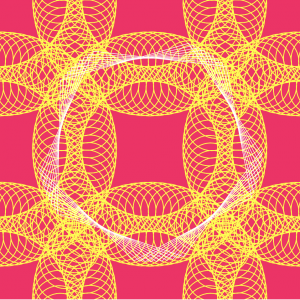
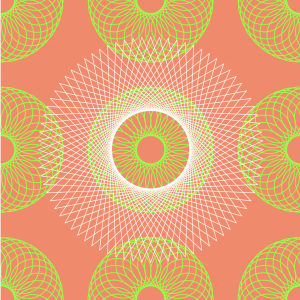
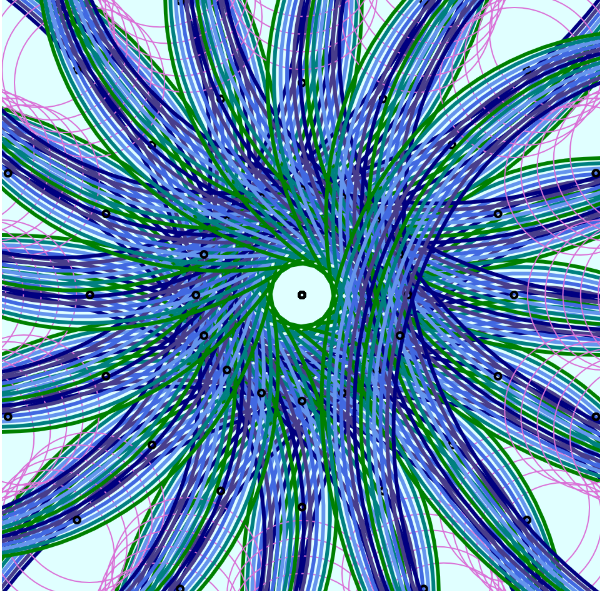
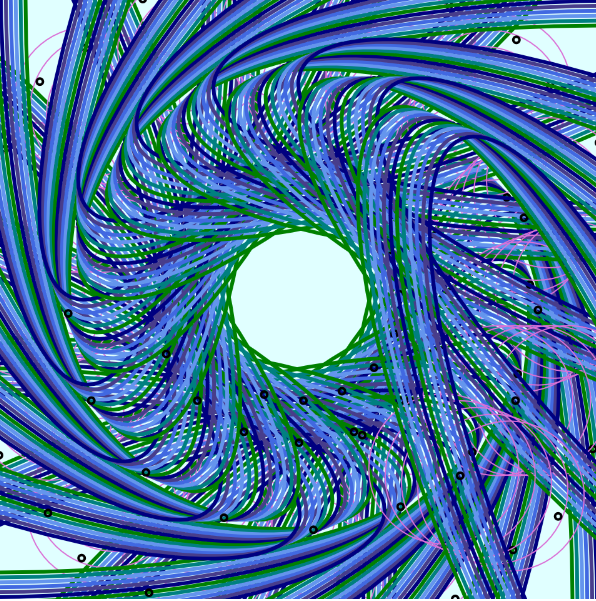
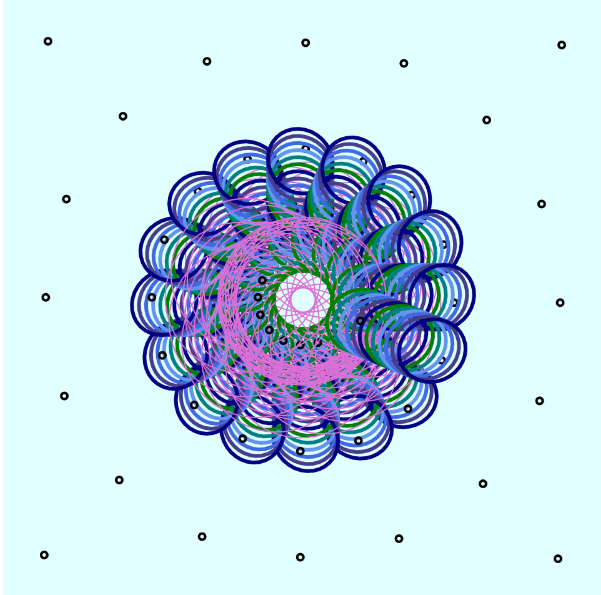
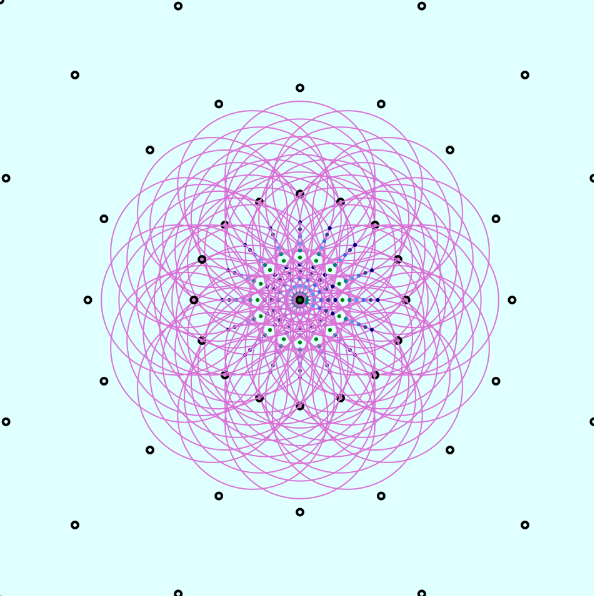
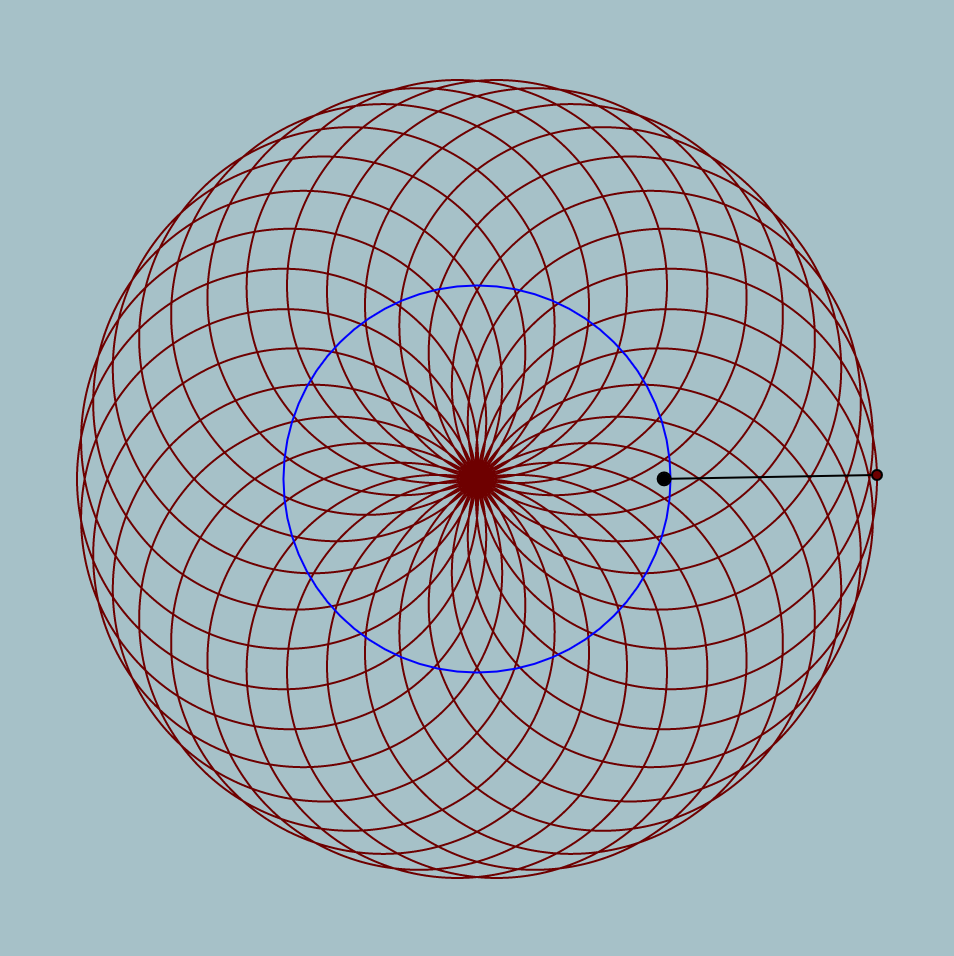
Trying to get the curve was pretty difficult. The website had a lot of equations on it and I picked through them to get the information I needed. Once I got the curve I wanted, the issue rose of how to implement it in the code. After experimenting for a bit and looking at the code given on the assignment instructions for reference, I eventually figured it out. After getting the curve to work, I changed some values so that it changed along with the mouse, making it interactive. I also added and changed other elements to make the image prettier, such as adding colors and flowers.

sketchsal

var num_points = 100;//number of points being drawn

function setup() {
    createCanvas(480, 480);
    frameRate(25);
}

function draw() {
    var hW = width / 2;//half of width
    var hH = height / 2;//half of height
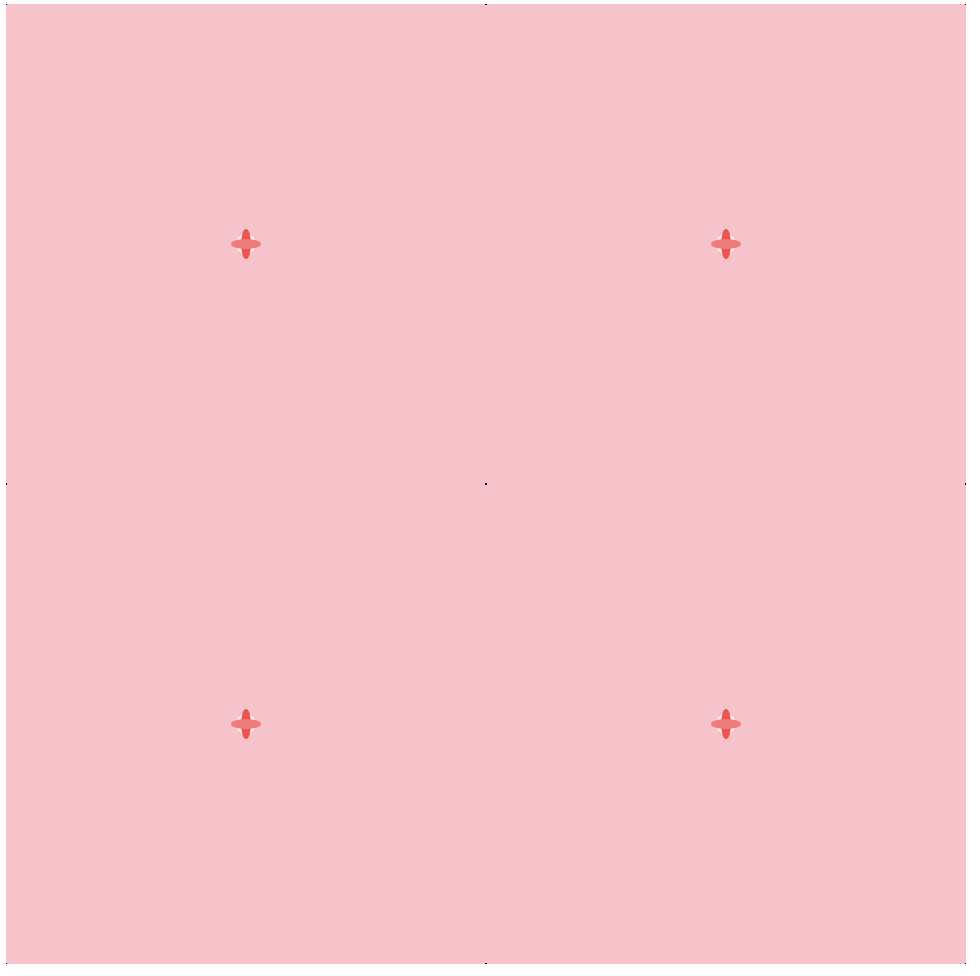
    background("pink");
    for(var i = 0; i < 3; i++){//draws rows of elements
        for(var g = 0; g < 3; g++){//drawns columns of elements
        ellipse((width / 2) * i,(height / 2) * g, (mouseX / 4) * 1,
            (mouseX / 4) * 1);//circles being drawn
        }

    }
    //circles
    noStroke();
    fill(255, 232, 232);
    ellipse(120,120, 10,10);//upper left
    ellipse(360,120, 10,10);//upper right
    ellipse(120,360, 10,10);//lower left
    ellipse(360,360, 10,10);//lower right
    //flowers
    fill(255, 69, 69);
    ellipse(120,120, 5,15);//upper left
    ellipse(360,120, 5,15);//upper right
    ellipse(120,360, 5,15);//lower left
    ellipse(360,360, 5,15);//lower right

    fill(255, 117, 117);
    ellipse(120,120, 15,5);//upper left
    ellipse(360,120, 15,5);//upper right
    ellipse(120,360, 15,5);//lower left
    ellipse(360,360, 15,5);//lower right
    fill('red');//makes circles red
    stroke(0);//makes everything outlined

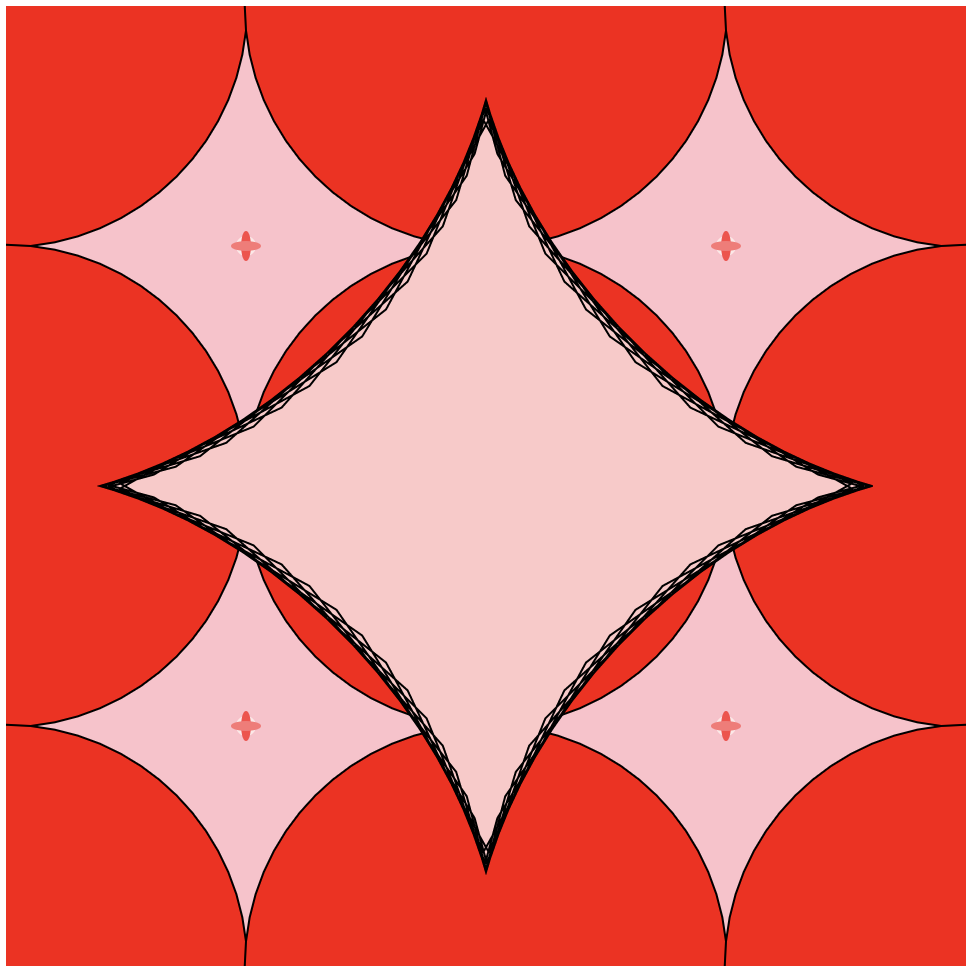
    //draw curve (Astroid) 
    push();
    translate(width / 2, height / 2);//(240,240)
    drawAstroid();
    pop();
}
function drawAstroid() {//function that draws curve
    var x;//calls x
    var y;//calls y
    var vx = mouseX / 5.0;//value of mouseX divided by 5 
    fill(255, 200, 200);//pink
    beginShape();//makes it so that the lines don't stay after being drawn
    //(there isn't a bunch of overlapping blackness)
    for (var i = 0; i < num_points; i++) {//increments elements from 0 to 100
        var t = map(i, 0, num_points, 0, TWO_PI);//runs curve from 0 to 2 pi
        
        x = vx * pow(cos(t * vx),3);//formula for x values
        y = vx * pow(sin(t * vx),3);//formula for y values
        vertex(x, y);
    }
    endShape(CLOSE);//ends shape
}

Before adding curve and circles
Finished product

Rachel Shin – Project 07- Curves

reshin-project07

/*Rachel Shin
reshin@andrew.cmu.edu
15-104 Section B
Project 07- Composition with Curves
*/

var numPoints = 300;
var angle = 0;


function setup() {
    createCanvas(480, 480)
    r = random(255);
    g = random(255);
    b = random(255);
}    


function draw() {
    background(0);

    push();
    translate(width / 2, height / 2); //center on canvas
    drawHypotrochoid();
    pop();

    push();
    translate(mouseX, mouseY); //center of curve based on mouse position
    rotate(radians(angle)); //rotates on center point
    drawTrifolium();
    pop();

    angle = angle + 4; // speed of rotation
}  
  
function drawHypotrochoid() { //http://mathworld.wolfram.com/Hypotrochoid.html
    var x;
    var y;
    
    //map boundaries
    var h = map(mouseY, 0, height, 0, 200); //size changes based on mouseY
    var a = map(mouseX, 0, width, 0, 200); //size changes based on mouseX
    var b = a / 8;

    //Hypotrochoid curve
    beginShape();
    for (var i = 0; i < numPoints; i ++) {
        stroke(r, g, b);
        strokeWeight(2);
        noFill();
        var t = map(i, 0, 200, 0, TWO_PI)
        x = (a - b) * cos(t) + h * cos(((a - b) / b) * t)
        y = (a - b) * sin(t) - h * sin(((a - b) / b) * t)
        vertex (x, y)
    }
    endShape(CLOSE);
}


function drawTrifolium() { //http://mathworld.wolfram.com/ConicalSpiral.html    
    var x;
    var y;
    var r;

    //constrain    
    var a = constrain(mouseX, width / 5, width / 2);
    
    //outline of light blue spinning trifolium
    noFill();
    stroke(195, 217, 227);
    strokeWeight(0.5);

    //Trifolium curve
    beginShape();
    for (var i = 0; i < numPoints; i++) {
        var t = map(i, 0, numPoints, 0, TWO_PI);
        r = - a * cos(3 * t);
        x = r * cos(t);
        y = r * sin(t);
        vertex(x, y);
    }
    endShape(CLOSE);
}

This project took me a while because it took me a while to figure out how to compute each curves. Maneuvering it around the canvas was more interesting for me because it allowed me observe how the code I wrote computed it to animate a certain way.

Ghalya Alsanea – LO-07 – What the street!?

MOVE LAB- Resident Researcher/Artist
Direction
Full Credits
–Data derived from OpenStreetMap (OSM)
This project looks into wasted public spaces in cities. The tool creates awareness about the disparity between the distribution of space for bikes, cars, parking lots, rails, etc.

Who “owns” the city?

They first looked at how much space there is in a city for moving around (ie the allocation/distribution ratios between cars, bikes, etc). The tool, “What the Street!?” is labelled as “The Mobility Space Report”, where the designers created an open-source public tool for exploring urban mobility spaces. They created a fun way to look at inequality of mobility spaces systematically AND interactively.

Play with the tool here!

Cover for About What the Street!?
I choose this project because of how the resulting shapes give a mesmerizing, never before seen perspective of urban spaces. For example, the image above shows all parking spaces in NYC, packed tightly together.

How does it work?

They use the data visualization tools of unrolling, packing, and ordering irregular shapes.  Therefore, they packed and rolled all mobility spaces into rectangular bins to visualize the areas they take up, then the tool allows you to see the same shape on a regular satellite map.

The mobility triangle shows how people move in each city – how much by car, bike, or public transport. Each dot stands for one city, and this specific image is highlighting Berlin (in blue). A dot in the very middle means an even share of these 3 forms of transportation is being used.

With each large dot there is a second dot that shows how much space a city has allocated for moving around with this particular transit mode. If first and second dots coincide, this would mean that city space is allocated in a fair way towards all forms of mobility. The triangle shows that space allocated is unfair: cars get much more space than they “deserve” – and bikes typically get much less. The team hope this tool shines a light on this disparity.

Minjae Jeong-Project-07

sketch

//Minjae Jeong
//Section B
//minjaej@andrew.cmu.edu
//Project-07


function setup() {
    createCanvas(480, 480);
    background('black');
}

function draw() {
    push();// draw in the middle
    translate(width / 2, height / 2);
    drawHypotrochoid();
    pop();
}

//Equations from http://mathworld.wolfram.com/Hypotrochoid.html
 function drawHypotrochoid() {
    var x;
    var y;
    var a1 = mouseX; //move mouse to control hypotrochoids drawing
    var a2 = mouseY;
    var h = 5;

    beginShape(); //draw hypotrochoid
    for (i = 0; i < 480; i += 5){
        var t = map(i, 0, 200, 0, width);
        x = (a1- a2) * cos(t) + h * cos(t * (a1 - a2) / a2);
        y = (a1- a2) * sin(t) - h * sin(t * (a1 - a2) / a2);
        vertex(x, y);
    }
    endShape();


}

This simple looking black and white drawing with hypotrochoids attracted me more than other colorful tries in many reasons. First of all, the first impression is very wild, and simple. With the mouse cursor starting at the middle of the canvas (240, 240), the canvas starts black, and creates white spaces as the mouse moves. The fun part is, the background will never be pitch black once you move your mouse.

The mouse movement is sensitive, the drawing can change in many ways according to the user control. Although it can’t go full black unless refreshing the page, the drawing can go all-white which can reset the drawing.

SooA Kim: Project-07-Curves


sketch

For this project, I tried to understand how curves work using cos() and sin(). So I spent time figuring out how to draw hypotrochoid after numerous attempt failed to get other curve forms.

Other forms that appear when you move your mouse:

/*SooA Kim
Section C
sookim@andrew.cmu.edu
Project 7: Composition with Curves
*/

var nPoints = 360;
var nPoints1 = nPoints * 10;
var angle = 1;

function setup() {
    createCanvas(480, 480);
    angleMode(RADIANS);
  }
  
function draw() {
    frameRate(24);
    var g = map(mouseX, 0, 480, 255, 0); //changing green color 
    background(255, g, 100);
    angle += 10

    //replicate hypotrochoid using for loop

      for (var px = 0; px < 1000 ; px += 240) {
          for (var py = 0; py < 1000; py += 240) {
            push();
            translate(px, py); 
            rotate(angle);
            Hypotrochoid();
            pop();
          } 
      }
    drawCurveOne();
}
    
function Hypotrochoid() {
    var r = map(mouseX, 0, 480, 0, 255); //for red color changes 
    var b = map(mouseY, 0, 480, 0, 255); //for blue

    strokeWeight(1.5);
    stroke(r, 255, b);
    noFill();
    beginShape();    

    var a = map(mouseX, 0, 480, 10, 120);
    var b = map(mouseY, 0, 480, 2, 10);
    var h = map(mouseY, 0, 480, 40, 120);

        for (var i = 0; i < nPoints1; i++) {
            t = map(i, 0, nPoints1, 0, TWO_PI);
//Reference from <mathworld.wolfram.com/Hypocycloid>
            var x = (a - b) * cos(t) + h * cos((a - b) / b * t);
            var y = (a - b) * sin(t) + h * sin((a - b) / b * t);
        
            vertex(x,y);
        }  

    endShape();
}

    function drawCurveOne() {
      stroke(255);
      strokeWeight(1);
      noFill();
      beginShape();
    
      //increase number of vertices of the curve 
      var nuV = map(mouseX, 0, width, HALF_PI, TWO_PI);
      
      for (var i = 0; i < nPoints; i+= nuV) {
          //applied i to cos() and sin() to see what happens  
          var x = 180 * cos(i) + width/2;
          var y = 180 * sin(i) + height/2;
          
          vertex(x,y);
      }
      endShape();
    }


Austin Garcia – Looking Outwards – 07 – Section C

Santiago Ortiz’s Personal Knowledge Database is a very interesting amalgam of this artists references.

Database

I could not find a way to link an image of this interactive piece to this page, but I wanted to write about it nonetheless. I was fascinated clicking through this shifting mess of lines and finding different websites that Ortiz has used as reference in the past. All of these sites were used or created by him for one reason or another. I find this to be a fascinating way of storing and categorizing digital histories and data. Personally, I try to store a lot of my own references as images or text on my computer or an external hard drive. I have design documents and specifications, color palates, and academic papers all stored in folders. This method is a great way of visualizing that data as well as less tangible data like links to websites which are easily forgotten. While this way of sorting these things is not necessarily logical for accessing that data in the future, it is a visually compelling way to display all that data.

CJ Walsh – Project 07 – Composition with Curves

sketch

// CJ Walsh 
// Section D
// cjwalsh@andrew.cmu.edu
// Project 07
 
function setup() {
    createCanvas(480, 480);
    cx = width/2;
    cy = height/2;
    // list of colors for my larger lines 
    c1 = ['green', 'teal', 'cornflowerblue', 'royalblue', 'darkslateblue', 'navy'];
}
 
 
function draw() {
    background("lightcyan");
    h = cx;
    w = cy;
    s = PI/8;
    noFill();
    mx = constrain(mouseX, 0, cx);
    my = constrain(mouseY, 0, cy);
    // loop to establish all of the curves I draw 
    for (i = 0; i <= 2*PI; i+=s) {
        // thin orchid lines
         for (k = 0; k < 5; k++) {
            push();
                strokeWeight(1);
                stroke('orchid');
                translate(cx, cy);
                rotate(i);
                ellipse(mx - 30 - 10*k, my - 30 - 10*k, 120, 120);
            pop();
        }
        // larger blue/green lines
        for (j = 0; j < 12; j++) {
            push();
                strokeWeight(3);
                stroke(c1[j%6]);
                translate(cx, cy);
                rotate(i);
                ellipse(mx + 4*j, my + 4*j, 3*mouseX/2, 3*mouseY/2);
            pop();
        }
        // small black dots
        for (l = 0; l < 30; l++) {
            push();
                strokeWeight(2);
                stroke('black');
                translate(cx, cy);
                rotate(i);
                ellipse(mx - 60*l, my - 60*l, 5, 5);
            pop();
        }

    }    
}
 

This was a super fun project to make in terms of experimenting with curves and loops. I started out by setting up an initial for loop and just drawing one curve. From there, I established some more loops to duplicate lines, or played around with some of the numbers so that I could create different shapes. This is another project that I could definitely see myself playing with or changing in the future because it was so fun to make. Below I included some of my favorite screenshots of the composition as it moves around.

Ghalya Alsanea – Project-07-Curves

sketch

//Ghalya Alsanea
//Section B
//galsanea@andrew.cmu.edu
//project-07

var outR;               //outer circle radius
var inR;                //inner circle radius
var d = 100;            //distance for drawing pedal 
var t;                  //theta variable
var points = 10000;     //number of points to draw in for loop
var color2;             //global color variable

//constrained mouse values
var MX;
var MY;
//x and y values for resulting curve
var x;
var y;

function setup() {
    createCanvas(480, 480);
}

function draw() {
    //constrain mouse x and y within the canvas
    MX = constrain(mouseX, 0, width);
    MY = constrain(mouseY, 0, height);

    //map background color based on mouse location
    var color0 = map(MX, 0, width, 150, 250);
    var color1 = map(MY, 0, height, 150, 250);
    background(color0, color1, 200);

    //mapped color value based on mouse y location
    color2 = map(MY, 0, height, 0, 255);

    //draw everything using the center of canvas as (0,0)
    translate(width/2, height/2);
    //map the driving circle dimensions to mous x pos
    n = map(MX, 0, width, 0, 6)
    //rose formula for the radii
    outR = (2*n*d)/(n+1);
    inR = (n-1)*d/(n+1);

    drawHypotrochoid();
    drawBaseCrvs();
}

function drawHypotrochoid() {
    noFill();
    //map color value to mouse y location
    stroke(color2, 0, 0);

    //draw the resulting curve
    beginShape();
    for (var i = 0; i < points; i++) {
        // map theta to full circle radians
        t = map(i, 0, points, 0, TWO_PI);
        //use the mathematical formula of a Hypotrochoid to find x and y values
        x = (outR - inR) * cos(t) + d * cos((outR-inR) / inR * t);
        y = (outR - inR) * sin(t) - d * sin((outR-inR) / inR * t);
        vertex(x, y);
    }
    endShape();

}

function drawBaseCrvs() {
    //draw outer circle
    stroke(0, 0, 255);
    noFill();
    ellipse(0, 0, 2*outR, 2*outR);

    //draw the inner circle and line 
    stroke(0);
    fill(0);
    ellipse((outR+inR) * cos(t), (outR+inR) * sin(t), 5, 5);
    line((outR+inR) * cos(t), (outR+inR) * sin(t), x, y);
    noFill();
    ellipse((outR+inR) * cos(t), (outR+inR) * sin(t), 2 * inR, 2 * inR);

    //draw pedal dot
    fill(color2, 0, 0);
    ellipse(x, y, 5, 5);
}

Inspired by the rose variation of a hypotrochoid on Wolfram’s Math World, I tried to show the logic behind how the hypotrochoid curves are drawn as well. In terms of color, the background and the resulting curve’s stroke color change with the mouse location. To add an extra level of interaction, the “n” variable also reacts to the mouse location, which controls the radii of the two circles that create the hypotrochoid, resulting in the manipulation of the resulting overall shape.

Xiaoyu Kang – Project 07 – Curves


sketch

//Xiaoyu Kang
//xkang@andrew.cmu.edu
//Section B
//Project-07

var angles = 0;
function setup() {
    createCanvas(480, 480);
}

function draw() {
    background(0);
    stroke(mouseX, 220, mouseY);
    translate(width / 2, height / 2);
    // all the curves rotate at the same speed
    rotate(radians(angles));
    angles += (mouseY/30);
    drawCruciform(); 
    drawAstroid();
    drawEpitrochoid();
}

function drawCruciform() {
    // http://mathworld.wolfram.com/Cruciform.html
    push();
    noFill();
    strokeWeight(1);

    
    //creates the cruciform
    beginShape();
    var a = map(mouseX, 0, width, 0, 300);
    var b = map(mouseY, 0, height, 0, 300);
       
    for (var i = 0; i < 800; i++) {
        var t = map(i, 0, 150, 0, TWO_PI);
        var x = a * 1 / (cos(t));
        var y = b * 1 / (sin(t));
        vertex(x, y);
    }
    endShape();
    pop();
}

function drawAstroid() {
    // http://mathworld.wolfram.com/Astroid.html
    push();
    noFill();
    strokeWeight(1);
    
    //draw astroid
    beginShape();
    var a = map(mouseX, 0, width, -300, 300);

    for (var i = 0; i < 500; i++) {
        var t = map(i, 0, 150, 0, TWO_PI);
        var x = 3 * a * cos(t) + a * cos(3 * t);
        var y = 3 * a * sin(t) - a * sin(3 * t);
        vertex(x, y); 
    }
    endShape();
    pop();
}

function drawEpitrochoid() {
    // http://mathworld.wolfram.com/Epitrochoid.html
    push();
    noFill();
    strokeWeight(1);
    
    //draw epitrochoid
    beginShape();
    var a = map(mouseX, 0, width, -100, 100);
    var b = map(mouseX, 0, width, -100, 200);
    var h = map(mouseY, 0, height, -300, 200);


    for (var i = 0; i < 600; i++) {
        var t = map(i, 0, 150, 0, TWO_PI);
        var x = (a + b) * cos(t) - h * cos(((a+b)/b) * t);
        var y = (a + b) * sin(t) - h * sin(((a+b)/b) * t);
        vertex(x, y); 
    }
    endShape();
    pop();
}

For this project, I really want to create curves that are diverse in shape as the mouse moves around. I picked three curves that are all very different in shape an as the mouse moves they turn into patterns with different level of complexity. Also to add some more visual elements, I changed the color setting so that as the mouse moves the color changes as well.

Yoshi Torralva-07-Curves

sketch

// Yoshi Torralva
// yrt@andrew.cmu.edu
// Section E
// Project-07-Curves

// rotation variable speeds
var angle = -1;
var angle1 = -1;
var angle2 = -1;
function setup() {
    createCanvas(480, 480);
}
function draw() {
    // calling five hypotrochoids 
    // from the same drawhypotrochoid function
    //upper left hypotrochoid
    background(210);
    push();
    rotate(angle2);
    angle2 = angle2 + 0.01;
    drawHypotrochoid();
    pop();
    //center hypotrochoid
    push();
    translate(width/2, height/2);
    rotate(angle1);
    angle1 = angle1 + 0.01;
    drawHypotrochoid();
    pop();
    //right hypotrochoid
    push();
    translate(480, 0);
    rotate(angle2);
    angle2 = angle2 + 0.01;
    drawHypotrochoid();
    pop();
    //bottom right hypotrochoid
    push();
    translate(480, 480);
    rotate(angle2);
    angle2 = angle2 - 0.02;
    drawHypotrochoid();
    pop();
    //bottom left hypotrochoid
    push();
    translate(0, 480);
    rotate(angle2);
    angle2 = angle2 - 0.02;
    drawHypotrochoid();
    pop();
}
// Hypotrochoid
function drawHypotrochoid(x, y) {
    //setting a, b, and h variables
    // radius
    a = map(mouseX, 0, width/6, 0, 50);
    // radius of rotating circle
    b = a / constrain(mouseY, 0, height);
    // starting height 
    h = 100;
    points = 10000;
    push();
    beginShape();
    translate(0, 0);
    noFill();
    // variables to create shifting greyscale
    // depending on mouseX and mouseY positions
    var limitto255 = mouseX - 500;
    var limitto255y = mouseY - 450;
    stroke(0 + limitto255, 255 - limitto255y);
    // for loop to create multiple lines up to 10000
    for(var i = 0; i < points; i++) {
        // constrains on mouseX and Y on variables
        a = constrain(mouseX, 0, width);
        b = constrain(a/mouseY, 0, width);
        h = constrain(mouseY, 0, height);
        var t = map(i, 0, points, 0, TWO_PI);
        x = (a - b) * cos(t) + h * cos(((a + b)/ b) * t);
        y = (a - b) * sin(t) - h * sin(((a - b)/ b) * t);
        // half of original size 
        strokeWeight(0.05);
        vertex(x/2,y/2);
    }
    endShape();
    pop();
}

Circles visible at the top part of the canvas.
Square forms when the mouse is as the left side of the canvas
Five hypotrochoid curves intersect creating a dynamic form.

With this project, I was inspired to emulate the qualities of fabric like tulle and mesh. Using these mathematical curves afforded the opportunity to explore this. I decided to use the hypotrochoid curve as it offered the ability to create overlapping curves like the Guilloché Pattern. Going beyond my inspiration for fabric, I wanted to convey the feelings of hardness and softness. When the mouse is moved to the right, the hypotrochoids turn into squares. When the mouse is moved to the left, the hypotrochoids take a dynamic shape. I implemented rotation to allow for interactive intersections and organic forms to come to life. I chose to make this project at a greyscale as I wanted the viewers to focus to be on the form. Variations on the greyscale are achieved through mouse positioning.