Claire Yoon-Project 7-Curves

sketch

/* Claire Yoon
   claireyo@andrew.cmu.edu
   Section E
   Project 7 */

// global variables
var nPoints = 200;
var angle = 0;
var rotateCount = 0
function setup() {
    createCanvas(480, 480);
    frameRate(20);
}

function draw() {
    background (255, 209, 224);
    // calling functions at middle of the canvas
    push();
    translate(width / 2, height / 2);
    // function continuously rotating 
    rotate(radians(rotateCount));
    rotateCount++;
    drawHypocycloid();
    drawHypotrochoid();
    pop();


}
function drawHypotrochoid() {
    //setting variables for pale pink hypotrichoid
    var a1 = map(mouseX, 0, 450, 50, 240);
    var b1 = 10;
    var h1 = map(mouseX / 10, 0, 200, 0, height);

    //pale pink stroke
    fill(255, 255, 255, 100);
    stroke(255, 209, 224);
    strokeWeight(1.5);
    // for loop to draw hypotrochoid form
    beginShape();
    for(var i = 0; i < nPoints; i++) {
        // angle for hypotrochoid formula
        var angle1 = map(i, 0, 100, 0, TWO_PI);
        x = (a1 - b1) * cos(angle1) + h1 *  cos(((a1 - b1)/ b1) * angle1);
        y = (a1 - b1) * sin(angle1) - h1 * sin(((a1 - b1)/ b1) * angle1);
        vertex(x, y);
    }
        endShape();
}

function drawHypocycloid() {
    // setting variables for white astroid
    a2 = int(map(mouseX, 0, width, 240, 150));
    b2 = int(map(mouseX, 0, width, 8, 15));
    // pale pink with low opacity
    fill(189, 236, 255, 40);
    stroke("white");
    strokeWeight(1);

    beginShape();
    // for loop to draw hypocycloid form
    for (var i = 0; i < 200; i++){
        // angle for hypocycloid formula
        var angle2 = map(i, 0, 100, 0, TWO_PI);
        var x = a2 * ((b2 - 1) * cos(angle2) + cos((b2 - 1) * angle2)) / b2;
        var y = a2 * ((b2 - 1) * sin(angle2) + sin((b2 - 1) * angle2)) / b2;
        vertex(x, y);
    }
    endShape();
}

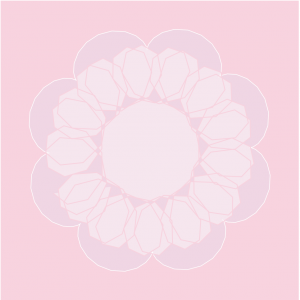
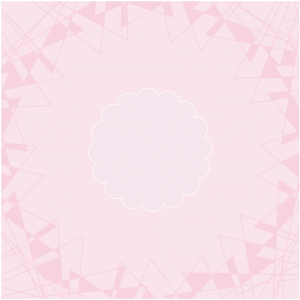
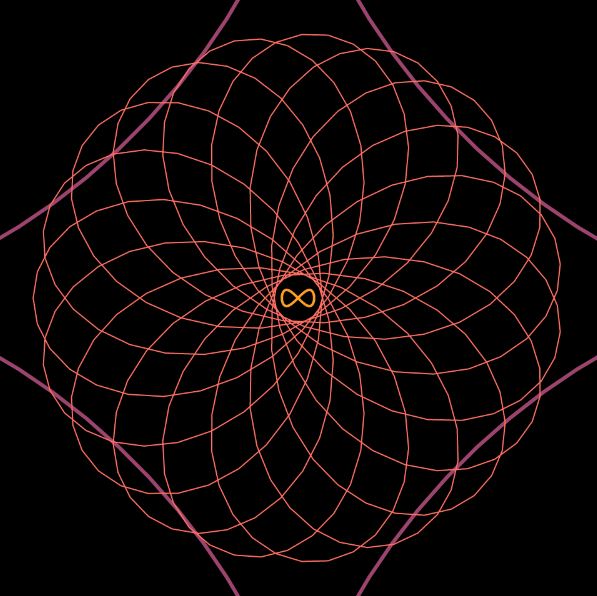
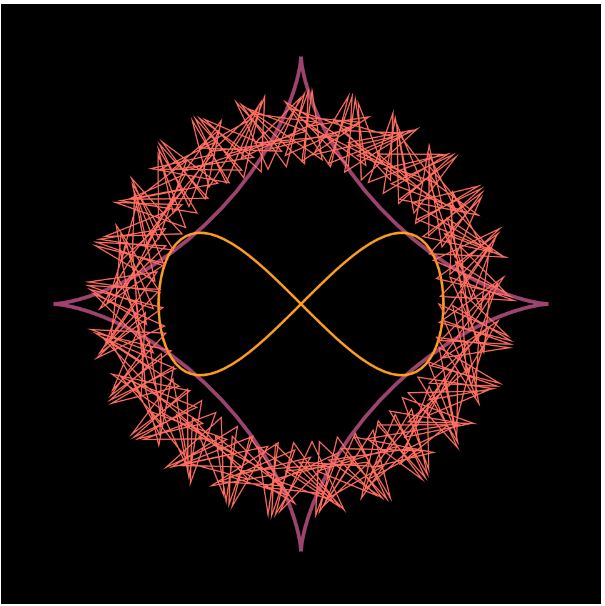
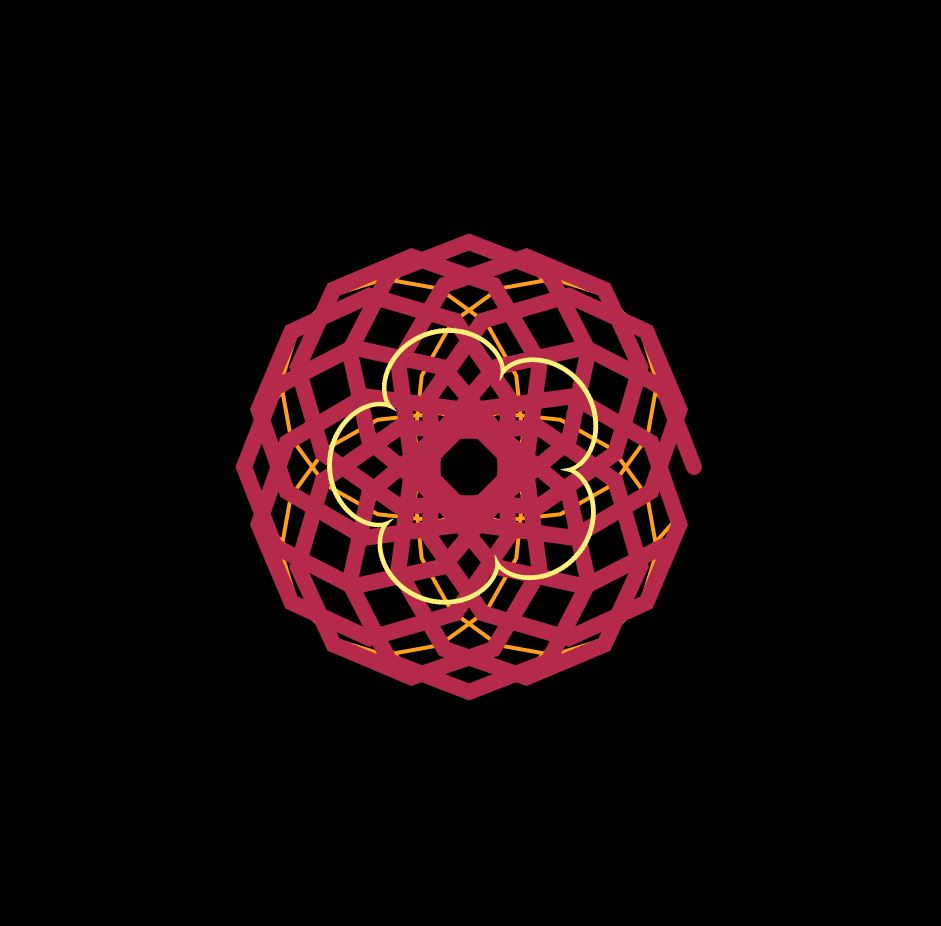
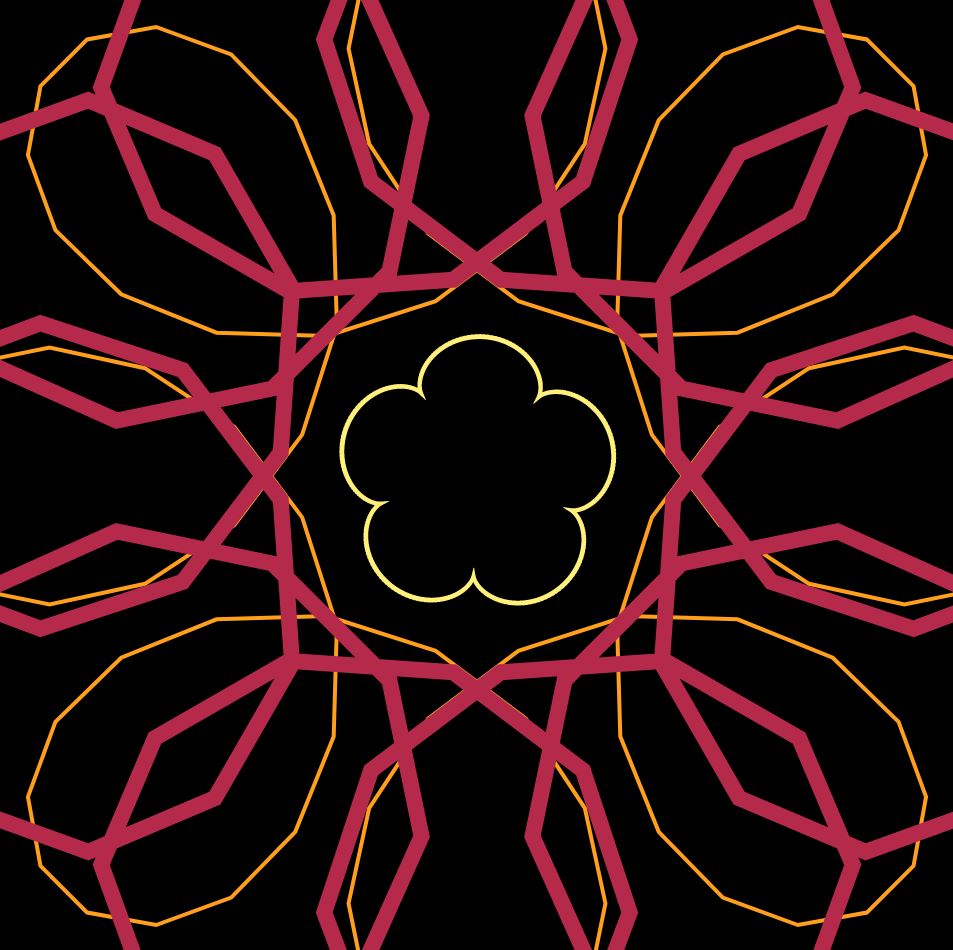
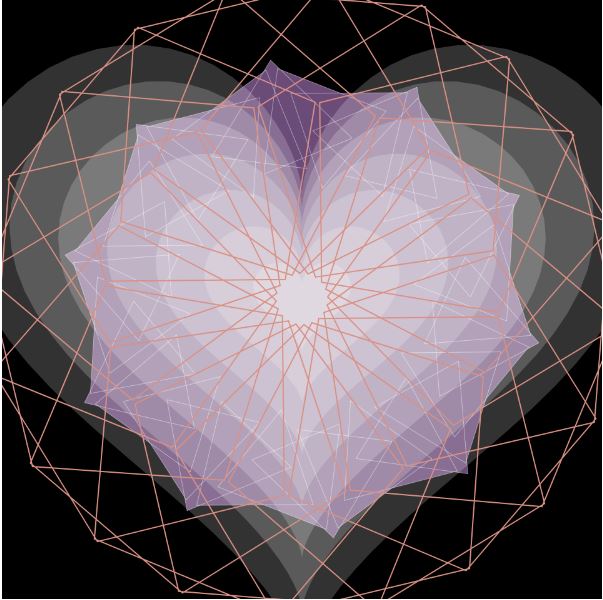
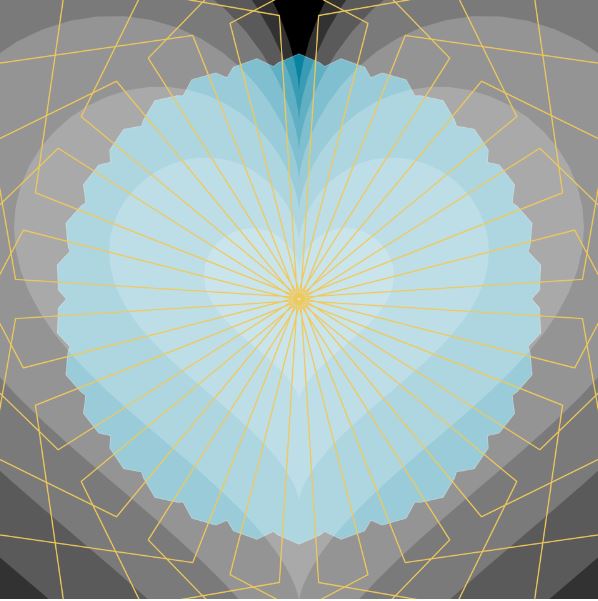
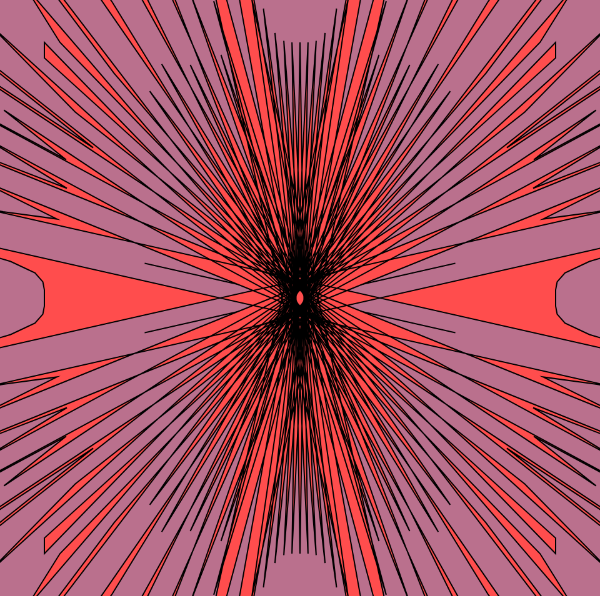
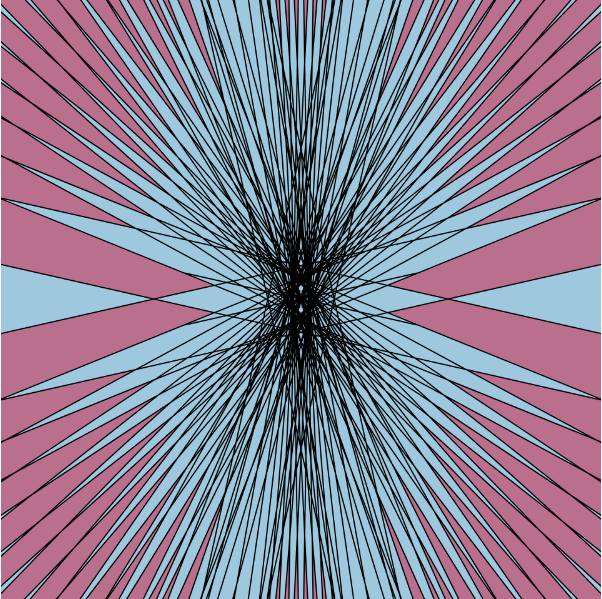
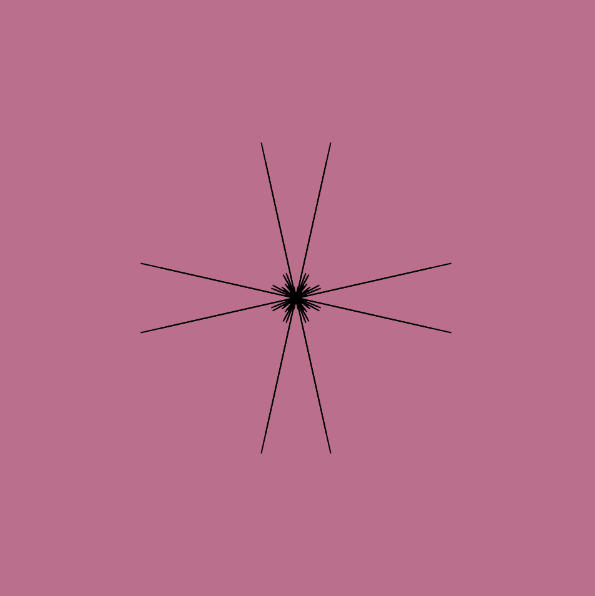
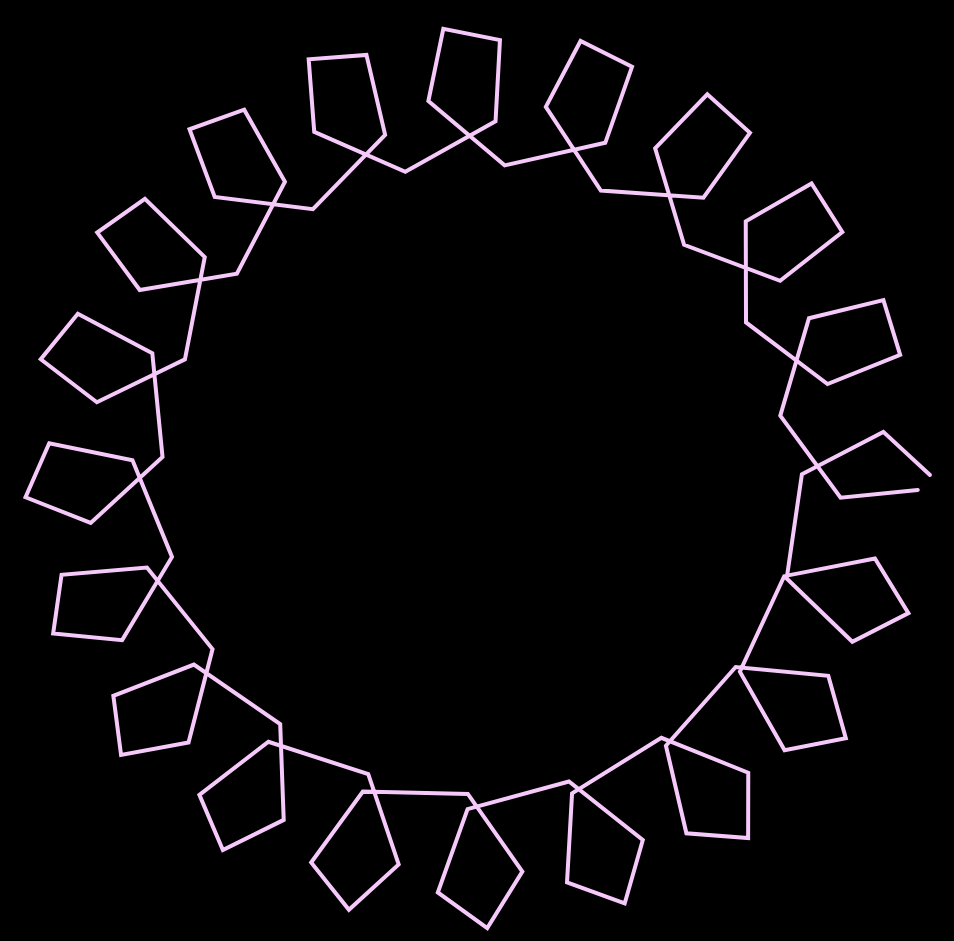
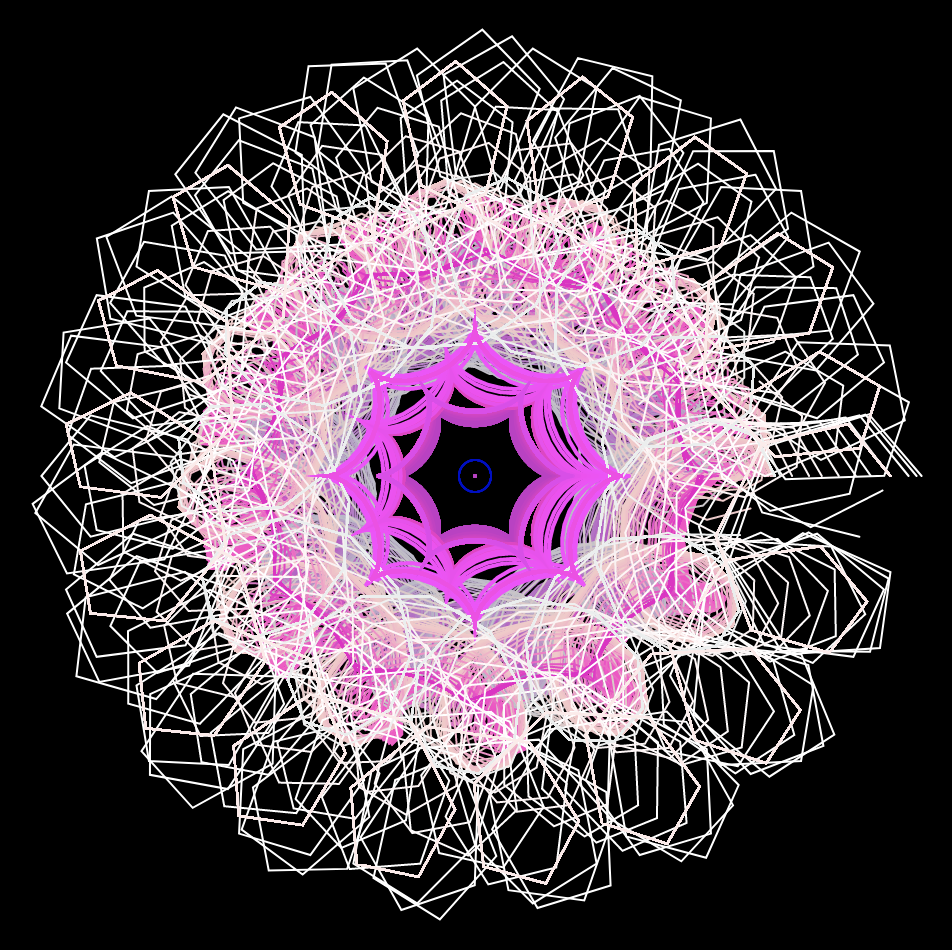
For this project, I played  with how the different curve functions interacted and overlapped with each other. I made the rotation continuous to make it more visually dynamic.

Different forms:

Xu Xu – Project 07 – Curves

sketch

//Claire Xu
//xux1@andrew.cmu.edu
//Section B
//Project-07
var angle = 0;

function setup() {
    createCanvas(480, 480);
    frameRate(100);
}


function draw() {
    background("black");
    push();
    translate(width/2, height/2);
    rotate(radians(angle));
    angle += mouseX;
    drawAstroid();
    drawEightCurve();
    drawHypocycloid();
    pop();
}
function drawAstroid() {
    var b = map(mouseY, 0, width, -100, 150);
    strokeWeight(3);
    stroke(157,68,110);
    noFill();
    beginShape();
    for (var i = 0; i < 300; i++){
        var t = map(i, 0, 100, 0, TWO_PI);
        var x = (3*b*cos(t) + b*cos(3*t));
        var y = (3*b*sin(t) - b*sin(3*t));
        vertex(x, y);
    }
    endShape(CLOSE);

}
function drawEightCurve() {
    strokeWeight(2);
    stroke(252,158,33);
    noFill();
    var a = map(mouseX, 0, width, 0, 100); 
    beginShape();
    for (var i = 0; i < 800; i++){
        var t = map(i, 0, 100, 0, TWO_PI);
        var x = (a*sin(t));
        var y = (a*sin(t)*cos(t));
        vertex(x, y);
    }
    endShape(CLOSE);
}

function drawHypocycloid() {
    strokeWeight(1);
    stroke(255,111,97);
    noFill(); 
    var a = map(mouseX, 0, width, 0, 150);
    var b = map(mouseY, 0, width, 0, 150);
    beginShape();
    for(var i = 0; i < 400; i++){
        var angle2 = map(i, 0, 100, 0, TWO_PI);
        var x = ((a - b)* cos(angle2) - b*cos(((a - b))*angle2));
        var y = ((a - b)* sin(angle2) + b*sin(((a - b))*angle2));
        vertex(x, y);
    }
    endShape(CLOSE);
}

This project was quite challenging, because it took me a long time before I figured out what part of the code modified which part of the drawn form. I wanted to create spiraling geometric shapes that are web-like, and I was really interested in Hypocycloid, because it seemed to be less “restrictive” than other curves. I think the rotation makes it look more fun, because it gives the drawing a new dimension.

Stefanie Suk – Project 07 – Curves

sketch

//Stefanie Suk
//15-104 D
//ssuk@andrew.cmu.edu
//Project - 07 - Curves

var nPoints = 100;

function setup() {
    createCanvas(400, 400);
}


function draw() {

    fill(20, 8, 78); //color for background
    rect(0, 0, width, height); 
    
    push();
    translate(width / 1.4, height / 2);
    drawCurve();
    pop();

}

function drawCurve() {
    var cR = map(mouseX, 0, width, 100, 200);
    var cG = map(mouseX, 0, width, 200, 250);
    var cB = map(mouseX, 0, width, 230, 255); //color for shape

    var s = 100; // size
    var a = constrain(mouseX/2, 0, width) / 30; // mousex position
    var b = constrain(mouseY/2, 0, height) / 30; // mousey position

    fill(cR, cB, cG);
    strokeWeight(5);
    stroke(255);

    beginShape(); 
    for (var i = 0; i < nPoints; i++){ 
    var t = map(i, 0, nPoints, 0, TWO_PI); 

    x = s * (cos(a+t) * (1-(cos(a+t))));
    y = s * (sin(b+t) * (1-(cos(b+t)))); // equation of curve to create shape

    vertex(x,y);// drawing vertex
  }
  endShape(CLOSE); 
}

I used the Cardioid Curve from the Mathworld curves site to create this project. At first, I thought the movement of the curve was interesting, which is why I chose to use this particular curve. I thought the circular movement of the curve looked like the tornado-like movement of water when it is spun. I tried to express that circular movement of water with cardioid. By making the background color dark blue and the shape itself change colors between different shades of blue, I tried to express water and the spiral movement of water. Everytime I move the mouse left, the shape will turn clockwise and the color will turn vivid blue-green. When the mouse is moved right, the shape will turn counter-clockwise and the color will turn light blue.

Sarah Kang – Project 07 – Curves

curves

//sarah kang
//section c
//sarahk1@andrew.cmu.edu
//project-07-curves

 
 var ang = 0;
 var nPoints = 100; 

function setup() {
    createCanvas(480, 480);
}

function draw() {

    background(0);
    noFill();
    //orange curves
    push();
    translate(width / 2, height / 2);
    strokeWeight(2);
    stroke(255, 159, 28);
    drawHypo1();
    pop();
    //red curves
    push();
    translate(width / 2, height / 2);
    strokeWeight(8);
    stroke(181, 42, 74);
    drawHypo2();
    pop();
    //yellow curves
    push();
    strokeWeight(2);
    stroke(255, 240, 122);
    translate(width / 2, height / 2);
    rotate(radians(ang));
    ang += mouseX / 50;
    drawRan();
    pop();
}
//Ranunculoid Curve 
function drawRan(){ //http://mathworld.wolfram.com/Ranunculoid.html
    var sz = 10;
    //curve
    beginShape();
    for (var i = 0; i < nPoints; i += 0.1){
      var xr = sz * (6 * cos (i) - cos (6 * i));
      var yr = sz * (6 * sin (i) - sin (6 * i));
      vertex(xr, yr);
    }
    endShape();
}

//Hypotrochoid Curve 1
function drawHypo1() { //http://mathworld.wolfram.com/Hypotrochoid.html

    var x;
    var y;
    //controls 
    var h = map(mouseY, 0, height, 0, 80);
    var a = map(mouseX, 0, width, 0, 300);
    var b = a / 8;
    //curve
    beginShape();
    for (var i = 0; i < nPoints; i ++) {
        var t = map(i, 0, 100, 0, TWO_PI)
        x = (a - b) * cos(t) + h * cos(((a - b) / b) * t)
        y = (a - b) * sin(t) - h * sin(((a - b) / b) * t)
        vertex(x, y)
    };
    endShape();
}

//Hypotrochoid Curve 2
function drawHypo2() { //http://mathworld.wolfram.com/Hypotrochoid.html

    var x;
    var y;
    //controls 
    var h = map(mouseY, 0, height, 0, 80);
    var a = map(mouseX, 0, width, 0, 300);
    var b = a / 12;
    //curve
    beginShape();
    for (var i = 0; i < nPoints; i ++) {
        var t = map(i, 0, 100, 0, TWO_PI)
        x = (a - b) * cos(t) + h * cos(((a - b) / b) * t)
        y = (a - b) * sin(t) - h * sin(((a - b) / b) * t)
        vertex(x, y)
    };
    endShape();
}

At first, trying to understand how the math equations were controlled was pretty confusing; after experimenting with the variables, I was able to adjust and change the outputs of the curves equations to how I wanted it to look. Then, I formatted the curves in terms of color and stroke weight to create a flowery design.

Stefanie Suk – Looking Outwards – 07

Installation of Unnumbered Sparks in Vancouver, Canada

Unnumbered Sparks, a work by Aaron Koblin and Janet Echelman, is a monumental interactive sculpture installed in the sky. This sculpture is a crowd-controlled visual artwork on a large canvas, where the color and design on the sculpture is choreographed by visitors at the moment through their mobile device. The visitors were able to use their smartphones and tablets to paint colors of light across the installation. Every small movement of the electronic devices projected vivid beans of light across the sculpture. What I admire the most about this artwork is the scale and complexity achieved in a single piece of installation. The computational software used in this sculpture explores scale, density, shape, and interaction with people, which I thought was the most fascinating about this project. Thus, the material used in this installation also caught my attention. The whole sculpture is made out of soft fibers attached directly into existing buildings. This exploration of material and application of interaction technology, I thought, really showed how much the artists wanted people to feel projected/connected to their artwork. This sculpture was definitely successful in using computation technology to create interaction between artwork and the visitors. 

Video of Unnumbered Sparks in Vancouver, Canada

Shannon Ha – Looking Outwards 07

Photo taken from jevbratt.com

‘Migration’ by Lisa Jevbratt is a data visualization image of the Internet. Each pixel represents 256 IP addresses and the different positions, size, color of the pixel blobs represents the amount of websites. This database of Websites was created by searching for Websites in the same IP addresses three times throughout 1999, 2001, 2004. The patterns in these images reveal  both the search process and information about the Internet and the Web. What I admire most about this piece of work is how it shows change over time in our ‘technology carbon footprint’ through the way the visual representations intensify which goes to show how dependent we have become on The Web. It is also very interesting how we can click into the blobs which would link and redirect you to the Website IP address, this way, the data visualized isn’t only presented on a surface level, but also lets us interact with it.

Carly Sacco – Looking Outwards – 07

7 Sets Venn Diagram is a creative visual by Santiago Ortiz that replicates the color wheel in a way that represents different mixtures of colors. He was inspired by Newton’s theories on light and color spectrum and used the actual colors instead of numbers. Ortiz created the wheel so that on Side A, there are little circles that when you hover your mouse over the names of the colors appear in the bottom. On Side B, the mandala consists more of filled in sections, but similarly has the names of the hues shown after you hover over the color. 

Santiago Ortiz is the Head at Moebio Labs which consists of data visualization developers and designers. Ortiz also specializes in interactive information visualization which this project is an example of the type of work he may do in that field. 

Crystal-Xue-Project-07

sketch-135.js

//Crystal Xue
//15104-section B
//luyaox@andrew.cmu.edu
//Project_07


var nPoints = 100;
function setup() {
    createCanvas(480, 480);
}

function draw() {
    background(0);
    translate(width/2, height/2);
    drawEpitrochoid2();
    drawHeart();
    drawEpitrochoid();
}


function drawEpitrochoid2() {

    //geometry rotation
    rotate(map(mouseX, height, 0, TWO_PI, 0));

    //color gradiant
    var from = color(208, 16, 76);
    var to = color(0, 137, 167);
    var cH = lerpColor(from, to, map(mouseY, 0, width, 0 , 1));
    stroke(255);
    strokeWeight(0.2);
    fill(cH);

    //geometry parameters
	var a = map(mouseX, 0 , width, 50, 200);
    var b = a/30;
    var h = map(mouseY,0, height, 100, 0);

    //plotting geometry
	beginShape();
	for (var i = -1; i < 100; i ++) {
		var t = map(i, 0, 100, 0, TWO_PI);
        x = (a+b)*cos(t)-h*cos(((a+b)/b)*t);
        y = (a+b)*sin(t)-h*sin(((a+b)/b)*t);
		vertex(x, y)
	}
	endShape();
}

function drawHeart(){

    //stop heart shapes from rotation
    rotate(map(mouseX, height, 0, 0, TWO_PI));
    push();
    noStroke();
    fill(255,50);

    //size
    var h = map(mouseY, 0, height, 0, 5);

    //for how many layers of heart shapes
    for (var z = 1; z < 8; z++) {

        //plotting geometry
        beginShape();
        for (var i = 0; i < nPoints; i++) {
            var t = map(i, 0, nPoints, 0, TWO_PI);
            //heart equation
            x = 16 * pow(sin(t),3);
            y = -13 * cos(t)+ 5 * cos(2 * t) + 2 * cos(3 * t) + cos(4 * t);
            vertex(x*z*h,y*z*h);
        }
        endShape(CLOSE);
    }
}

function drawEpitrochoid() {

    //geometry rotation
    rotate(map(mouseY, 0, height, 0, TWO_PI));

    //color gradiant
    var from = color(178, 43, 206);
    var to = color(247, 217, 76);
    var cH = lerpColor(from, to, map(mouseX, 0, width, 0 , 1),100);
    stroke(cH);
    strokeWeight(1);
    noFill();

    //geometry parameters
    var a = map(mouseX, 0 , width, 50, 200);
    var b = a/20;
    var h = map(mouseY,0, height, 50, 200);

    //plotting the geometry
	beginShape();
	for (var i = -1; i < 100; i ++) {
		var t = map(i, 0, 100, 0, TWO_PI);
        x = (a+b)*cos(t)-h*cos(((a+b)/b)*t);
        y = (a+b)*sin(t)-h*sin(((a+b)/b)*t);
		vertex(x, y)
	}
	endShape();
}

This project is very intriguing to me because I got to explore the artistic value of math and geometry in a larger span.

state-01
state-02

Carly Sacco – Project 07 – Curves

sketch

//Carly Sacco
//Section C
//csacco@andrew.cmu.edu
//Project 07 - Composition with Curves

var points = 200 //number of points
// for an episprial this will be sections
//the equation for an epispiral
//r = a sec (ntheta)
function setup() {
	createCanvas(480, 480);
}

function draw() {
	background(186, 112, 141);
	//calling the curve functions
	drawCraniodCurve1();
	drawCraniodCurve2();
}
	
function drawCraniodCurve1() {
var x;
var y;
var r;
var a = map(mouseX, 0, width, 0, width / 2); //makes the first epispiral relate to mouseX
var c = map(mouseY, 0, height, 0, height / 2); //makes the second epispiral relate to mouseY
var b = a / 5;
var p = 100;
var theta;

	//calling the curve functions to be drawn
	push();
	translate(width / 2, height / 2);
	fill(158, 200, 222); //blue
	beginShape();
	for (var i = 0; i < points; i += 1) {
		theta = map(i, 0, points, 0, TWO_PI);
		r = (a * (1 / cos((i + points) * theta))) //epispiral equation
		x = r * cos(theta);
		y = r * sin(theta);
		vertex(x, y);
	}
	endShape(CLOSE);
	pop();
}

function drawCraniodCurve2() {
	push();
	translate(width / 2, height / 2);
	fill(255, 77, 77); //red
	beginShape();
	for (var i = 0; i < points; i += 1) {
		var c = map(mouseY, 0, height, 0, height / 2);
		theta = map(i, 0, points, 0, TWO_PI);
		r = (c * (1 / cos((i + points) * theta))) //epispiral equation
		x = r * cos(theta);
		y = r * sin(theta);
		vertex(x, y);
	}
	endShape(CLOSE);
	pop();
}


For this project, I at first was trying to create an image more similar to a typical spirograph. However, after choosing to work with the epispiral, I liked how it almost looked like shattered glass. It reminded me of a comic strips and when an action was done there would be action bubbles. I then chose to animate it similarly to a “POW” action that could be drawn in the comics. Therefore, I overlayed the original epispiral with another with colors that could seem comic book like.

Katrina Hu – Project 07 – Curves

sketch_project07

/*Katrina Hu
15104-C
kfh@andrew.emu.edu
Project-07*/

var nPoints = 100;

function setup() {
    createCanvas(480, 480);
    background(0);
}

function draw() {
    push();
    translate(width/2, height/2);
    drawHypotrochoid();
    drawAstroid();
    pop();

}

function drawHypotrochoid() {
    var x;
    var y;
    //mouse used to change color
    var r = constrain(mouseX, 0, 255);
    var g = constrain(mouseY, 0, 255);
    var b = constrain(mouseY, 200, 255);
    //stroke appearance
    stroke(r, g, b);
    strokeWeight(1);
    noFill();
    //hypotrochoid equation
    var a = map(mouseX, 0, 600, 0, 300);
    var b = 10
    var h = map(mouseY, 0, 600, 2, 105);
    beginShape();
    for (var i = 0; i < nPoints; i++ ) {
        var angle1 = map(i, 0, nPoints, 0, TWO_PI);
        //equation of hypotrochoid
        x = (a - b) * cos(angle1) + h * cos((a - b) * (angle1 / b));
        y = (a - b) * sin(angle1) - h * sin((a - b) * (angle1 / b));
        vertex(x, y);
    }

  endShape();
}

function drawAstroid() {
    //mouse used to change color
    var r = constrain(mouseX, 200, 255);
    var g = constrain(255, mouseY/4, 50);
    var b = constrain(mouseY, 200, 255);
    //stroke appearance
    stroke(r, g, b);
    strokeWeight(2);
    noFill();
    //asteroid equation
    var a = int(map(mouseX, 0, width, 4, 10));
    var b = int(map(mouseX, 0, width, 0, 100));
    beginShape();
    for (var i = 0; i < nPoints; i++){
        angle1 = map(i, 0, nPoints, 0, TWO_PI);
        //equation of Astroid
        x = (b / a) * ((a - 1) * cos(angle1) + cos((a - 1) * angle1));
        y = (b / a) * ((a - 1) * sin(angle1) - sin((a - 1) * angle1));
        vertex(x,y);
    }
    endShape();

}


In my project I used a Hypotrochoid and an Asteroid. I decided to use my mouse to play around with the RGB values, which change depending on mouseX and mouseY. The project has a large Hypotrochoid on the outside with the Asteroid on the inside.

I decided to let it draw over itself, as it adds more curves when you move the mouse. I thought it added a cool layering effect where you could see all the colors on top of one another.

Overall, the project was fun to do as I learned a lot about experimenting with the different curves and parametric equations.

The starting Hypotrochoid curve
The curve layered over itself