Ammar Hassonjee – Project 06 – Abstract Clock

sketch

/* Ammar Hassonjee
   Section C
   ahassonj@andrew.cmu.edu
   Project 06 - Abstract Clock
   */

function setup() {
    createCanvas(480, 480);
}

function draw() {
    background(0, 0, 30);
    // Time generation
    var h = hour();
    var m = minute();
    var s = second();
    var mappeds = map(s, 0, 59, 33, width - 33);
    var angle = 0;

    //Drawing the hour mountain that grows taller to represent the hour from 1 to 24
    stroke(0, 0, 60);
    strokeWeight(2);
    for (i = 1; i < 25; i++) {
        line(0, height - 15 * i, 480, height - 15 * i);
    }
    noStroke();
    fill(120);
    triangle(0, height, width / 4, (height - 15) - 15 * h, width / 2, height);

    // Drawing the minute stars
    var starx = 0;
    var stary = 0;
    var count = [];
    var arrayCount = 0;
    for (var i = 0; i < 60; i++) {
        count.push(i);
    }

    // For loop that generates 60 stars with minute star being highlighted
    for (let a = 0; a < 20; a += 2) {
        for (let i = 1; i < 7; i++) {
            if (arrayCount == m) {
                fill(255);
                ellipse(width / 2.3 + i * 40, a * 20 + 100, 20, 20);
            }
            else {
                fill(230, 233, 178);

            }
            if (i % 2 == 0 & arrayCount !== m) {
                ellipse(width / 2.3 + i * 40, a * 20 + 105, 10, 10);

              }
            else if (arrayCount !== m){
                ellipse(width / 2.3 + i * 40, a * 20 + 95, 10, 10);

              }
              arrayCount += 1;
                }
            }


    // Drawing the second shooting star at the top
    fill(240, 235, 190);
    var x = [mappeds, mappeds + 11, mappeds + 33, mappeds + 19, mappeds + 21, mappeds, mappeds - 21, mappeds - 19, mappeds - 33, mappeds - 11];
    var y = [18, 37, 43, 60, 82, 73, 82, 60, 43, 37];
    beginShape();
    for (var i = 0; i < x.length; i++) {
        vertex(x[i], y[i]);
    }
    endShape();
    fill(190);
    // Drawing streaks that follow the star
    triangle(mappeds - 35, 45, mappeds - 30, 50, mappeds - 180, 53);
    triangle(mappeds - 35, 60, mappeds - 30, 65, mappeds - 180, 57);
}

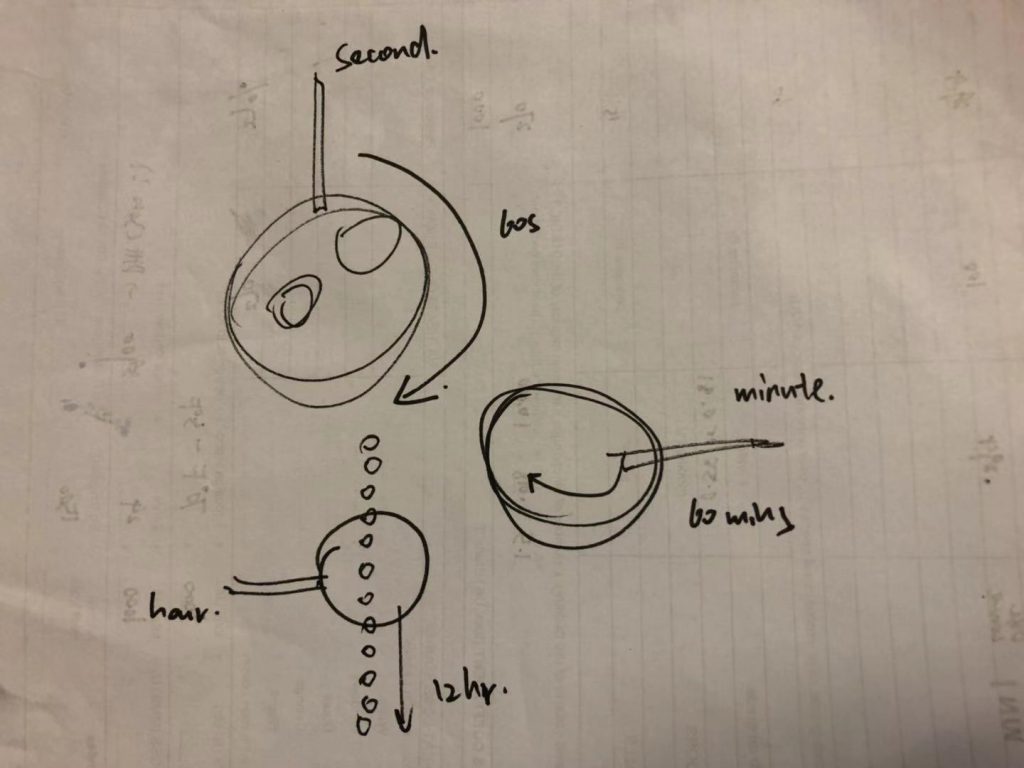
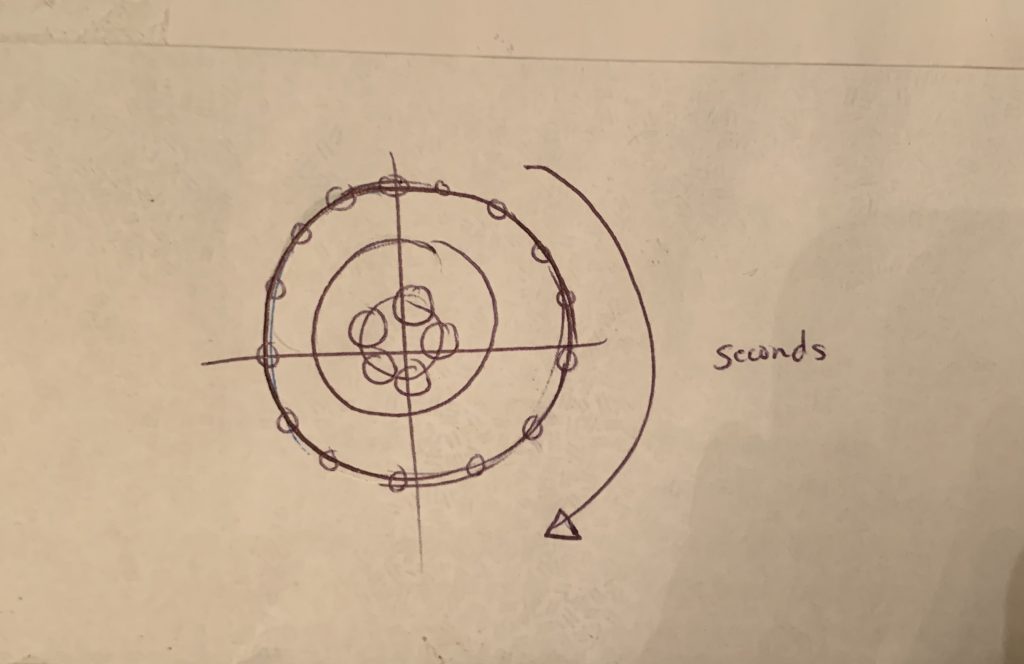
My inspiration for this project came from my fondness for the stars and astronomy. I sought to represent my clock using elements of nature and the sky by using the mountain as an indicator for the hour. Then I used a series of small stars to indicate the minutes due to their repetitive nature, and then finally a shooting star to indicate seconds since its movement corresponds with time passing by.

Paul Greenway – Looking Outwards – 06

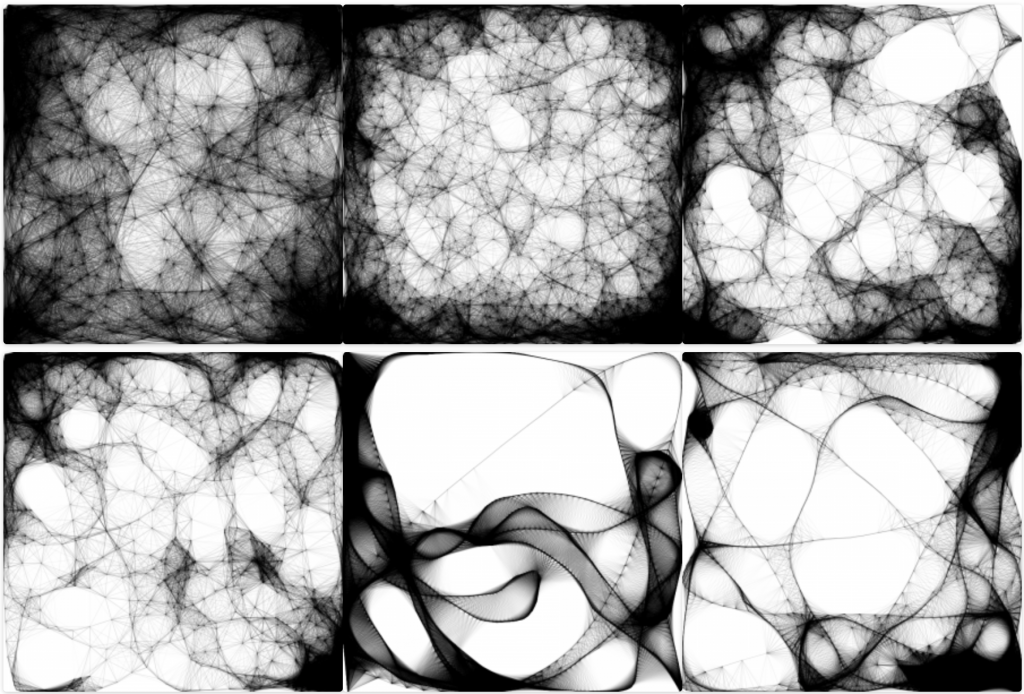
Random Lissajous Webs by Keith Peters

This art piece by generative artist Keith Peters is called Random Lissajous Webs. Peters makes use of Adobe Flash to code abstract generative art with this project specifically exploring the concept of random elements influencing the design. To create this set of images, Peters created code to generate a web of lissajous curves that used random velocity inputs which each resulted in a unique variation of the web.

I thought this project demonstrated the potential of random numbers when creating generative art with code. While initially the idea of randomness seems to go against often careful considerations and planning that typically goes into design, it can prove to be a great way of adding an element of unpredictability to the art. By using these randomly generated velocities in each curve, Peters was able to create a diverse set of images each with their own distinct feel while still clearly looking like they had been generated by the same base script.

Set of webs each with different curve velocities

Sewon Park PO-06

sketch

//Sewon Park
//sewonp@andrew.cmu.edu
//Section B
//Project-06

function setup() {
    createCanvas(400, 400);
    text("p5.js vers 0.9.0 test.", 10, 15);
    angleMode(DEGREES);
}

function draw() {
background(220);

var H = hour();
var M = minute();
var S = second();

fill(255,255,100);
ellipse(320,320,120,120); //Reference circle around second circle
fill(S*(4.25),S*(4.25),S*1.7); //Second circle changes color to match the reference Circle
ellipse(320,320,S*2,S*2); //Second circle grows to match the reference circle

fill(0,0,255);
ellipse(200,200,120,120); //Reference circle around minute cricle
fill(0,0,M*(4.25)); //Minute circle changes color to match the reference circle
ellipse(200,200,M*2,M*2); //Minute circle grows to match the reference circle

fill(255,0,0);
ellipse(80,80,120,120); //Reference circle around hour circle
fill(H*(4.25),0,0); //Hour circle changes color to match the reference circle on a 24 hour scale
ellipse(80,80,H*5,H*5); //Hour circle grows to match the reference circle on a 24 hour scale

push();
noStroke();
fill(255,255,0);
translate(width/2,height/2);
rotate(S*(6));
rotate(-90);
ellipse(85, 0, 50, 50);
pop(); //Yellow circle rotating to match second
    
push();
noStroke();
fill(0, 0, 255)
translate(width/2,height/2);
rotate(M*(6));
rotate(-90);
ellipse(80, 0, 40, 40);
pop(); //Blue Circle rotating to match minute
    
push();
noStroke();
fill(255, 0, 0);
translate(width/2,height/2);
rotate(H*(15)); //on a 24 hour scale
rotate(-90);
ellipse(75, 0, 30, 30);
pop(); //red circle rotating to match hour
   

}

For the abstract clock assignment, I wanted to show how as time passes, your day becomes “full”. As such I put base ellipses that represent the entirety of time (by seconds, minutes, and hours). As such, I used 24 hours as increments as 24 hours represents the entire day. Then, I put ellipses that grow and changes color as time passes to eventually become the base circles. I also created ellipses that spun just as the clock would.

Ankitha Vasudev – Project 06 – Abstract Clock

sketch

//Ankitha Vasudev
//ankithav@andrew.cmu.edu
//Section B
//Project 06

//global variables 
var r = 148; // color of background
var g = 222;
var b = 255;
var r1 = 255; // color of starfish
var g1 = 130;
var b1 = 180;
var r2 = 120; // color of seaweed
var g2 = 200;
var b2 = 100;
var fishy = 200; //y position of fish 

var x = [50, 65, 70, 62, 65, 50, 35, 39, 30, 45];
var y = [365, 372, 375, 380, 395, 385, 395, 380, 375, 370];

function setup() {
    createCanvas(400, 400); 
}

function draw() { 

    // Current Time
    var H = hour();
    var M = minute();
    var S = second();

    // Changes background color based on 8-hour periods 
     if (H >= 0 & H <= 8) {
        background(r, g, b);
    } else if (H > 8 & H < 16) {
        background(r-50, g-50, b-20);
    } else if (H >= 16 & H <= 24) {
        background(r-150, g-150, b-50);
    }

    //position of fish according to seconds
    fishx1 = map(S, 0, 59, 0, width+110);
    fishx2 = map(M, 0, 59, width-20, -40);
    fishx3 = map(H, 0, 23, width-20, -30);

    //star color changes every second 
    //becomes lightest at the end of each minute
    r1 = map(S, 0, 59, 200, 255);
    g1 = map(S, 0, 59, 50, 200);
    b1 = map(S, 0, 59, 50, 200);
    
    //changes seaweed color every minute 
    r2 = map(M, 0, 59, 150, 0);
    b2 = map(M, 0, 59, 120, 0);

    //fish moving every second
    noStroke();
    fill(236, 185, 0);
    ellipse(fishx1-55, fishy, 90, 30);
    triangle(fishx1-95, fishy, fishx1-110, fishy-20, fishx1-110, fishy+20);

    //fish moving every minute
    fill(217, 180, 123);
    ellipse(fishx2+20, fishy-100, 40, 15);
    triangle(fishx2+30, fishy-100, fishx2+40, fishy-90, fishx2+40, fishy-110);

    //fish moving every hour
    fill(111, 72, 2);
    ellipse(fishx3, fishy+100, 50, 15);
    triangle(fishx3+20, fishy+100, fishx3+30, fishy+95, fishx3+30, fishy+105);

    //seaweed
    for (i = 0; i < width+5; i += 5) {
        fill(r2, g2, b2);
        triangle(i-5, height-30, i, height-60, i+15, height-30);
    }

   //sand 
    fill(240, 210, 142);
    rect(0, height-40, width, 50);

    //starfish
    fill(r1, g1, b1);
    beginShape();
    for (var i = 0; i < 10; i++) {
        vertex(x[i], y[i]);
    endShape();
}
    //text displaying time as reference 
    fill(100);
    text("Hour: " + H, 10, 20);
    text("Minute: " + M, 10, 35);
    text("Second: " + S, 10, 50);
}

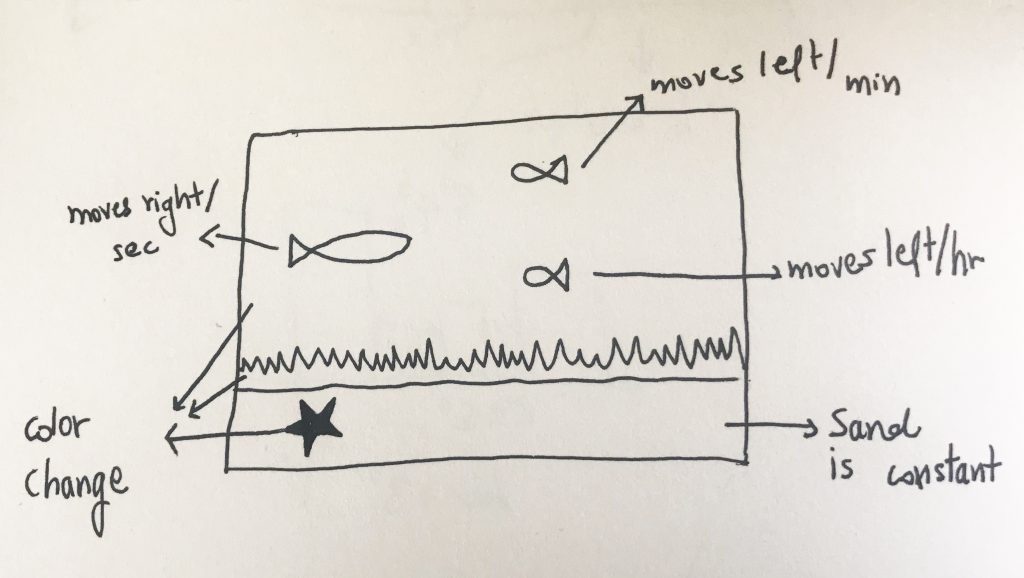
For this project I wanted to create an animation that included changing positions and colors according to the time. Each fish moves at a different pace – one every second, one every minute and one every hour. The starfish changes color every second and camouflages with the sand by the of every minute. The seaweed changes color every minute and is the greenest at the end of every hour. The color of the sea varies at 8-hour intervals to show the time of the day(morning, afternoon or evening). 

Xu Xu – Looking Outwards – 06

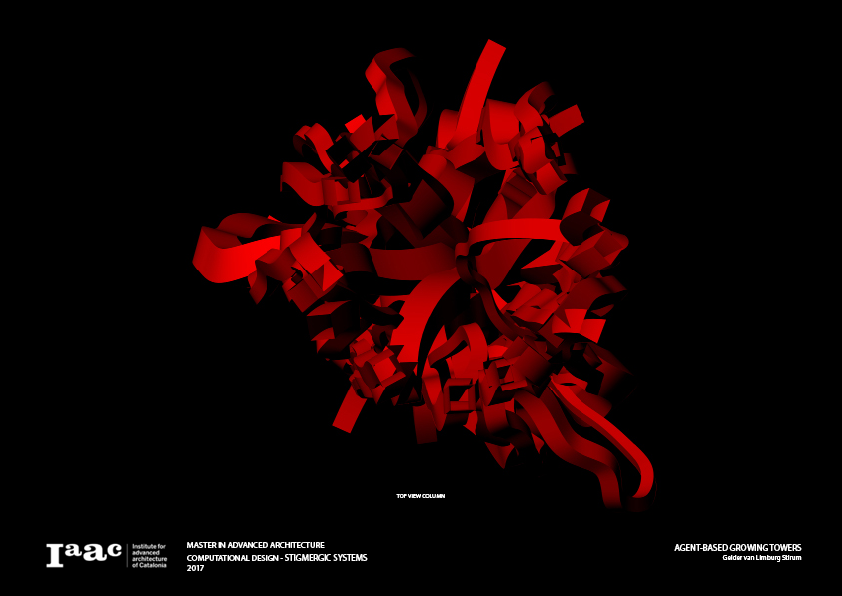
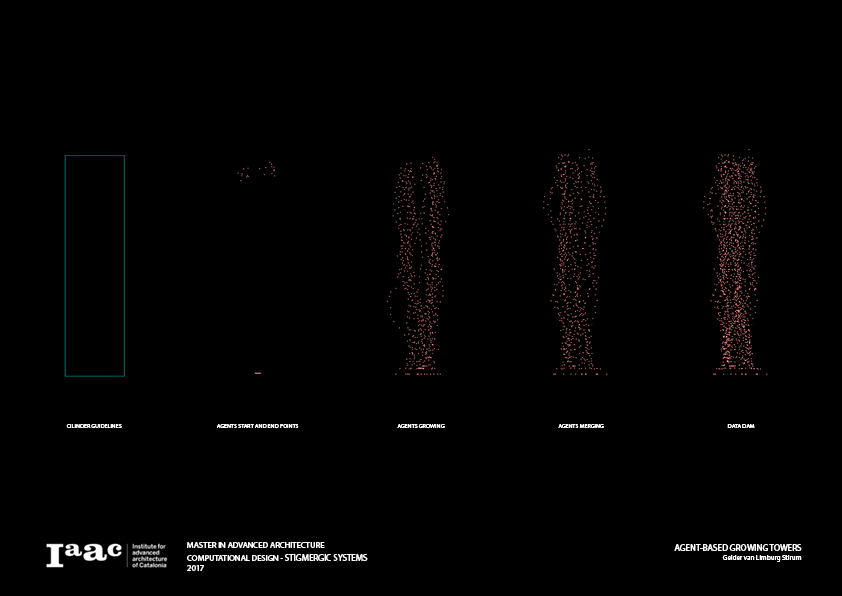
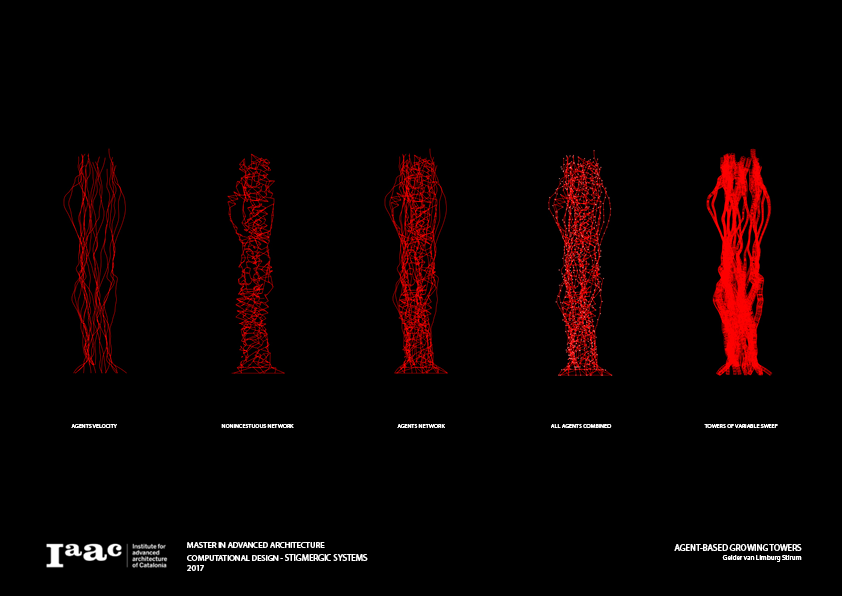
The stigmergic system is an agent-based growing tower created by Institute for advanced architecture of Catalonia. Through the use of this multi-agent-based system in a stigmergic environment, a column is created. The column starts at designated coordination points and moves to certain endpoints (or targets) following specific paths (or desired velocity). With the use of grasshopper code, the agents are guided through ‘steering’ so they move within the cylindrical shape. The Data Dam collects the agents with the network between adjacent points.

Afterwards, the velocity lines and network lines become visible, and the ‘variable-sweep’ makes the tower apparent. The combination of those towers creates the column, which happens in a bottom-up growing manner. The data inputs simply guide the agents, but the output is the randomness combined with steering and velocity. I admire the use of randomness in creating structures, which I can envision being applied to future architectural designs. Using randomness as part of our architectural creation is beginning to be introduced to the world.

A03 GVanlimburgstirum

Monica Chang – Looking Outwards – 06

There’s always a fear that the use of random data can imply that the creator has no sense of intentionality or ability to make a decision. However, designers have been able to develop a way that randomness becomes more of a generative tool that helps overcome the limits of the artists’ imaginations than an arbitrary statement.

Aaron Tobey, the creator of the project below, agrees with this idea as he specifically states that integrating randomness in design does not “eliminate” the artist, but rather “displaces” the artist in the process of the creation. With this project, Tobey was required to create a pseudo random number generator using the “register and tap” method to also create a design. He was also required to consider the idea of “working” as a set of logical operations rather than watching what the generator comes up with. Furthermore, he creates a frame-by-frame animation with this collection of randomized, data-driven imagery.

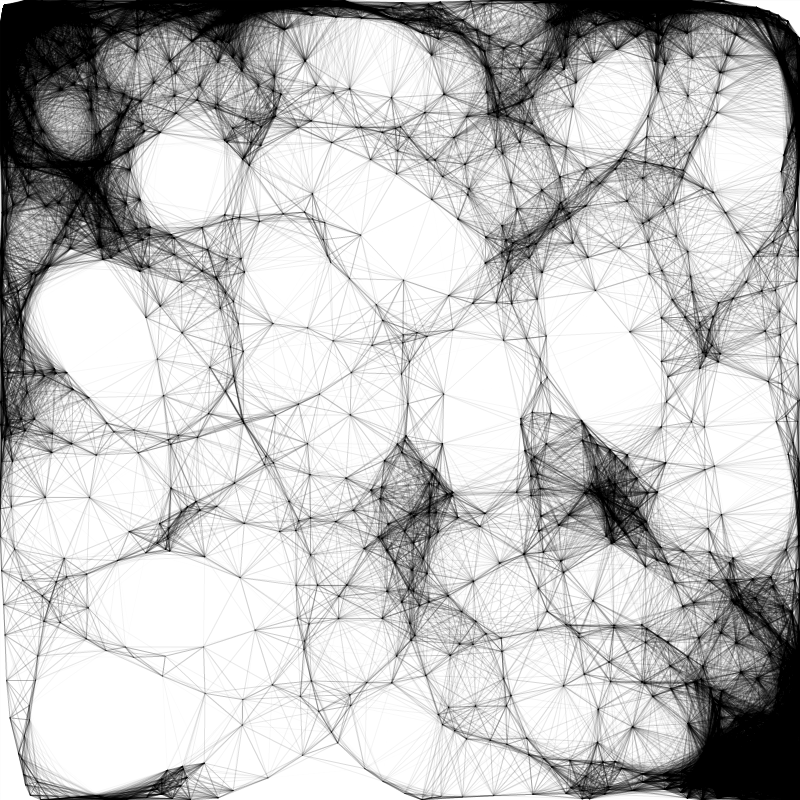
Coding Architecture Project: Randomness by Aaron Tobey
A closer look into a single frame of Tobey’s Randomness project.

The amount of thought and registration that was required for this project is what intrigued and satisfied me the most. Integrating randomness within art or a design was something that was always tricky in the notion of producing an elaborate creation. Many believe that when a creator utilizes randomness in their artwork, they either lack in depth or purpose and is nothing but made of surface. However, with this project, it helps build a visual piece of evidence that even randomness can open the creator’s option of forming a design that can be composed within the artist’s visual field.

Sean Meng-Project 06-Abstract Clock

hmeng-project 06

//Sean Meng
//Section C
//hmeng@andrew.cmu.edu
//Project-06-Abstract Clock

function setup() {
    createCanvas(500, 500);   
}

function draw() {
    background(214, 200, 224);
//define current time   
    var S = second();
    var M = minute();
    var H = hour();
    var round = 2 * PI;
    var angle = 0;
//convert time value to radian angles
    var ratioS = S / 60;
    var ratioM = M / 60;
    var start0 = 0;
    var start = PI + HALF_PI;
    var size1 = 200;
//diameters of the arc
    var D1 = 200;
    var D2 = 220;
    var D3 = 170;
    var D4 = 120;
    var D5 = 80;
    
    noStroke();
//Second plate graphics
    fill(255, 216, 224);  //Light pink
    ellipse(180, 180, size1 * ratioS, size1 * ratioS);
    fill(255, 186, 224);  //Pink
    ellipse(210, 150, 100 * ratioS, 100 * ratioS);
    fill(255, 136, 204);  //Dark pink
    ellipse(150, 220, 55 * ratioS, 55 * ratioS);
//Second inner ring
    stroke(200, 64, 150);  //Magenta
    strokeWeight(15 * ratioS);
    noFill();
    arc(180, 180, D1, D1, start, start + round * ratioS);
//Second outter ring
    stroke(255);
    strokeWeight(4 / 60 * S);
    arc(180, 180, D2, D2, start, start + round  * ratioS);
//Second starting line
    fill(255);
    rect(175, 0, 5, 90);

//Minute plate
    stroke(255, 242, 255);  //Light purple
    strokeWeight(5);
    noFill();    
//Minute ring1
    arc(350, 310, D3, D3, start0, round);
    stroke(255, 215, 85);  //Yellow
    strokeWeight(30 * ratioM);
    arc(350, 310, D4, D4, start0, round * ratioM);
//Minute ring2    
    stroke(255, 235, 135);  //Light yellow
    strokeWeight(10 * ratioM);
    arc(350, 310, D4, D4, start0, round * ratioM); 
//Minute starting line
    noStroke();
    fill(255, 242, 255);
    rect(425, 305, 100, 10);

//Hour plate
    fill(255);
    ellipse(200, 390, D5, D5);

//12 Hour operator
    if(H > 12) {
        for(var i = 0; i < H - 12; i += 1){
            fill(151, 59, 227);
            ellipse(200, 320 + i * 15, 10, 10);
        }
    } else {
        for(var i = 0; i < H; i += 1){
            fill(151, 59, 227);
            ellipse(200, 320 + i * 15, 10, 10);
        }
    }

}

In this project, I explores the representation and abstraction of the clock by engaging geometries and colors. And visualizing the variation of time in a more creative way.

Joseph Zhang – Project 06 – Abstract Clock

sketch

// Joseph Zhang
// Section E
// haozhez@andrew.cmu.edu
// Assignment-06C: Simple Clock

function setup() {
    createCanvas(480, 480);
}


//translates everything
function draw() {
    // to make sure hour() never goes past 13
    var hr = hour();
    if(hour() > 12) {
        hr = hour() - 12;
    }

    // push and eventual pop so that I can position the clock
    push();
    translate(228 + mouseX / 20, 228 + mouseY / 20);
    drawClock();     
    pop();

    // shows the time
    noStroke();
    fill(map(mouseX, 0, width, 150, 255)); 
    
    text(nf(hr, 2, 0) + ":" + nf(minute(), 2, 0) + ":" + nf(second(), 2, 0), width - 70, height - 30, 100, 30);
}

//draws everything 
function drawClock(){
    threeSixty = 2 * PI;    
    background(30);
    strokeWeight(0);
    
    // radial grid
    for ( i = 1; i < 13; i++) {
        stroke(68);
        strokeWeight(1);
        line(0, 0, 600 * cos(threeSixty * i / 12), 600 * sin(threeSixty * i / 12));
        stroke(0);
    }

    //background circles
    stroke(0);
    fill(0, 0, 0, 80);
    ellipse(0, 0, 300, 300);
    ellipse(0, 0, 140, 140);


    //displays millisecond (smaller circle)
    // stroke(255,255,255, 50);
    strokeWeight(2);
    ellipse(200 * cos(threeSixty * millis() / 60000 - (PI / 2)), 200 * sin(threeSixty * millis() / 60000 - (PI / 2)), 30, 30);
    ellipse(-200 * cos(threeSixty * millis() / 60000 - (PI / 2)), -200 * sin(threeSixty * millis() / 60000 - (PI / 2)), 30, 30);

    // displays minutes (bigger circle)
    strokeWeight(2);
    stroke(255,255,255, 190);
    line(70 * cos(threeSixty * minute() / 60 - (PI / 2)), 
        70 * sin(threeSixty * minute() / 60 - (PI / 2)),
        700 * cos(threeSixty * minute() / 60 - (PI / 2)),
        700 * sin(threeSixty * minute() / 60 - (PI / 2)));
    line(-70 * cos(threeSixty * minute() / 60 - (PI / 2)), 
        -70 * sin(threeSixty * minute() / 60 - (PI / 2)),
        -700 * cos(threeSixty * minute() / 60 - (PI / 2)),
        -700 * sin(threeSixty * minute() / 60 - (PI / 2)));
    fill(0,0,0,255);
    ellipse(70 * cos(threeSixty * minute() / 60 - (PI / 2)), 70 * sin(threeSixty * minute() / 60 - (PI / 2)), 50, 50);
    ellipse(-70 * cos(threeSixty * minute() / 60 - (PI / 2)), -70 * sin(threeSixty * minute() / 60 - (PI / 2)), 50 , 50);
    strokeWeight(1);

    //displays seconds (smaller circle)
    stroke(255, 255, 255, 100);
    strokeWeight(2);
    line(150 * cos(threeSixty * second() / 60 - (PI / 2)),
        150 * sin(threeSixty * second() / 60 - (PI / 2)),
        500 * cos(threeSixty * second() / 60 - (PI / 2)),
        500 * sin(threeSixty * second() / 60 - (PI / 2)));
    line(-150 * cos(threeSixty * second() / 60 - (PI / 2)),
        -150 * sin(threeSixty * second() / 60 - (PI / 2)),
        -500 * cos(threeSixty * second() / 60 - (PI / 2)),
        -500 * sin(threeSixty * second() / 60 - (PI / 2)));
    ellipse(150 * cos(threeSixty * second() / 60 - (PI / 2)), 150 * sin(threeSixty * second() / 60 - (PI / 2)), 30, 30);
    ellipse(-150 * cos(threeSixty * second() / 60 - (PI / 2)), -150 * sin(threeSixty * second() / 60 - (PI / 2)), 30, 30);

    //displays hour
    strokeWeight(2);
    stroke(255, 255, 255, 230);
    line(0, 0, 
    30 * cos(threeSixty * (hour() / 12 + minute() / 720) - (PI / 2)),
    30 * sin(threeSixty * (hour() / 12 + minute() / 720)  - (PI / 2)));
    ellipse(0,0,10,10);
}

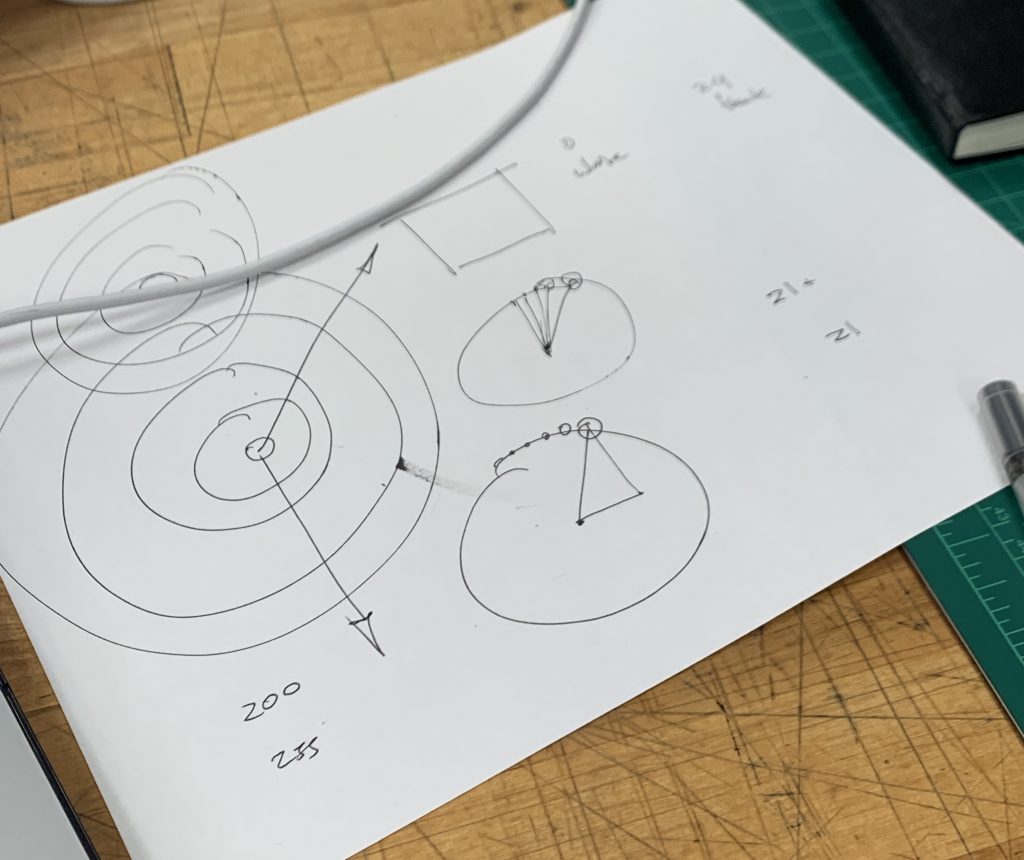
For this abstract clock, I really wanted to do something that grow out radially and moves in proportion to its time sequencing. I wanted to build something that gives the resemblance of a clock but doesn’t necessarily function entirely as one. This prompted me to utilize ellipses and to move them around the screen depending on their associated time measurement.

The wider you move out the ring, the more micro the time gets. The innermost ring represents hour while the black circle on the outside represents milliseconds. As you move from innermost ring to outermost ring, the opacity getter lighter and lighter until it becomes black (millisecond).

Siwei Xie – Looking Outwards 07

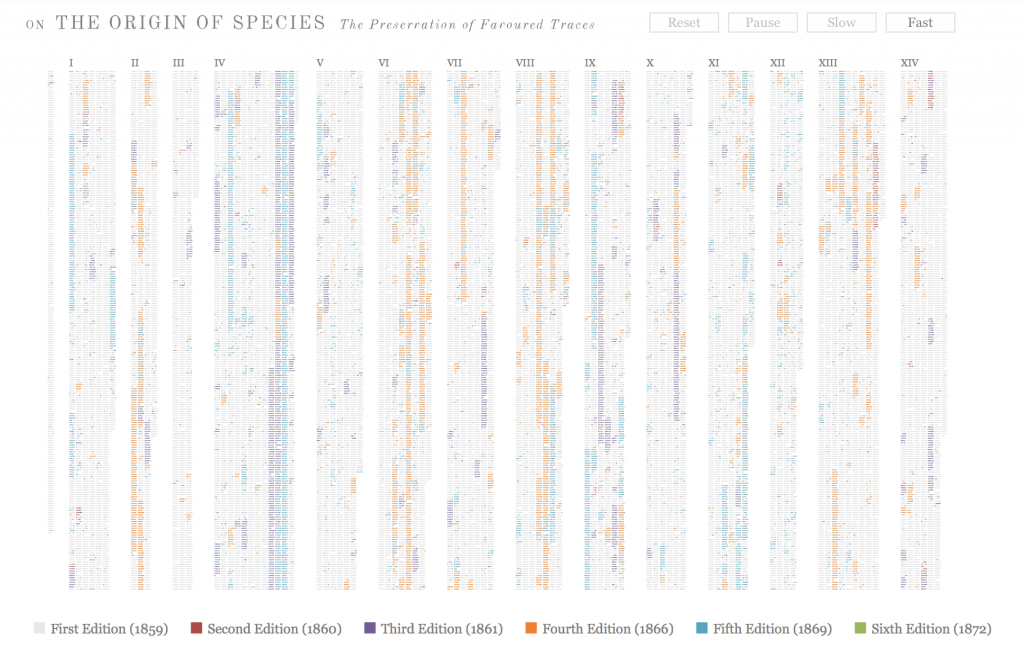
Ben Fry, Sept. 2009, Watching the evolution of the “Origin of Species”

Ben Fry created a dynamic presentation of Darwin’s multiple editions of “On the Origin of Species.” In the changes are refinements and shifts in ideas, including increasing the weight of a statement, adding details, or even a change in the idea itself. The artist uses different colors to depicts 6 different editions, and show the changes in animations. 

I admire how accessible and clear the presentation is. Darwin scholars are of course familiar with the evolution of “On the Origin of Species.” Yet the animations allow more audiences to view the changes directly, both on a macro-level as it animates, or word-by-word as they examine pieces of the text more closely. The artist might use drawing and coding software such as p5.js to draw the dots, then animate the map.

Creator’s artistic sensibility manifests by harmonize the shapes and colors of the animation. The coordinates on the layouts are simple and clear, creating soothing changes in color when the animation progresses.

Original source here.

Mihika Bansal – Project 06 – Abstract Clock

sketch

//Mihika Bansal 
//mbansal@andrew.cmu.edu 
//Section E 
//Project 5


function setup() {
    createCanvas(500, 500);
}
   
  
function draw() {
    
    push(); 
    background(250, 141, 98); // making my background canvas
    translate(width / 2, height / 2); 
    pop(); 

    var s = second(); 
    var m = minute(); 
    var h = hour();

    let sAngle = map(s, 0, 60, 0, 360); 
    let mAngle = map(m, 0, 60, 0, 360);
    let hAngle = map(h, 0, 24, 0, 360); 

    translate(width / 2, height / 2); 
    
    //drawing the second hand circle 
    fill(255);
    noStroke(); 
    push(); 
    for (var i = 0; i < s; i ++){
        rotate(radians(sAngle)); //creates a pattern based on the second that it is currently 
        ellipse(0, -210, 10, 10); 
    }
    pop(); 

    //drawing the minute hand circle 
    push();
    fill(178, 219, 213);
    for (var j = 0; j < m; j ++){
        rotate(radians(mAngle)); // creates a pattern based on what minute it is 
        ellipse(0, -135, 18, 18); 
    }
    pop(); 

    //the hour hand 
    push();
    fill(43, 97, 109);
    for (var k = 0; k < h; k ++){ 
        rotate(radians(hAngle)); //creates a pattern based on what hour it currently is, displays that number
        ellipse(0, -50, 25, 25); 
    }
    pop();
     
}

This project was very fun to create. Playing with animations based on time was very interesting. The patterns that formed through the integration of for loops and based on the number for minutes and seconds was very pleasing.

My sketch for the concept of the clock