Caroline Song-Project 07-Curves

sketch

//Caroline Song
//chsong@andrew.cmu.edu
//Section E
//Project 07-Curves

var nPoints = 800;

function setup (){
    createCanvas(480, 480);
}

function draw(){
    background(0);
    //calling functions
    drawHypotrochoid1();
    drawHypotrochoid2();
    drawHypotrochoid3();
}

function drawHypotrochoid1() {
    //Hypotrochoid
    //http://mathworld.wolfram.com/Hypotrochoid.html

    //setting variables for light pink hypotrichoid
    var x1 = constrain(mouseX, 0, width);
    var y1 = constrain(mouseY, 0, height);
    var a1 = 100;
    var b1 = map(mouseY, 0, 500, 0, width);
    var h1 = map(mouseX/10, 0, 500, 0, height);

    push();
    //light pink stroke
    noFill();
    stroke(251, 227, 255);
    strokeWeight(2);
    translate(width/2, height/2); //translate hypotrochoid to middle of canvas
    beginShape();
    for(var i = 0; i < nPoints; i++) {
        var t1 = map(i, 0, 100, 0, TWO_PI);
        x1 = (a1 - b1)*cos(t1) + h1*cos(((a1 - b1)/ b1) * t1);
        y1 = (a1 - b1)*sin(t1) - h1*sin(((a1 - b1)/ b1) * t1);
        vertex(x1, y1);
    }
    endShape(CLOSE);
    pop();

}

function drawHypotrochoid2() {
    //Hypotrochoid
    //http://mathworld.wolfram.com/Hypotrochoid.html

    //setting variables for pink hypotrichoid on the edges of canvas
    var x2;
    var y2;
    var a2 = 300;
    var b2 = 20;
    var h2 = constrain(mouseY/10, 0, height);

    push();
    noFill();
    stroke(237, 162, 250);
    strokeWeight(2);
    translate(width/2, height/2); //translate to middle of canvas
    beginShape();
    for(var i = 0; i < nPoints; i++) {
        var t2 = map(i, 0, 100, 0, TWO_PI);

        x2 = (a2 - b2)*cos(t2) + h2*cos(((a2 - b2)/ b2) * t2);
        y2 = (a2 - b2)*sin(t2) - h2*sin(((a2 - b2)/ b2) * t2);
        vertex(x2, y2);
    }
    endShape(CLOSE);
    pop();

}

function drawHypotrochoid3() {
    //Hypotrochoid
    //http://mathworld.wolfram.com/Hypotrochoid.html

    //setting variables for dark pink hypotrochoid
    var x3;
    var y3;
    var a3 = 600;
    var b3 = 50;
    var h3 = mouseY;

    noFill();
    stroke(227, 92, 250);
    strokeWeight(4);
    translate(width/2, height/2); //translate to middle of canvas
    beginShape();
    for(var i = 0; i < nPoints; i++) {
        var t3 = map(i, 0, 100, 0, TWO_PI);

        x3 = (a3 - b3)*cos(t3) + h3*cos(((a3 - b3)/ b3) * t3);
        y3 = (a3 - b3)*sin(t3) - h3*sin(((a3 - b3)/ b3) * t3);
        vertex(x3, y3);
    }
    endShape(CLOSE);

}

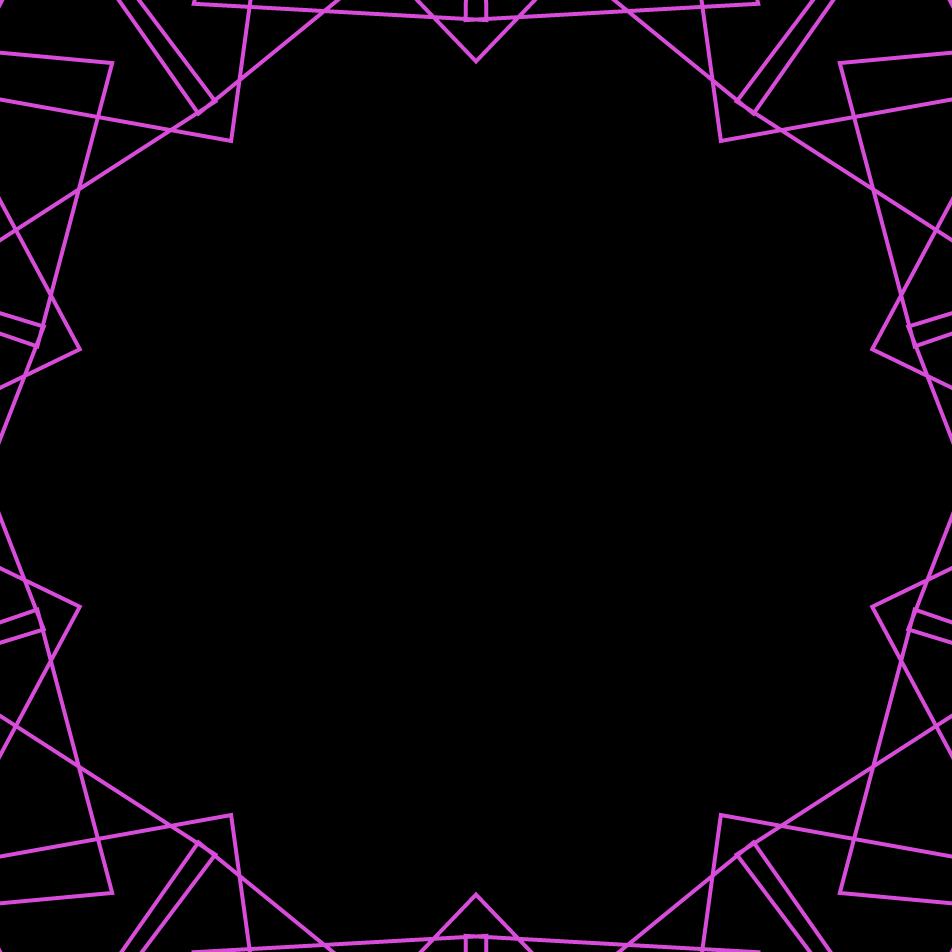
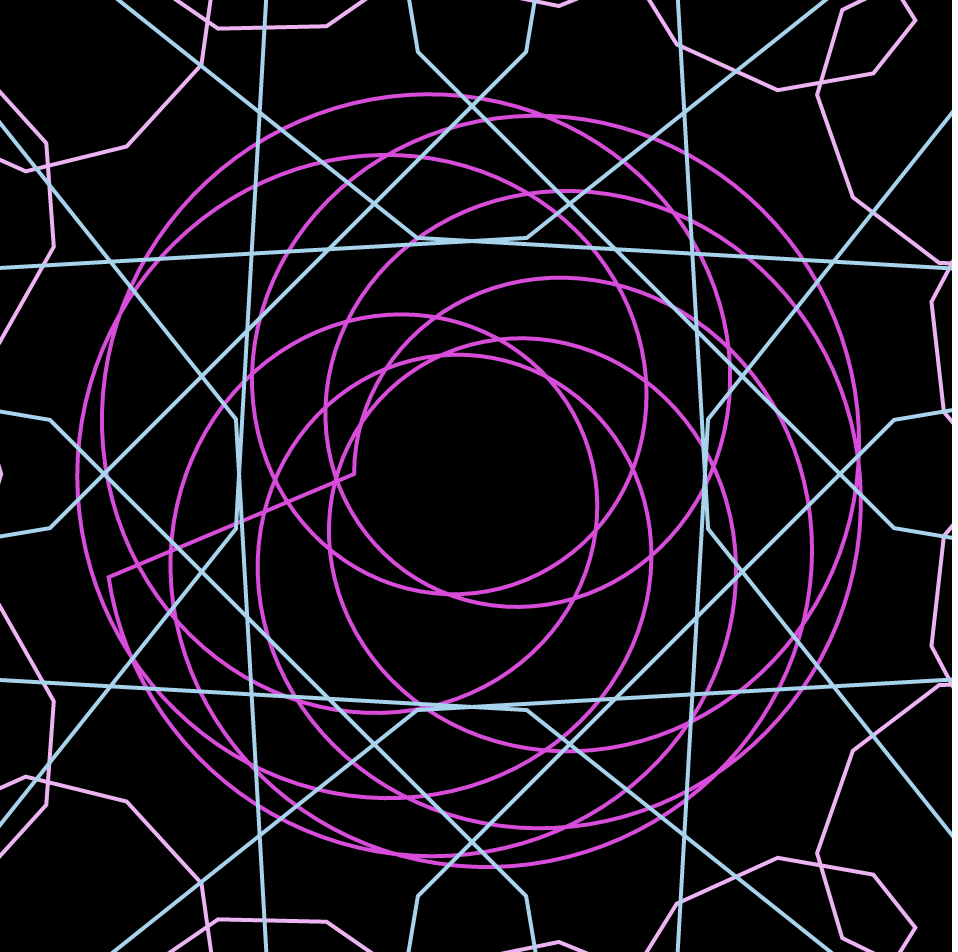
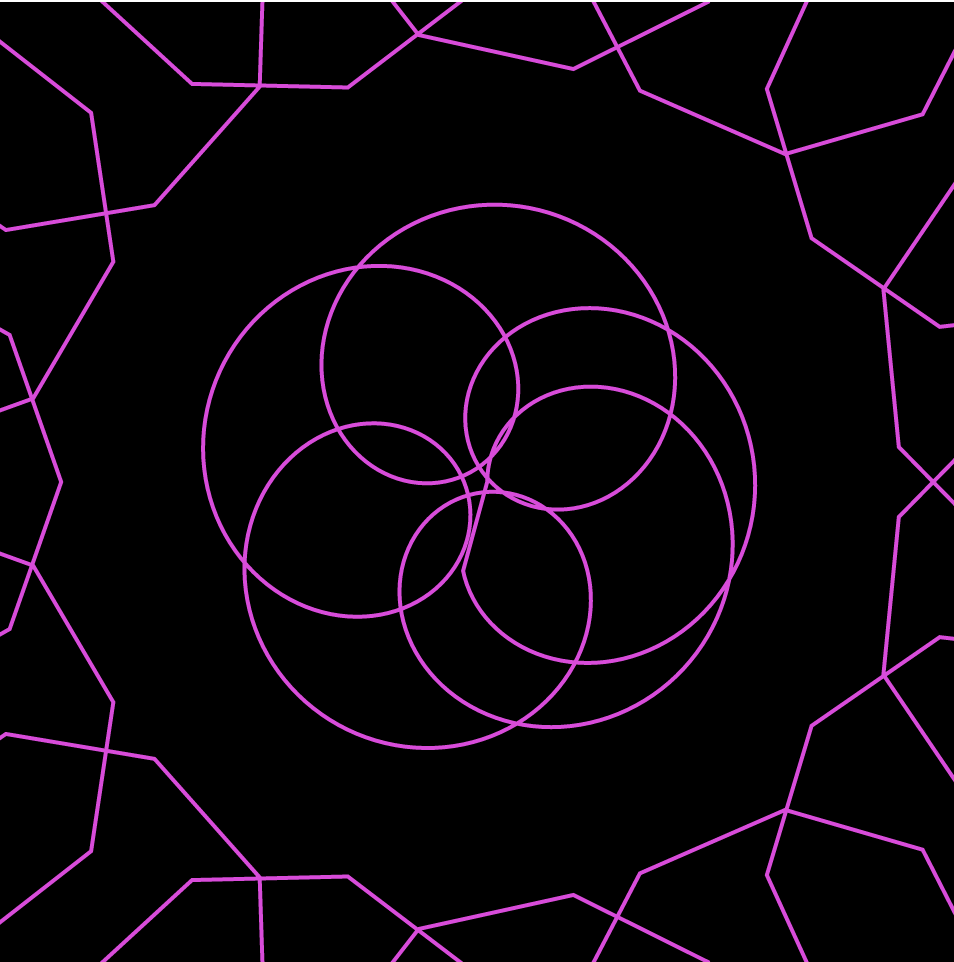
During the project, I didn’t know exactly what I was looking for. I spent a lot of time on the MathWorld site simply trying to decide what kind of curves to play with. I ended up playing with different epispirals and astroids before becoming intrigued with hypotrochoids. I started playing around with the equations itself, plugging in different numbers to simply experiments with how that affects the curve and the interaction it has with the canvas.

First iteration of my project
Playing around with different colors
Second iteration of my project

Caroline Song-Looking Outwards-07

Created by Nicholas Felton and Ryan Case in 2008, Daytum is a web application, as well as a phone app, developed to allow users to quickly capture any personal data and share that information with others. It communicates such information through custom chosen data visualizations, charts, as well as different colors to represent the user’s desired information.

Image result for daytum
A look into the Daytum app’s functions by Nicholas Felton and Ryan Case

I’m intrigued by this app because of the functions. The purpose of it being to display absolutely any information the user wants is interesting. Furthermore, the way the information is displayed is also up to the user. I think I am intrigued by the app because it all depends on the user and therefore, the way people use it will vary from user to user. I find it interesting that even though the app will still look coherent overall, because the fonts and the style of the layout will probably stay the same, it is still personal/customizable for each person. It is interesting because Felton and Case seems to be playing with the idea of having his design be both coherent but distinguishable for each person.

Though I am not entirely sure of the algorithms that went into this work, I assume there were algorithms that changed the written information that the users put into the systems to a base format of visual information, and from there, the users decide what the visuals look like, which would change which algorithm the app was working with.

I see both Felton and Case’s artistic sensibilities come out through this app because both of them are passionate about the different ways written data can be visualized, and because this is the purpose of Daytum itself, the app existing even shows Felton and Case’s interest in this subject of design.

Caroline Song – Project 06 – Abstract Clock

sketch

//Caroline Song
//Section E
//chsong@andrew.cmu.edu
//Project 06 - Abstract Clock

function setup (){
    createCanvas(480, 480);
}

function draw(){
    background(127, 227, 250);
    //calling current time values
    var S = second();
    var M = minute();
    var H = hour(); 
    var arcSize = 200;

    //fitting time values to arcs
    var mappedS = map(S, 0, 59, 180, 360);
    var mappedM = map(M, 0, 59, 180, 360);
    var mappedH = map(H, 0, 23, 180, 360);
    //outer ring for seconds
    angleMode(DEGREES);
    noFill();
    stroke(252, 177, 228);
    strokeWeight(30);
    arc(width/2, height/2, arcSize + 120, arcSize + 120, 180, mappedS);
    //middle ring for minutes
    noFill();
    stroke(250, 247, 100);
    strokeWeight(30);
    arc(width/2, height/2, arcSize + 60, arcSize + 60, 180, mappedM);
    //inner ring for hours
    noFill();
    stroke(0, 209, 24);
    strokeWeight(30);
    arc(width/2, height/2, arcSize, arcSize, 180, mappedH);

    //draw clouds
    fill("white");
    noStroke();
    //cloud1
    ellipse(45, height/2 + 75, 60, 60);
    ellipse(95, height/2 + 65, 95, 95);
    ellipse(130, height/2 + 60, 80, 80);
    ellipse(165, height/2 + 80, 60, 60);
    //cloud2
    ellipse(width/2 + 50, height/2 + 70, 75, 75);
    ellipse(width/2 + 100, height/2 + 70, 100, 100);
    ellipse(width/2 + 150, height/2 + 70, 85, 85);
    ellipse(width/2 + 175, height/2 + 95, 50, 50);
}

Initial sketch of clock design

For this project, I wanted to communicate time in a lighthearted manner. For all those times that people are stressed or in a bad mood when looking at time, I wanted to combat those feelings with an engaging and colorful depiction of time.

*the pink seconds arc makes a full 360 arc each time it reaches 60 seconds, but it’s only supposed to return back to 180 degrees and repeat, which it does in Sublime but not when I embed it into WordPress.

Caroline Song-Looking Outwards 06

Helen Frankenthaler was one of the most prominent American artists in the twentieth century, her style being Abstract Expressionism. The painting of hers I am analyzing is called Mountains and Sea, which is her most famous painting, created in 1952.

Image result for mountains and sea
Mountains and Sea by Helen Frankenthaler

With the creation of Mountains and Sea, Frankenthaler ushered in a new breakthrough in regards to American abstraction. She used a soak-stain technique, which requires the artist to thin out their paint using turpentine or kerosene, which allows the medium to seep through the canvas’ unprimed weaves.

I found this painting interesting because of the technique Frankenthaler used in order to achieve this look. While Jackson Polluck’s paintings, and a lot of other abstract artists depend on their own motion in order to create fluidity in their work, Frankenthaler used the paint to design such an organic feeling.

I am able to see Frankenthaler’s artistic sensibilities manifest through this technique where we see her trying to think differently than other abstract artists at the time while at the same time, still drawing inspiration from them. It is easy to see that she is truly trying to make her work her own.

I suppose there was no algorithm used in order to create this painting. The randomness of the paint and where it moves itself makes me believe there is no specific system and there is no way to fully control/predict what the painting was going to look like at the end.

Caroline Song – Project-05-Wallpaper

sketch

//Caroline Song
//chsong@andrew.cmu.edu
//Section E
//Project 05 - Wallpaper

var color1; 
var color2;

function setup() {
    createCanvas(600, 600);
    //Defining colors
    color1 = color(159, 233, 255);
    color2 = color(1, 95, 124);
    setGradient(color1, color2);
}


function draw() {
    noFill();
    stroke(255);
    strokeWeight(1);
    for (var y = 0; y <= 12; y++) {
        if (y % 2 == 0) {
            for(var x = 0; x <= width; x += 50) {
                triangle(0 + x, 50+(y*50), 25 + x, 0+(y*50), 50 + x, 50+(y*50));
            }
        }
        else {
            for(var x = 0; x <= width; x += 50) {
                triangle(-25 + x, 100+((y-1)*50), 0 + x, 50+((y-1)*50), 25 + x, 100+((y-1)*50));
            }
        }
    }
}

function setGradient(c1, c2) {
    //Creating blue gradient
    for(var i = 0; i <= height; i++) {
      var x1 = map(i, 0, height, 0, 1);
      var c3 = lerpColor(color1, color2, x1);
      stroke(c3);
      line(0, i, width, i);
    }

}

a quick sketch of some of the decisions I had to make for this project

For this wallpaper, I wanted to play around with colors so that my finished product would resemble something from the ocean or the beach. And so, I created a soft blue gradient. Overlaying that, I made a repeating pattern of triangles in a white color in order to keep the soft color palette I was aiming for.

Caroline Song – Looking Outwards 05

The 3D computer graphics image I chose depicts three ballerinas dancing outside while the sun is setting. I was first drawn to this image because of the way the image is made, by integrating triangles to carve out the forms. I thought it interesting the combination of using geometric, rigid shapes to describe a scene that is so airy and contains such natural forms.

I also admire this piece because of the different ways I can experience it, from both near and far. From afar, I cannot tell the triangles are making up the entire piece, and therefore, it looks like a painting or an image. But when I come up closer, I can see it is the triangles that are carving out the image, and therefore, I can experience the duality between geometric and natural forms.

Image result for am time the great destroyer
“Ballet” by Kai Lawonn and Tobias Günther

I suppose the algorithm used to create this piece of art had to do with the optimization of the triangles and the way each triangle is set to a single color, and together with all the other triangles, this creates the piece.

Another part of this piece that I am intrigued by is the artists’ use of when to show the outlines of the triangles and when to not. It seems that they made the choice to show the outlines in a gradient, as the far right showcases the lines most prominently and from there, as the viewer’s eyes move to the left, the lines fade. I believe this shows the artists’ artistic tendencies because the placement of the triangles themselves needed to be intentional and attractive, based on what the artists wanted to be shown. In this case, I think they wanted to show the light contrast from one end of the piece to the other, which is so prominent through the triangle outlines, and may not have been as noticeable otherwise.

Caroline Song – Project 04 – String Art

sketch

//Caroline Song
//chsong@andrew.cmu.edu
//Section E
//Project-04 

function setup (){
    createCanvas(400, 300);
}

function draw(){
    background("black");

    //blue lines on bottom left
    for(var i = 0; i < 300; i += 1.5) {
        stroke(161, 236, 255);
        strokeWeight(0.3);
        line(0, i * 5, i * 5, height);
    }

    //blue lines on top right
    for(var i = 0; i < 400; i += 1.5) {
        stroke(161, 236, 255);
        strokeWeight(0.3);
        line(width, i * 5, i * 5, 0);
    }

    //pink lines which turns in the middle
    for(var i = 0; i < 400; i += 1.5) {
        stroke(255, 201, 244);
        strokeWeight(0.3);
        line(height, -i * 4, i * 4, width - 100);
    }

    //yellow lines in the very front
    for(var i = 0; i < 600; i += 5) {
        stroke(207, 207, 145);
        strokeWeight(0.3);
        line(i * 4, height, -i * 4, 0);
    }

}


During the project, I wanted to experiment with the contrast between the dark color of the background and the lighter colors of the lines. I wanted to also look at the how the lines interact with each other in both form and color. Looking at the final product, it reminds me a little bit of laser beams in the dark.

Caroline Song – Looking Outwards 04

The piece I chose to focus on this week is called Sonic Playground, by Yuri Suzuki Design (as they collaborated with High Atlanta). Essentially, Sonic Playground is an sound installation based outside which is made up of a collection of colorful sculptures which transmits as well as modifies sound in different and intriguing ways.

Sonic Playground by Yuri Suzuki Design

This interactive sound display is used by sound being manipulated and changed based on where one is standing. For example, talking through one end of the sculpture will twist the sound of the voice as it travels to be received by another person standing and listening at the other end of the sculpture.

According to the article, Luca Dellatorre used Grasshopper to develop the pieces in this sculpture piece, which is a “parametric design plug-in in Rhinoceros”. Dellatorre wrote a plug-in which is a 3D raytracing tool which lets the audience choose a source of sound and send that in a precise direction. He used this method in order to test the different sounds that could be made and therefore, evaluate certain shapes for the mirrors and the bells.

I am intrigued by this piece mainly because of its interaction between the physical space around it and the users. The way the bells are positioned around the different sculptures are interesting in that the users who are experiencing this piece will have to maneuver their heads and their bodies certain ways to properly interact with the sculpture.

Caroline Song – Project 03 – Dynamic Drawing

sketch

//Caroline Song
//Section E
//chsong@andrew.cmu.edu
//Project 03 - Dynamic Drawing

var speed = 3;
var distX = 0;
var distY = 1;
var rectX = 300;
var rectY = 300;
var rectWidth = 50;
var rectHeight = 300;

function setup (){
    createCanvas(480, 640);
}

function draw(){
//change background color when mouse cursor is on lower half of canvas
    if(mouseY > height/3){
        background(255, 96, 71);
       } else{
       background ("black");
       }

//constantly moving yellow rectangle
    rect(rectX, rectY, rectWidth, rectHeight);
    fill(245, 236, 66);
    noStroke();
    rectX = rectX + distX * speed;
    rectY = rectY + distY * speed;

    if (rectY >= height){
        rectY = -rectHeight;
    }

//when mouse pressed, shapes change from circle to rectangle. 
//shapes will also change colors
    push();
    if(mouseIsPressed){

        //yellow rectangle following mouse cursor when mouse pressed
        rectMode(CENTER);
        rect(mouseX, mouseY, 100, 100);
        fill(245, 149, 66);
        noStroke();

        //blue rectangle when mouse pressed
        rectMode(CENTER)
        rect(400 - mouseX, 300 + mouseY, 75, 75);
        fill(66, 135, 245);
        noStroke();

        //purple rectangle when mouse pressed
        rectMode(CENTER);
        rect(width/2 + mouseX, height/2 - mouseY, 300, 300);
        fill(188, 66, 245);
        noStroke();

        //orange rectangle when mouse pressed
        rectMode(CENTER);
        rect(480, 400, 60, 60);
        fill(245, 236, 66);
        noStroke();

        //yellow rectangle in corner when mouse pressed
        rectMode(CENTER);
        rect(0, 0, 300, 300);
        fill(71, 255, 169);
        noStroke();

    } else {

        //yellow circle
        ellipse(mouseX, mouseY, 200, 200);
        fill(66, 245, 135);
        noStroke();

        //pink circle
        ellipse(400 - mouseX, 300 + mouseY, 300, 300);
        fill(232, 152, 245);
        noStroke();

        //blue circle
        ellipse(width/2 + mouseX, height/2 - mouseY, 100, 100);
        fill(152, 245, 228);
        noStroke();

        //orange circle
        rectMode(CENTER);
        rect(480, 400, mouseX, mouseY);
        fill(245, 236, 66);
        noStroke();

        //yellow rectangle
        rectMode(CENTER);
        rect(0, 0, mouseX, 300);
        fill(71, 255, 169);
        noStroke();

    }
    pop();

}

Coming up with an idea for my dynamic drawing was one of the most challenging parts for me, because there seemed to be so many things to choose from that I didn’t know where to start. However, once I began, I decided to focus on how shapes can interact and flow together in a single piece, creating my final dynamic drawing.

Caroline Song – Looking Outward 03

In response to the creation of GLASS II, which is a large-scale manufacturing technology that can 3D print transparent glass structures at architectural dimensions, an installation as part of Milan Design Week was made in 2017 by the Mediated Matter group.

These three columns of glass shown in the picture below have a constantly changing surface, being able to disperse and concentrate light from the inside and outside of the structure.

GLASS II Milan Design Week installation by the Mediated Matter group

I admire this project because of its use of glass, which is a beautiful but difficult medium to work with because of its fragility. 3D printing is such a commonality at this point, and bringing in a new medium for it to be able to print: glass, is interesting and very admirable.

I do not know much about the algorithms that produced this work, however I believe that the algorithm must have taken into account the constraints of the medium that it is working with. Because of the constantly changing shapes of the structure, the algorithm must have also been aware of that ever-changing surface area, and worked accordingly.

The artists’ creative tendencies manifest itself throughout the exhibit as the delicate fractals that create different shapes throughout the space, and the shifting forms of glass must have had to be precisely arranged and purposefully done in order to achieve some mood by the audience who is watching this exhibit.