//alcai@andrew.cmu.edu
//alice cai
//section E
//Project Week 7

//spinning speed
var speed = 0;

function setup() {
    createCanvas(500,500);
}

function draw() {
    frameRate(30);
    background('black');

    push();
    //draw at middle of canvas
    translate(width/2, height/2);
    //rotate speed, rotates on its own but also adjusted by mouse X
    rotate(speed + mouseX, 0, 200, 0, TWO_PI);
    speed = speed + 1;
    //call droid draw functions
    epicycloid();
    astroid();
    epitrochoid();
    pop();

}


function epicycloid(){
    noFill();
    strokeWeight(2);
    stroke(mouseX, 100, 130,150);


    beginShape();
    //defining variables, size is corntroled by mouseX/mousY
    a = map(mouseX, 0, width, 50,300);
    b = map(mouseY, 0, width, 50,300);
    //forloop that repeats shape
    for (var t = 0; t < 40; t ++) {
    var x = (a / (a + 2 * b)) * cos(t) - b * cos(((a + b) / b) * t);
    var y = (a / (a + 2 * b)) * sin(t) - b * sin(((a + b) / b) * t);
    vertex(x ,y);
    endShape();

}
}

function epitrochoid (){
    noFill();
    strokeWeight(5);
    stroke(200,10,100, 5);

    beginShape();

    //forloop that repeats shape
    for (var i = 0; i < 100; i ++) {

    //defining variables, size is corntroled by mouseX/mousY
    a = map(mouseX, 0, width, 50,300);
    b = map(mouseX, 0, width, 50,300);
    h = map(mouseX, 0, width, 50,200);

    x = (a + b) * cos(i/2) - (h * cos((a + b / b) * i));
    y= (a + b) * sin(i/2) - (h * sin((a + b / b) * i));
    vertex(x, y);
    endShape();
    }
}


function astroid(){
    noFill();
    strokeWeight(5);
    stroke(130, 100, 150,150);


    beginShape();

    //forloop that repeats shape
    for (var t = 0; t < 20; t ++) {

    //defining variables, size is corntroled by mouseX/mousY
    z = map(height - mouseY, 0, width, 50,200);
    var x = z * cos(t)^ 3 ;
    var y = z * sin (t)^ 3 ;
    vertex(x ,y);
    endShape();

    }

}
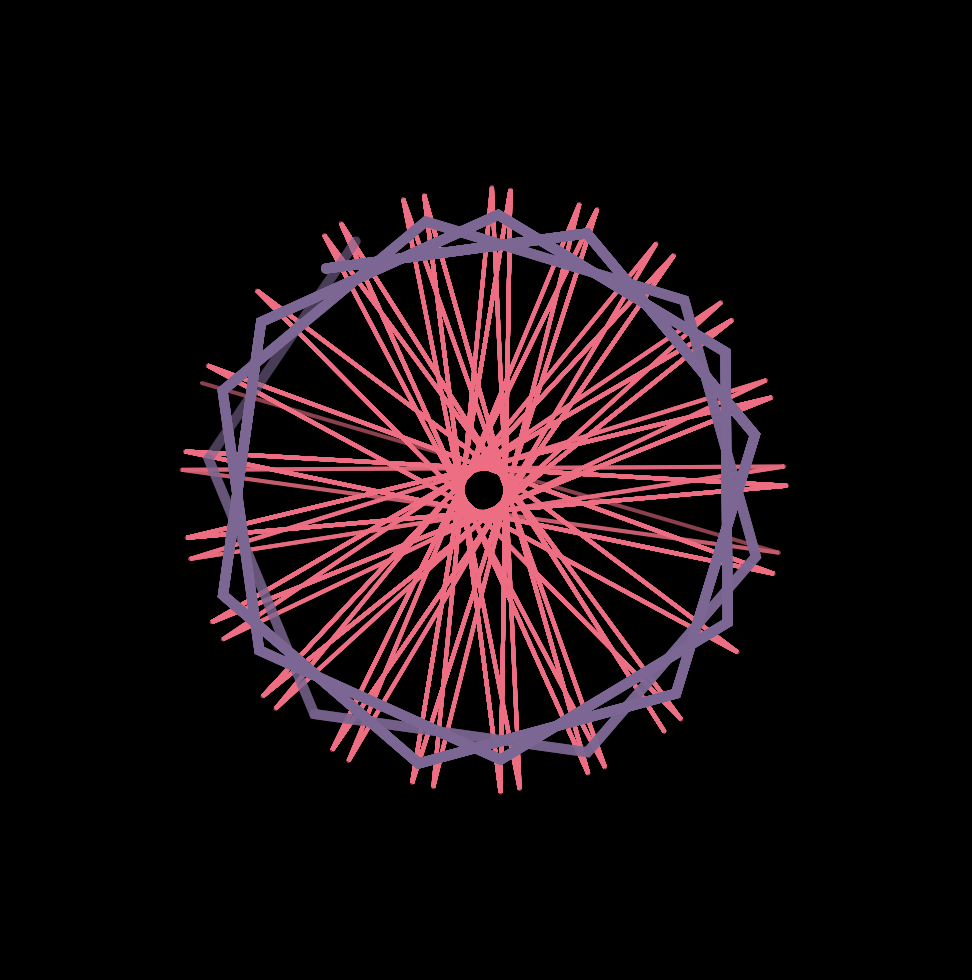
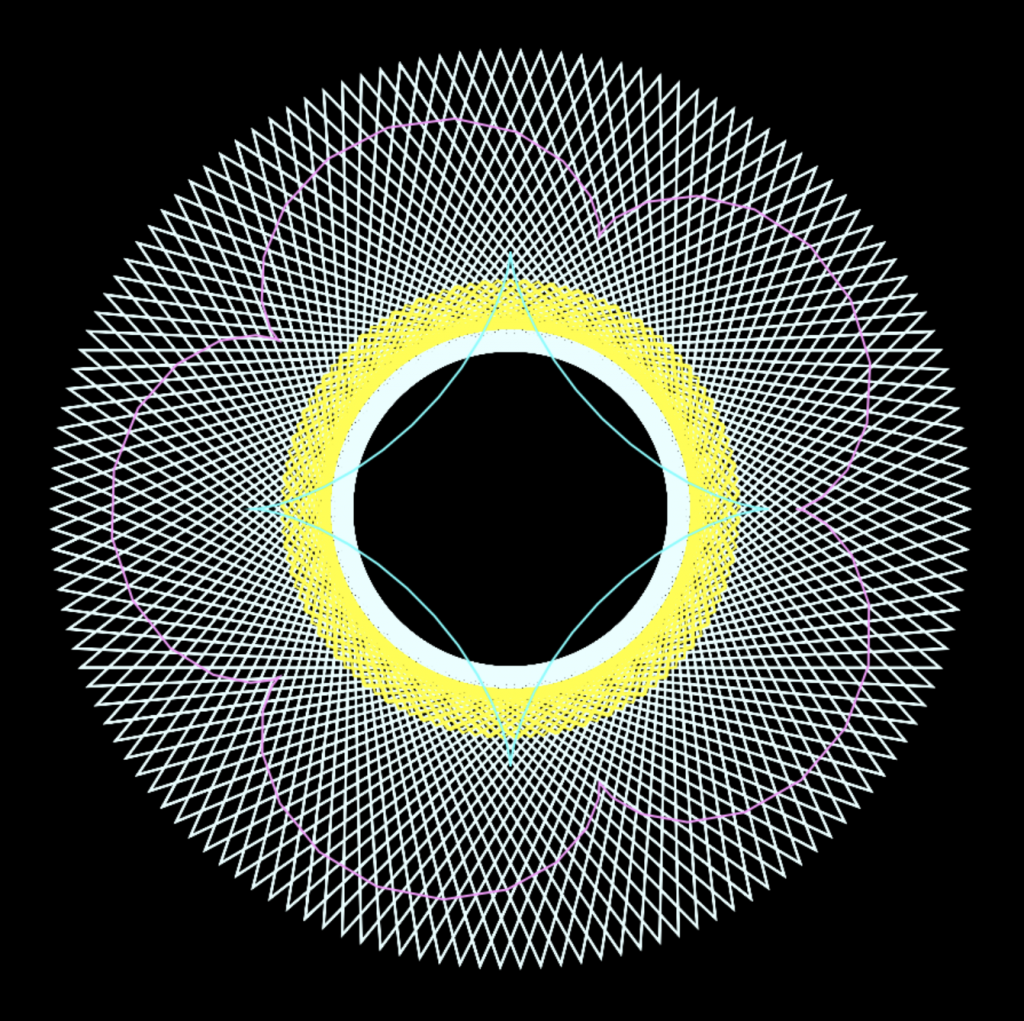
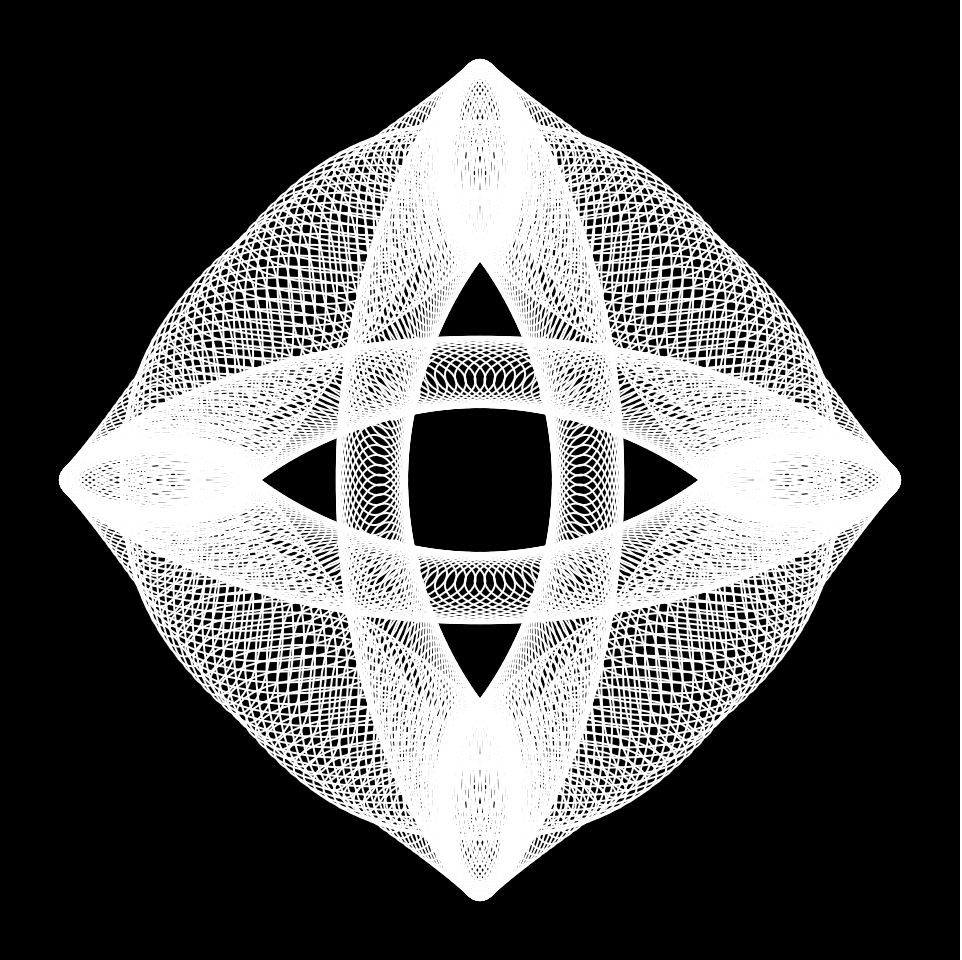
This project seemed really daunting because all the shapes looked complex and there was a lot going on on the screen, especially those with mouse interaction. Turns out, it’s not as complex as it seems. Although the equations may seem complex, they are also given to us. After that, it’s just about defining the variables in the equation and calling a for loop to draw a pattern with the shape! I used a map function to control the size of the shape with mouseX and mouseY. I also changed the opacity of the line strokes for a more transparent and three-dimensional looks.
TWO SHAPES THREE SHAPES with varying opacityA better capture of the visual effect of lower opacity
//Sewon Park
//sewonp@andrew.cmu.edu
//Section B
//Project-07

function setup() {
    createCanvas(480, 480);

}

function draw() {
	background(0,0,0);
	push();
	translate(width/2, height/2); //placing curve at center
	drawBicorn();
	pop();
}

function drawBicorn(){

	var x;
	var y;
	var w = map(mouseX,0,width,0,200); // changes length of the curve through mouse control
	var h = map(mouseY,0,height,0,200) // changes height of the curve through mouse control

	stroke(255,0,0);
	beginShape();
	for(var i = 0; i <200; i ++){
	var t = map (i, 0, 200, 0 ,200);
	x = (w*sin(t)); //x coordinate equation for Bicorn
	y = (h*sin(t)*cos(t)); //y coordinate equation for Bicorn
	vertex(x,y); // placing curve at center
	}
	endShape(CLOSE);

}
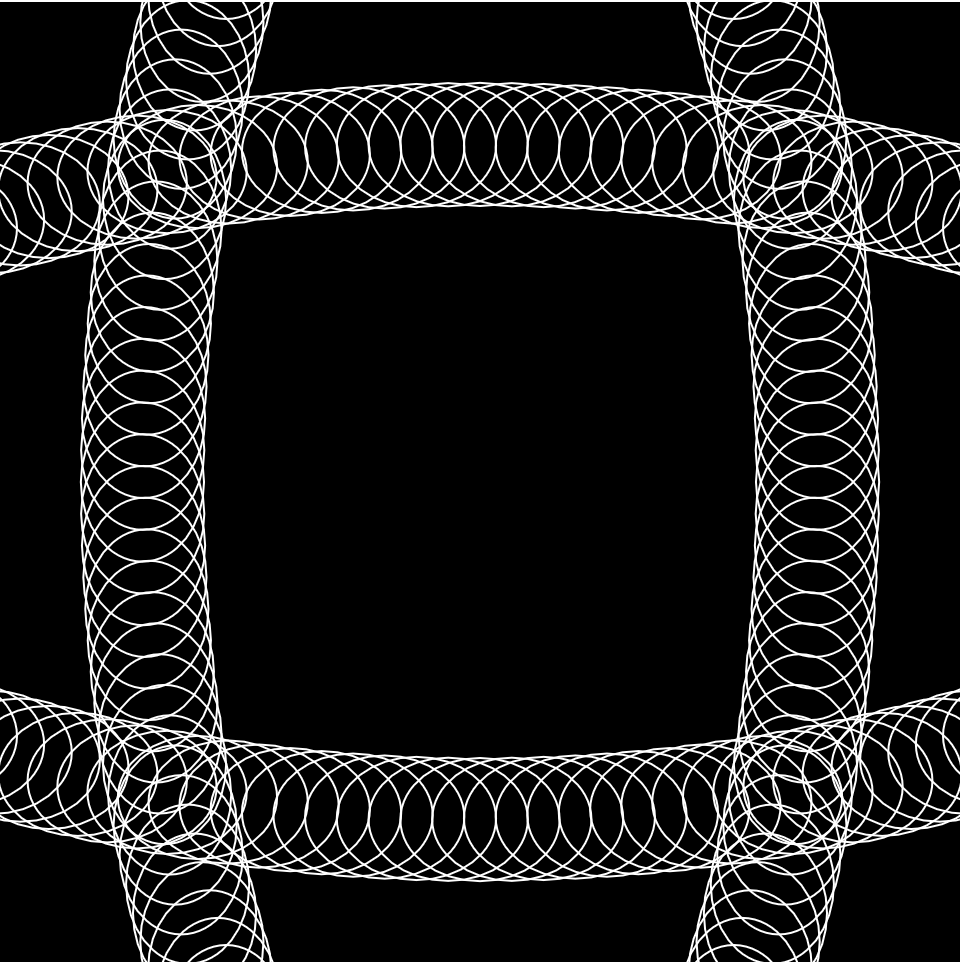
For this project, I was very conflicted about choosing the curve as I was not knowledge about the realm of mathematical graphs. Having only known parabolas and hyperbolas, I was surprised to see the myriad of curves on the reference website. Many of the curves seemed somewhat randomly drawn without specific symmetry or shape. As I appreciate symmetry, I decided to select the Bicorn curve. The curve represented a variety of objects such as a ribbon, the infinity sign, and a mask. I tried to develop an abstract visualization of Deadpool’s mask.
I also thought of Spiderman whilst making the project, prompting me to create a web like structure to assimilate spiderwebs when creating the mask.
//Jamie Park           jiminp@andrew.cmu.edu
//15-104          Section E        Project 7

//Global Variables
var maxIVal = 300;

function setup(){
    createCanvas(450, 450);
    frameRate(40);
}

function draw(){
    background("black");
    drawHypotrochoid();
    drawRanunculoid();
    drawHypotrochoid2();
    drawAstroid();
}

function drawRanunculoid(){
        //http://mathworld.wolfram.com/Ranunculoid.html

    //push and translate the drawing to the center of the canvas
    push();
    translate(width / 2, height / 2);

    //constrain mouseX and map mouse movement
    var canvaWidth = constrain(mouseX, 0, width);
    var angle = map(canvaWidth, 0, width, 0, 360);
    var a = map(canvaWidth, 0, width, 10, width / 18);

    //change stroke color according to mouse movement, begin shape, and rotate
    noFill();
    stroke(canvaWidth, 150, canvaWidth - 20);
    beginShape();
    rotate(radians(angle));

    //forLoop that creates the shape
    for (var i = 0; i < TWO_PI; i += 0.1){
    //equation for the shape and vertex (high points)
        var x = a * (6 * cos (i) - cos (6 * i));
        var y = a * (6 * sin (i) - sin (6 * i));
        vertex(x, y);
    }
    endShape();
    pop();
}

function drawHypotrochoid(){
    //http://mathworld.wolfram.com/Hypocycloid.html

    //push and translate the drawing to the center of the canvas
    push();
    translate(width / 2, height / 2);

    //constrain mouseX, mouseY and map mouse movement
    var canvaLength = constrain(mouseX, 0, width);
    var canvaHeight = constrain(mouseY, 0, height);
    var a = map(canvaLength, 0, width, 10, width / 30);
    var b = map(canvaHeight, 0, height, 2, height / 30);
    var radAngle = 200;

    //change stroke color according to mouse movement and begin shape
    noFill();
    stroke(230, canvaHeight, canvaLength);
    beginShape();

    //forLoop that creates the shape
    for (var i = 0; i < maxIVal; i++){
        //variable rotation that maps the i value into angles
        var rotation = map(i, 0, 360, 0, 360);
        //equation for the shape and vertex
        var x = (a - b) * cos(rotation) + radAngle * cos((a - b * rotation));
        var y = (a - b) * sin(rotation) - radAngle * sin((a - b * rotation));
        vertex(x, y);
    }
    endShape();
    pop();
}

function drawHypotrochoid2(){
    //http://mathworld.wolfram.com/Hypocycloid.html

    //push and translate the drawing to the center of the canvas
    push();
    translate(width / 2, height / 2);

    //constrain mouseX, mouseY and map mouse movement
    var canvaLength = constrain(mouseX, 0, width);
    var canvaHeight = constrain(mouseY, 0, height);
    var a = map(canvaLength, 0, width, 2, width / 60);
    var b = map(canvaHeight, 0, height, 2, height / 60);
    var radAngle = 100;

    //change stroke color according to mouse movement and begin shape
    noFill();
    stroke(canvaLength, canvaHeight, 10);
    beginShape();

    //forLoop that creates the shape
    for (var i = 0; i < maxIVal; i += 2){
        //variable rotation that maps the i value into angles
        var rotation = map(i, 0, 360, 0, 270);
        //equation for the shape and vertex
        var x = (a - b) * cos(rotation) + radAngle * cos((a - b * rotation));
        var y = (a - b) * sin(rotation) - radAngle * sin((a - b * rotation));
        vertex(x, y);
    }
    endShape();
    pop();
}

function drawAstroid(){
    //http://mathworld.wolfram.com/Astroid.html

    push();
    translate(width / 2, height / 2);

    //variables necessary to define the curve
    var canvaLength = constrain(mouseX, 0, width);
    var a = map(canvaLength, 0, width, 20, width * 0.25);
    var angle = map(canvaLength, 0, width, 0, 360);
    //creating the curve
    noFill();
    stroke(100, canvaLength, canvaLength);
    beginShape();
    rotate(radians(angle));

    //forLoop for the curve and the math equation for the curves
    for (var i = 0; i < (2 * PI); i += 0.1){
        var angle = map(i, 360, 0, TWO_PI);
        var x = a * pow(cos(i), 3);
        var y = a * pow(sin(i), 3);
        vertex(x, y);
    }
    endShape();
    pop();
}
Similar to others, I struggled with understanding how to start the project. But after spending some time decoding the code on “notes” and “deliverables” sections, I had a good grasp on how things were supposed to be done. I ended up creating four curves that change color and size/complexity according to the mouse position. I am happy with the way it turned out.
/*
 * Angela Lee
 * Section E
 * ahl2@andrew.cmu.edu
 * Project 7 Curves
 */

 function setup() {
    createCanvas(480, 480);
 }

 function draw() {
    frameRate(20);
    background(0);

    push();
    // functions start at the middle of the canvas
    translate(width/2, height/2);
    // functions rotate with mouseX
    rotate(map(mouseX, 0, 480, 0, TWO_PI));
    hypotrochoid();
    epitrochoid();
    astroid();
    pop();
}

function astroid() {
    noStroke();

    // colors change smoothly by milliseconds
    r = 100 + 100 * sin(millis() / 1000.0);
    g = 150 + 40 * sin(millis() / 1000.0 + HALF_PI);
    b = 230 + 60 * sin(millis() / 1000.0 - HALF_PI);
    fill(r, g, b);

    // outer & inner radii depend on user's mouse
    a = map(mouseX, 0, width, 0, 100);
    b = map(mouseY, 0, height, 0, 100);

    // drawing the astroid
    beginShape();
    for (var i = 0; i < 2000; i ++ ) {
        // angle for astroid formula
        angle = map(i, 0, 2000, 0, TWO_PI);
        var x = pow(cos(angle), 3) * a;
        var y = pow(sin(angle), 3) * b;
        vertex(x, y);
    }
    endShape();
}

function hypotrochoid() {
    strokeWeight(1);
    fill(0);

    // colors change smoothly by milliseconds
    r = 230 + 60 * sin(millis() / 1000.0);
    g = 240 + 80 * sin(millis() / 1000.0 + HALF_PI);
    b = 155 + 90 * sin(millis() / 1000.0 - HALF_PI);
    stroke(r, g, b);

    // outer & inner radii depend on user's mouse
    a = map(mouseX, 0, width, 50, 150);
    b = map(mouseY, 0, height, 5, 10);
    h = map(mouseY, 0, height, 100, 200);

    // drawing the hypotrochoid
    beginShape();
    for (var i = 0; i < 2000; i ++) {
        // angle for hypotrochoid formula
        angle = map(i, 0, 2000, 0, TWO_PI);
        var x = (a - b) * cos(angle) + h * cos((a - b) / b * angle);
        var y = (a - b) * sin(angle) + h * sin((a - b) / b * angle);
        vertex(x, y);
    }
    endShape();
}


function epitrochoid() {
    strokeWeight(1);
    // fill allows it to have no overlap with hypotrochoid
    fill(0);
    // color changes smoothly by milliseconds
    r = 50 + 20 * sin(millis() / 1000.0);
    g = 150 + 150 * sin(millis() / 1000.0 + HALF_PI);
    b = 230 + 120 * sin(millis() / 1000.0 - HALF_PI);
    stroke(r, g, b);

    // inner & outer radii depend on user's mouse
    a = map(mouseX, 0, width, 50, 100);
    b = map(mouseY, 0, height, 0, 3);
    h = map (mouseX, 0, width, 0, 25);

    // drawing the epitrochoid
    beginShape();
    for (var i = 0; i < 2000; i++) {
        angle = map(i, 0, 2000, 0, TWO_PI);
        var x = (a + b) * cos(angle) - h * cos((a + b) / b * angle);
        var y = (a + b) * sin(angle) - h * sin((a + b) / b * angle);
        vertex(x, y);
    }
    endShape();
}
For this project, I was interested in seeing how multiple curves could overlap, interact, or mirror each other’s movements. So, I made the rotation for all three curves the same, but each curve’s parameter depends on mouseX and mouseY a little differently. Although I liked seeing how the curves could overlap, it got a very visually chaotic sometimes when they did, so I wanted to make the order of the curves constant so one curve was always the smallest, etc. The last part I tweaked about my curves was making the curves go out of the canvas, because the composition looked very restrained otherwise.
//Jai Sawkar
//Section C
//jsawkar@andrew.cmu.edu
//Project 07: Abstract Clock

function setup() {
    createCanvas(480, 480);
    frameRate(60);
}

var pts = 200;

function draw(){
    background(0);

    // using push & pull to orient the Bicorn
    push()
    translate(width/2, height/2) //center focused
    drawCurve();
    pop();

    push();
    rotate(PI);  //upside down
    translate(-width/2, -height/2);
    drawCurve();
    pop();

    push();
        rotate(PI/2); // clokcwise
        translate(width/2, -height/2)
    drawCurve();
    pop();

    push();
    rotate(-PI/2); //counter clockwise
        translate(-width/2, height/2)
    drawCurve();
    pop();

}

function drawCurve(){

    //fill(255)
    noFill();
    stroke(255)
    //noStroke();
    var g = map(mouseX, 0, width, 0, width/2); //moving the parameters of mouse x
    var g = map(sq(mouseY), 0, height, 0, 1); //moving parameters of mouse y

    beginShape();
        for (i = 0; i < pts; i++){
            var j = map(i, 0, pts, 0, radians(360));
            x = g * sin(j); //forumla
            y = (g * cos(j) * cos(j) * (2+ cos(j))) / (3 + sin(j) * sin(j)); //formula
            var w = map(mouseX, 0, height, 1, 70) //remapping width
            var h = map(mouseY, 0, width, 1, 60) //remapping heigth
            ellipse(x, y, w, h); //ellipse
        }
        endShape(CLOSE);
}
For this project, I found the Bicornal Curve interesting, so I decided to explore its possibilities. Once I drew it using the math equation provided, I found it a tad dull. I then decided to create 3 more, creating 4 bicornal curves
//Zee Salman
//SECTION E
//fawziyas@andrew.cmu.edu
//Project- 07

var nPoints = 100;
var EPITROCHOID = 0; // Cartesian Parametric Form  [x=f(t), y=g(t)]
var curveMode = EPITROCHOID;


function setup() {
    createCanvas(400, 400);
    frameRate(50);
}


function draw() {
    background(180,190,175);

    // draw the frame
    fill(0);
    noStroke();
    noFill();

    // draw the curve
    push();
    translate(width / 2, height / 2);
    switch (curveMode) {
    case EPITROCHOID:
        drawEpitrochoidCurve();
        break;
    }
    pop();
}

//--------------------------------------------------
function drawEpitrochoidCurve() {
    // Epicycloid:
    // http://mathworld.wolfram.com/Epicycloid.html

    var nPoints = 20;
    var radius = 50;
    var separation = 125;

    var x;
    var y;

    var a = mouseX / 10;
    var b = a / 10.0;
    var h = constrain(mouseY / 20.0, 20, b *50);
    var ph = mouseX / 50.0;

    stroke(255, 250, 100);
    strokeWeight(3);
//BIGGER SHAPE
    beginShape();
    for (var i = 0; i < nPoints; i++) {
        var t = map(i, 0, nPoints, 0, TWO_PI);

        x = (a +30 + b) * cos(t) - h * cos(ph + t * (a + b) / b);
        y = (a+30 + b) * sin(t) - h * sin(ph + t * (a + b) / b);
        vertex(x, y);
    }
    endShape(CLOSE);


   //// smaller shape
    stroke(245, 20, 200);
    beginShape();
    for (var i = 0; i < nPoints; i++) {
        var t = map(i, 0, nPoints, 0, TWO_PI);

        x = (a + b) * cos(t) - h * cos(ph + t * (a + b) / b);
        y = (a + b) * sin(t) - h * sin(ph + t * (a + b) / b);
        vertex(x, y);
    }
    endShape(CLOSE);


    push();
    translate(5*separation, height / 2);
    var qx = 0;
    var qy = 0;
    for (var i = 0; i <= nPoints; i++) {
        var theta = map(i, 0, nPoints, 0, TWO_PI);
        var px = radius * cos(theta);
        var py = radius * sin(theta);
        if ((i % 2 == 0) & (i > 1)) {
            line(qx, qy, px, py);
        }
        qx = px;
        qy = py;
    }
    pop();

    //// smallest shape
    //// smaller shape
  	stroke(mouseY,45,mouseX)
    beginShape();
    for (var i = 0; i < nPoints; i++) {
        var t = map(i, 0, nPoints, 0, TWO_PI);

        x = (a/2 + b) * cos(t) - h * cos(ph + t * (a + b) / b);
        y = (a/2 + b) * sin(t) - h * sin(ph + t * (a + b) / b);
        vertex(x, y);
    }
    endShape(CLOSE);

//outer shape
	stroke(mouseY, mouseX, 200);
    push();
	rotate(mouseX*6/ mouseY*6);
    strokeWeight(2);
    beginShape();
    for(var i = 0; i < 200; i +=2) {
        var x =   a * (10 * cos(i) - cos(i));
        var y =   a * (10 * sin(i) -sin(i));
        vertex(x, y);
    }
    endShape();
    pop();


}
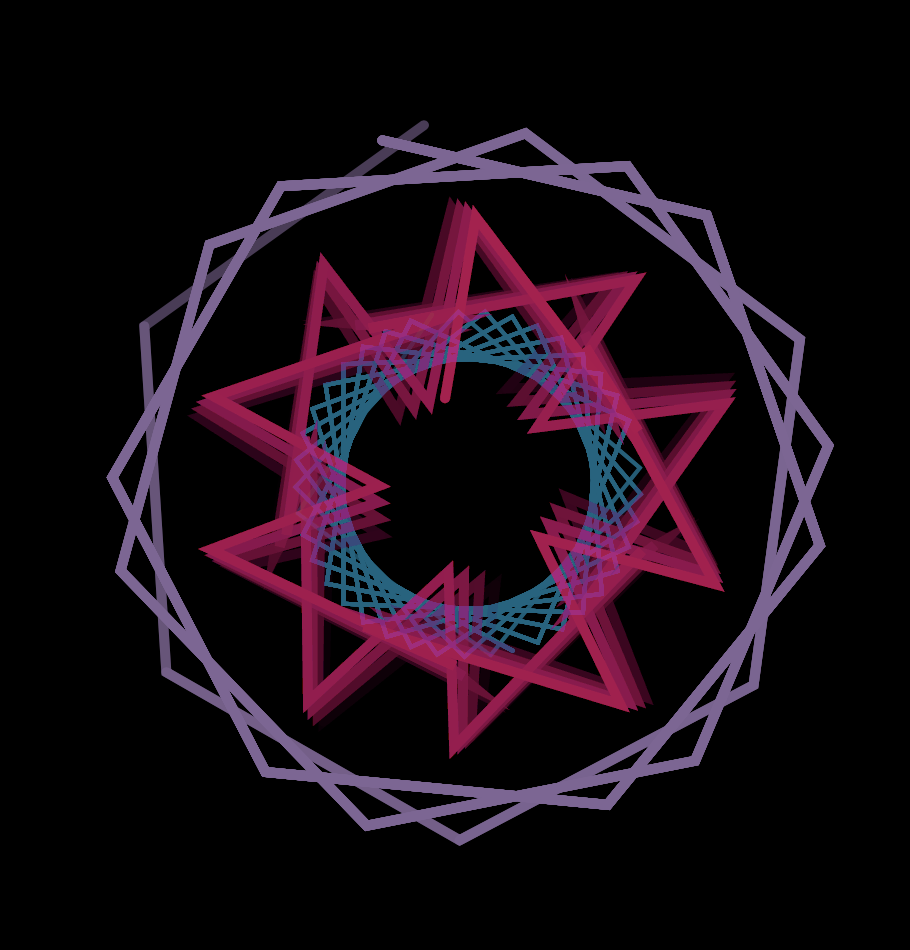
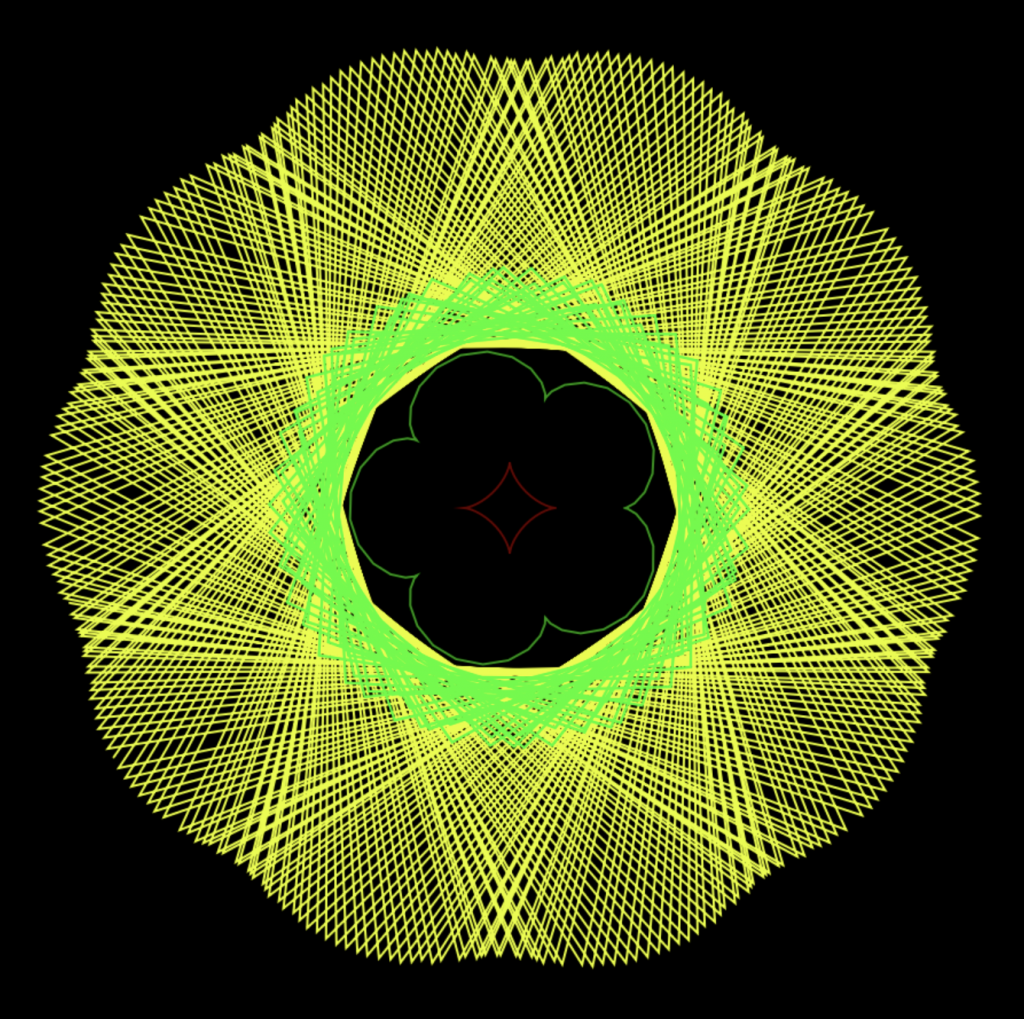
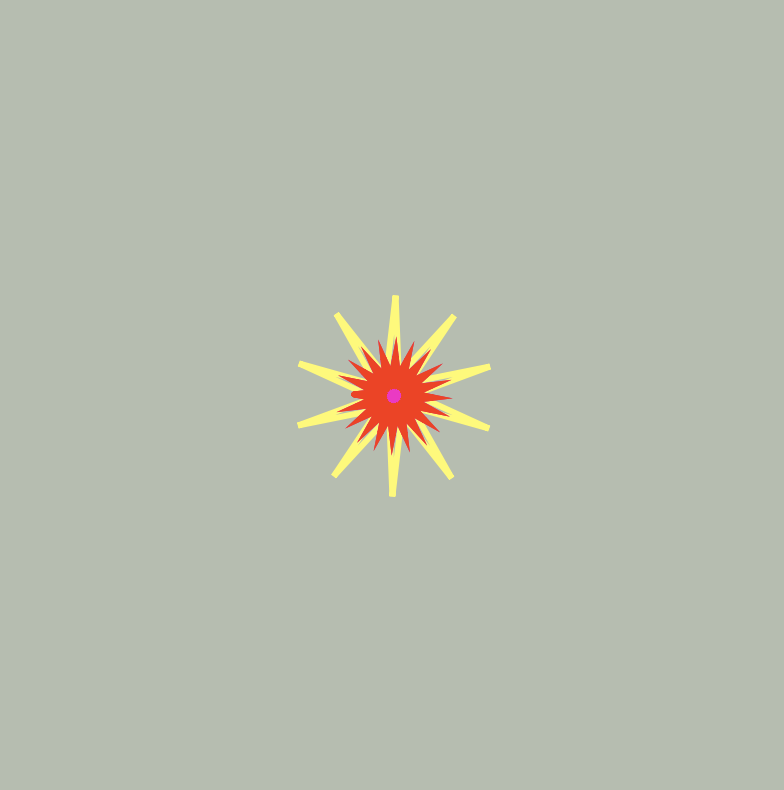
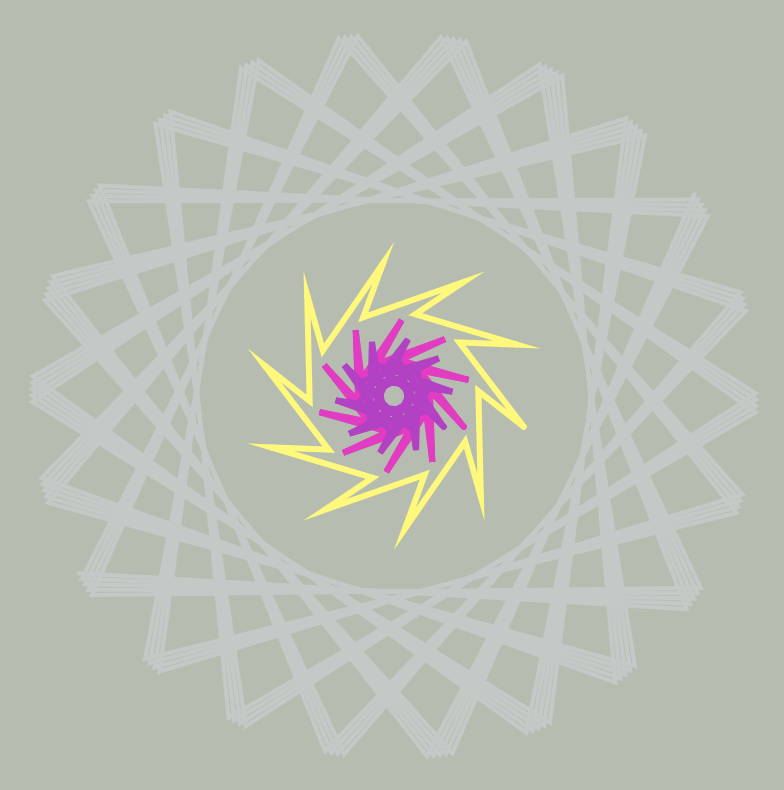
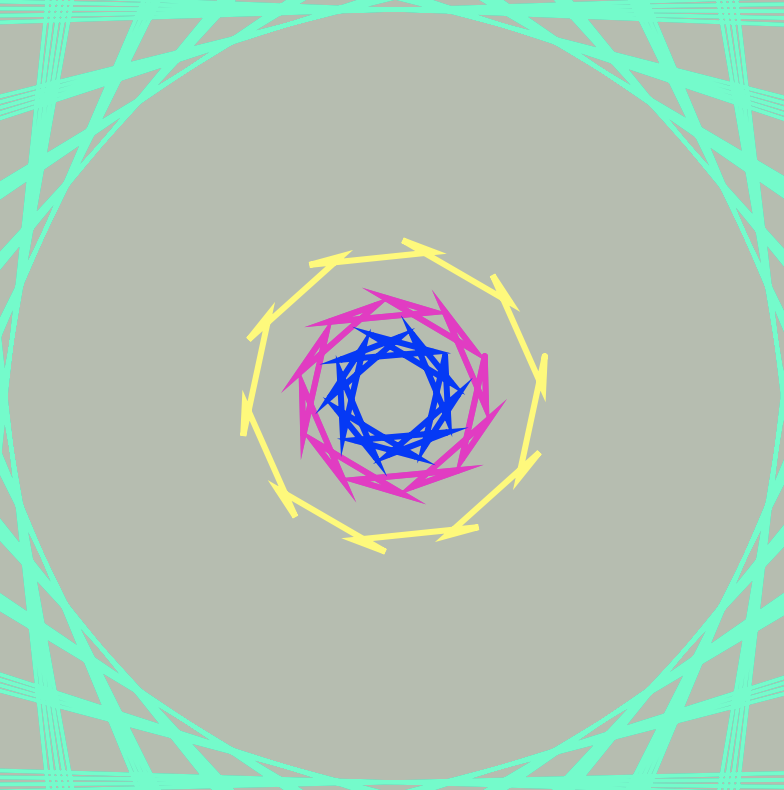
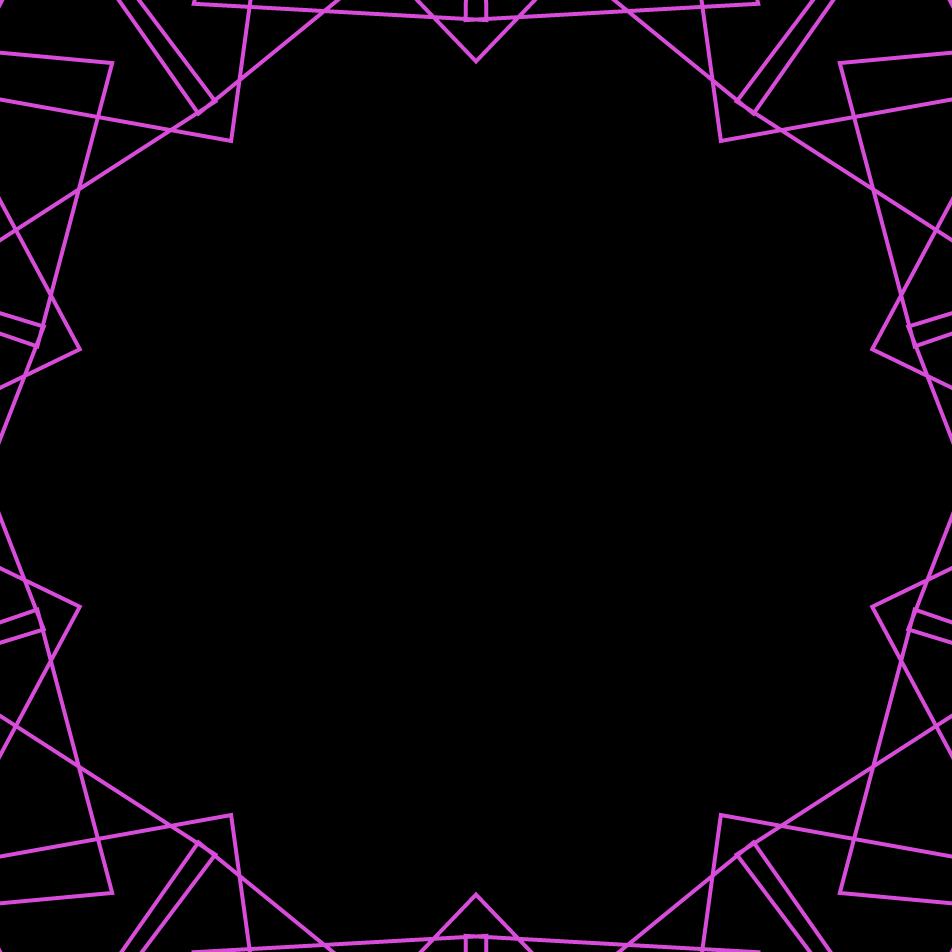
I started out wanting to do something floral or something almost pufferfish like but I started to stray away from those because I started to experiment more with my code. I started looking at the constraints and seeing where I can really try to make the piece interesting without losing sight of the project. Also trying to make each part visible to the user. I also played around with repetition and space which I really liked together in the composition. I would also like to take this project further and see how maby Epitrochoids I can fit onto one canvas and how I can make them more complex while again, making it clear.
Marked at (0, height)Marked at center (200,200)Marked at (width, 0)
///RAYMOND PAI
///SECTION D
///RPAI@ANDREW.CMU.EDU
///PROJECT 07

function setup(){
    createCanvas(480, 480);
}

function draw() {
    background(mouseX, mouseY, mouseX);
    //Draw Curves 1 and 2
    drawE1();
    drawE2();
    drawE3();
    drawE4();
}

function drawE1() {
    push();
    //Color
    fill(mouseX + 50, 50, mouseY + 50);
    //Center
    translate(width / 2, height / 2);
    var a = map(mouseX, 0, width, 0, 250);
    var b = map(mouseY, 0 , height, 0, 250);
    beginShape();
        for (var i = 0; i < 250; i++) {
            //Angle
            var t = map(i, 0, 250, 0, 2 * PI);
            //Epicycloid equations
            x = (a + b) * sin(t) - b * sin((a + b) * t / b);
            y = (a + b) * cos(t) - b * cos((a + b) * t / b);
            vertex(x, y);
        }
    endShape();
    pop();
}

function drawE2() {
    push();
    //Color
    fill(0, mouseX + 50, mouseY + 50);
    //Center
    translate(width / 2, height / 2);
    var a = map(height-mouseX, 0, width, 0, 250);
    var b = map(height-mouseY, 0 , height, 0, 250);
    beginShape();
        for (var i = 0; i < 250; i++) {
            //Angle
            var t = map(i, 0, 250, 0, 2 * PI);
            //Epicycloid equations
            x = (a + b) * sin(t) - b * sin((a + b) * t / b);
            y = (a + b) * cos(t) - b * cos((a + b) * t / b);
            vertex(x, y);
        }
    endShape();
    pop();
}

function drawE3() {
    push();
    //Color
    fill(200, mouseY + 50, mouseX + 50);
    //Center
    translate(width / 2, height / 2);
    var a = map(height/2-mouseX, 0, width, 0, 250);
    var b = map(height/2-mouseY, 0 , height, 0, 250);
    beginShape();
        for (var i = 0; i < 250; i++) {
            //Angle
            var t = map(i, 0, 250, 0, 2 * PI);
            //Epicycloid equations
            x = (a + b) * sin(t) - b * sin((a + b) * t / b);
            y = (a + b) * cos(t) - b * cos((a + b) * t / b);
            vertex(x, y);
        }
    endShape();
    pop();
}

function drawE4() {
    push();
    //Color
    fill(mouseX + 50, mouseX + 50, 200);
    //Center
    translate(width / 2, height / 2);
    var a = map(height/1.5-mouseX, 0, width, 0, 250);
    var b = map(height/1.5-mouseY, 0 , height, 0, 250);
    beginShape();
        for (var i = 0; i < 250; i++) {
            //Angle
            var t = map(i, 0, 250, 0, 2 * PI);
            //Epicycloid equations
            x = (a + b) * sin(t) - b * sin((a + b) * t / b);
            y = (a + b) * cos(t) - b * cos((a + b) * t / b);
            vertex(x, y);
        }
    endShape();
    pop();
}
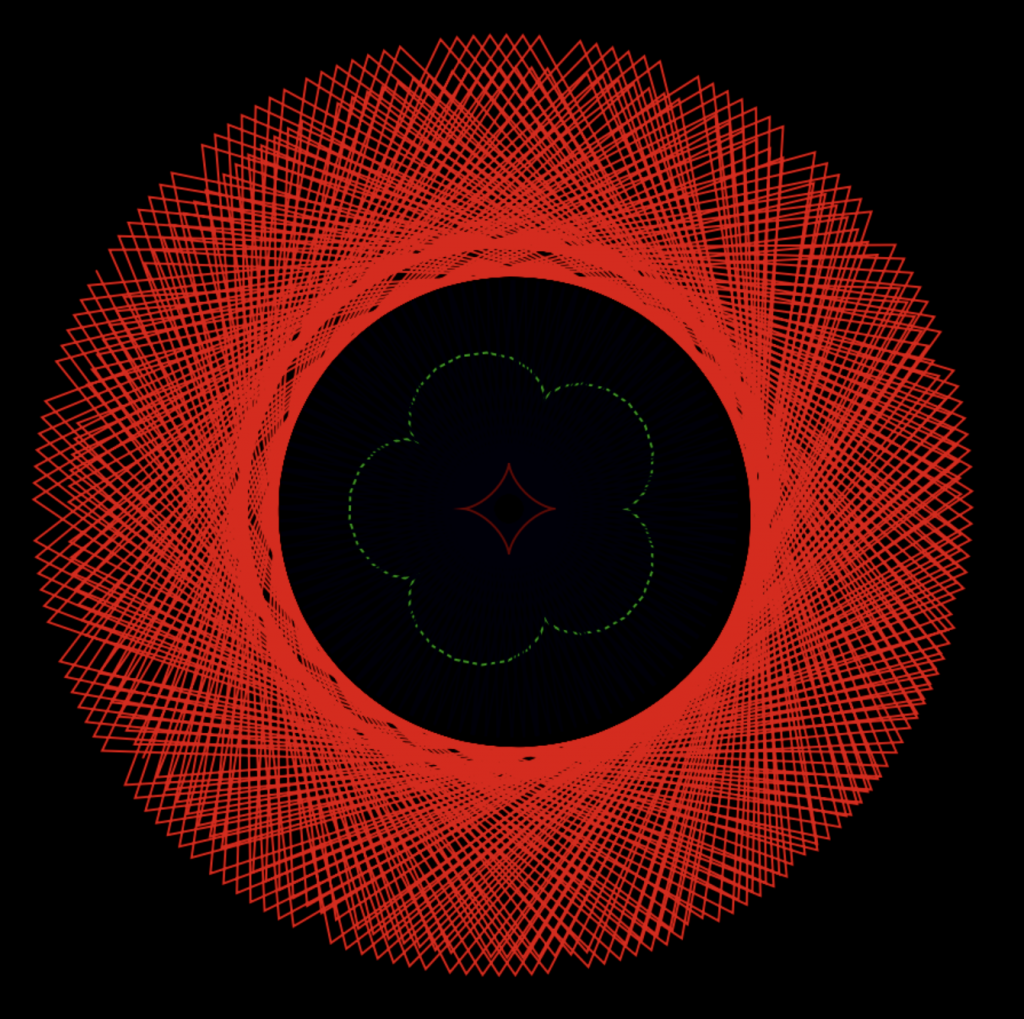
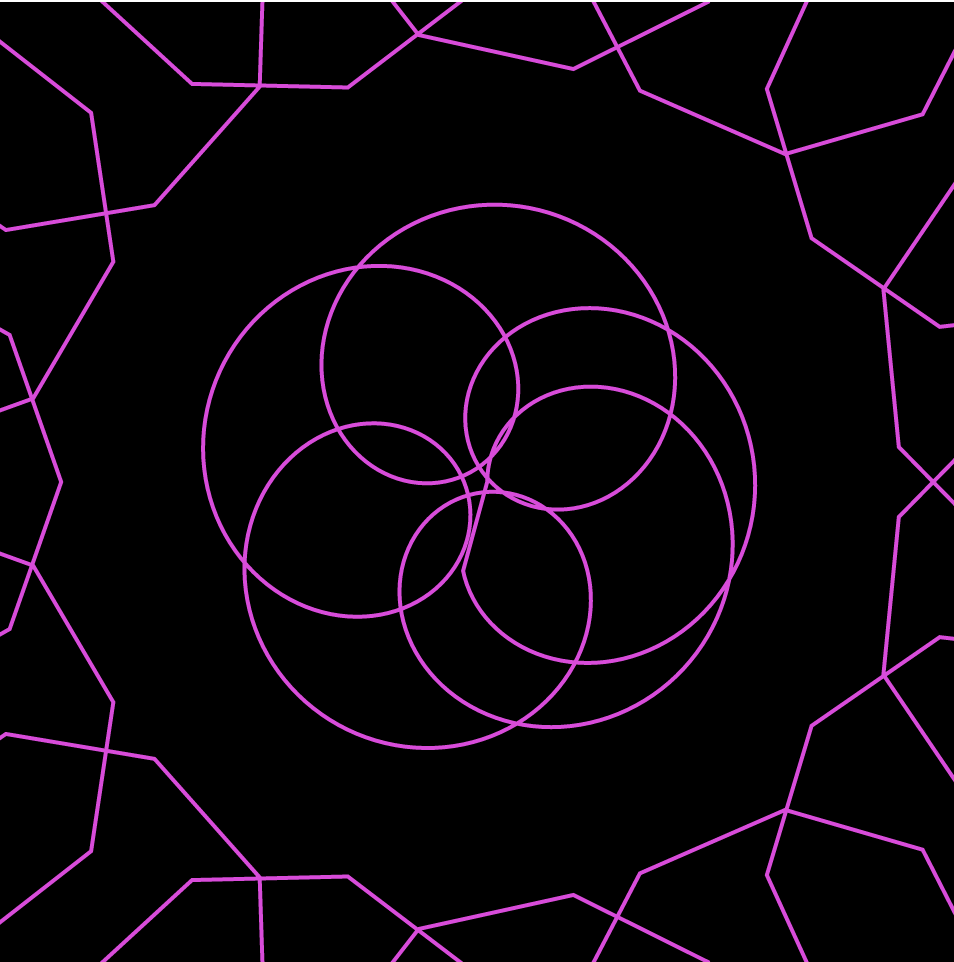
Flower Power!
The curve I used is the Epicycloid. I like how it creates petals that resemble flowers.
I used 4 Epicycloids of varying sizes to create the effect of flowers without making it obvious that they’re flowers. I decided to do this because the flowers looked pretty lonely.
Lonely Flower
The more curves I added the more interesting the floral patterns became.
The colors are based on the mouse position, but I limited them slightly to more pastel and ‘Spring’ colors, such as pink, green, yellow, etc.
The final product is an abstract and colorful depiction of flowers. Sometimes the flowers invert and create interesting sharp objects, like thorns of a rose. They also contribute to more detailed flowers, such as the process image above.
//Sammie Kim
//Section D
//sammiek@andrew.cmu.edu
//Project 07 - Curves
var nPoints = 360;

function setup() {
    createCanvas(480, 480);
}

function draw() {
    background(0);
    drawHypotrochoid();
    drawAstroid();
}

function drawHypotrochoid() {
    //constraining mouse within the canvas size
    var x = constrain(mouseX, 0, width);
    var y = constrain(mouseY, 0, height);
    //stroke color will also change based on the direction of mouse
    var rColor = map(mouseX, 0, width, 0, 230)
    var gColor = map(mouseY, 0, height, 0, 230)
    stroke(rColor, gColor, 200);
    strokeWeight(2);
    noFill();
    //Setting the parameters for the hypotrocoid
    push();
    translate(width/2, height/2); //starting the shape at the center of canvas
    var a = map(mouseX, 0, width, 0, 200); //the radius range of circle
    var b = map(mouseY, 0, height, 0, 50);
    var h = map(mouseX, 0, height, 0, 50);
    beginShape();
    //Hypotrochoid formula
    //http://mathworld.wolfram.com/Hypotrochoid.html
    for(var i = 0; i <= nPoints; i++) {
        var x = (a - b) * cos(i) + h * cos((a - b) / b * i);
        var y = (a - b) * sin(i) - h * sin((a - b) / b * i);
        vertex(x, y);
    }
    endShape();
    pop();
}

function drawAstroid(){
    var x = constrain(mouseX, 0, width);
    var y = constrain(mouseY, 0, height);
    push();
    noFill();
    strokeWeight(4);
    stroke("pink");
    translate(width / 2, height / 2);
    var a = map(mouseX, 0, width, 20, width / 3);
    beginShape();
    //Astroid formula
    //http://mathworld.wolfram.com/Astroid.html
    for (var i = 0; i < nPoints; i+= 0.5){
        var x = a * pow(cos(i), 3);
        var y = a * pow(sin(i), 3);
        vertex(x, y);
    }
    endShape();
    pop();
}
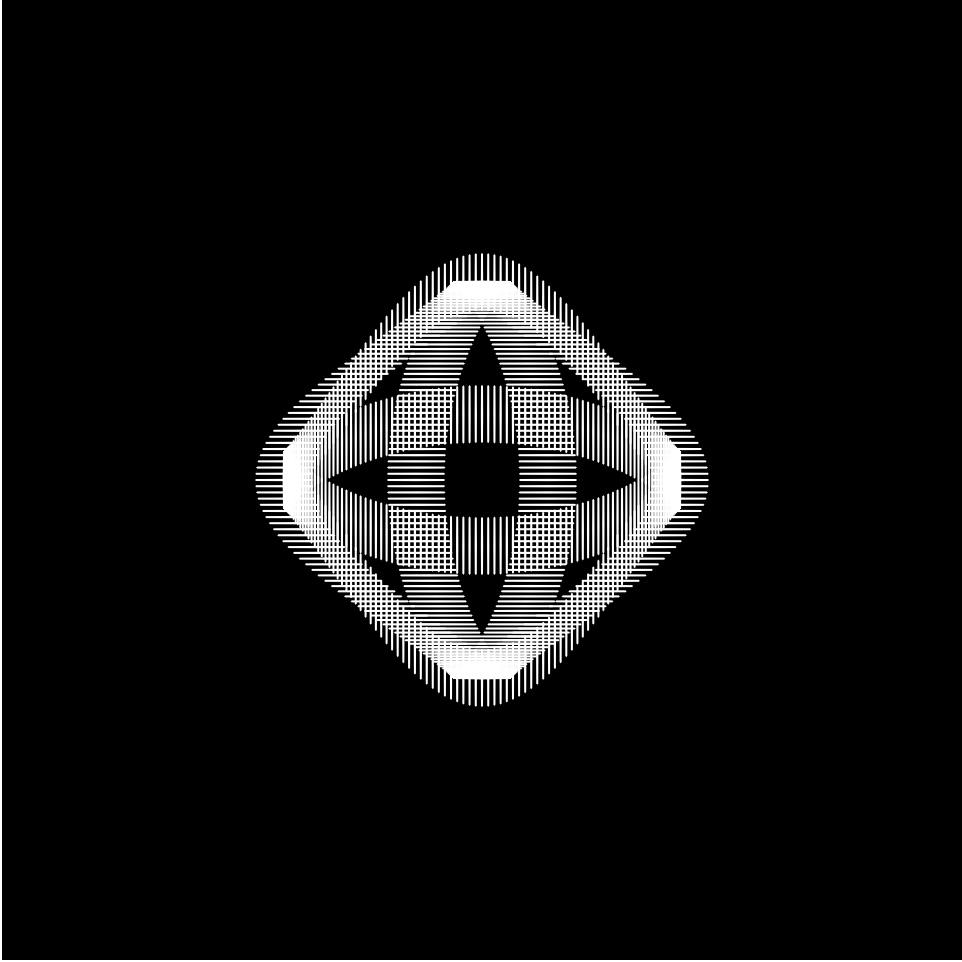
This project was challenging as I had to incorporate an interactive element within the hypotrochoid shape. It initially took a while to understand how I could flexibly use the map function, substituting different numbers to play with the range of mouse X and Y, then seeing the effects on screen. I also added a change to color as another element, where the R and G values would change depending on the mouse’s location. Afterwards, I created an astroid in the center that playfully interacts with the surrounding hypotrochoid. What intrigued me the most was how unexpected the shape would vastly change by rotating my mouse around the canvas, creating diverse shapes through intersection of lines.
When the max range of hypotrochoid value a is at (0, 10)
When the max range of hypotrochoid value a is at (0, 300)
// Timothy Liu
// 15-104, Section C
// tcliu@andrew.cmu.edu
// OpenProject-07

var nPoints = 1000; // number of points in each function. The more points, the smoother the function is.

// variables for white quadrifolium
var k;
var n;
var d;

// variables for blue quadrifolium
var k2;
var n2;
var d2;

// variables for flower center
var k3;
var n3;
var d3;

function setup() {
    createCanvas(480, 480);
    frameRate(30);
}

function draw() {
    background(160, 190, 255); // light blue background

    k = n / d; // k constant determines the number of petals on the white quadrifolium
    k2 = n2 / d2; // k constant determines the number of petals on the blue quadrifolium
    k3 = n3 / d3; // k constant determines the number of petals on the flower center

    arrow(); // drawing in the arrow function
    quadrifolium2(); // drawing in the blue flower underneath first
    quadrifolium(); // drawing in the white flower on top
    flowerCenter(); // drawing in the yellow center on top of the other two flowers
}

// the white flower/quadrifolium
function quadrifolium() {

    // these variables/constraints hold mouseX to the width of the canvas
    // mouseX1 slows down the speed of mouseX
    var mouseX1 = mouseX / 5;
    var mouseMove = constrain(mouseX1, 0, width / 5);

    // these variables/constants help determine the location of the flower via the equation and vertex
    var r;
    var x;
    var y;

    // n and d help determine the k constant, or the number of petals on the flower
    n = map(mouseMove, 0, width, 0, 36);
    d = 4;

    // a determines the size of the white petals
    var a = 150;

    // white flower colors
    stroke(255, 255, 255);
    strokeWeight(3);
    fill(255, 255, 255, 60);

    // drawing the white quadrifolium!
    beginShape();
    for (var i = 0; i < nPoints; i++) {

        var t = map(i, 0, nPoints, 0, TWO_PI * d); // determines theta (the angle)

        r = a * cos(k * t); // the equation that draws the quadrifolium

        x = r * cos(t) + width / 2; // these help compute the vertex (x, y) using the circular identity
        y = r * sin(t) + width / 2;
        vertex(x, y);
    }
    endShape();

}

// the blue flower/quadrifolium
function quadrifolium2() {

    // these variables/constraints hold mouseX to the width of the canvas
    // mouseX2 slows down the speed of mouseX
    var mouseX2 = mouseX / 5;
    var mouseMove2 = constrain(mouseX2, 0, width / 5);

    // these variables/constants help determine the location of the flower via the equation and vertex
    var r2;
    var x2;
    var y2;

    // n2 and d2 help determine the k2 constant, or the number of petals on the flower
    n2 = map(mouseMove2, 0, width, 0, 72);
    d2 = 6;

    // a2 determines the size of the blue petals (slightly longer than the white)
    var a2 = 155;

    // blue flower colors
    stroke(71, 99, 201);
    strokeWeight(2);
    fill(71, 99, 201, 140);

    // drawing the blue quadrifolium!
    beginShape();
    for (var u = 0; u < nPoints; u++) {
        var h = map(u, 0, nPoints, 0, TWO_PI * d2); // determine theta (the angle)

        r2 = a2 * cos(k2 * h); // the equation that draws the quadrifolium

        x2 = r2 * cos(h) + width / 2; // these help compute the vertex (x2, y2) using the circular identity
        y2 = r2 * sin(h) + width / 2;
        vertex(x2, y2);
    }
    endShape();

}

// the yellow center of the flower (also a smaller quadrifolium)
function flowerCenter() {

    // these variables/constraints hold mouseX to the width of the canvas
    // mouseX3 slows down the speed of mouseX
    var mouseX3 = mouseX / 5;
    var mouseMove3 = constrain(mouseX3, 0, width / 5);

    // these variables/constants help determine the location of the flower via the equation and vertex
    var r3;
    var x3;
    var y3;

    // n3 and d3 help determine the k3 constant, or the number of petals on the yellow center
    n3 = map(mouseMove3, 0, width, 0, 20);
    d3 = 5;

    // a3 determines the size of the yellow center quadrifolium
    var a3 = 30;

    // yellow center color
    stroke(247, 196, 12);
    strokeWeight(3);
    fill(247, 196, 12, 50);

    // drawing the yellow center quadrifolium!
    beginShape();
    for (var c = 0; c < nPoints; c++) {
        var e = map(c, 0, nPoints, 0, TWO_PI * d3); // determine theta (the angle)

        r3 = a3 * cos(k3 * e); // the equation that draws the quadrifolium

        x3 = r3 * cos(e) + width / 2; // these help compute the vertex (x3, y3) using the circular identity
        y3 = r3 * sin(e) + width / 2;
        vertex(x3, y3);
    }
    endShape();

}

// the blue arrow on the bottom that indicates which way to move the mouse... toward the right!
function arrow() {

    // variables for the line part of the arrow
    var lineH = height - 40;
    var lineS = width / 3;
    var lineE = 2 * width / 3;

    // variables for the arrowhead part of the arrow
    var arrowH1 = lineH - 5;
    var arrowHT = lineE + 10;
    var arrowH2 = lineH + 5;

    // the arrow!
    stroke(71, 99, 201);
    fill(71, 99, 201);
    strokeWeight(6);
    line(lineS, lineH, lineE, lineH);
    triangle(lineE, arrowH1, arrowHT, lineH, lineE, arrowH2);

}
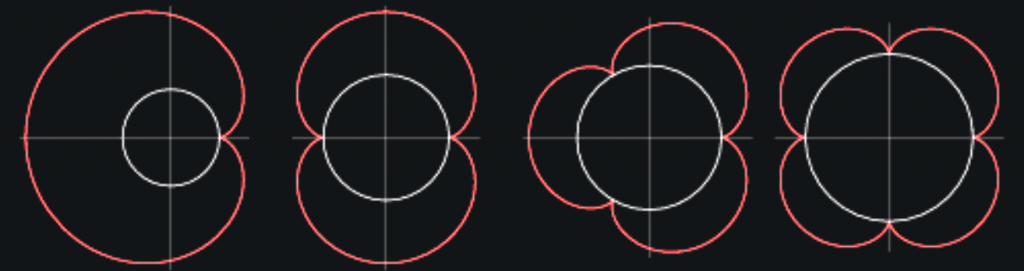
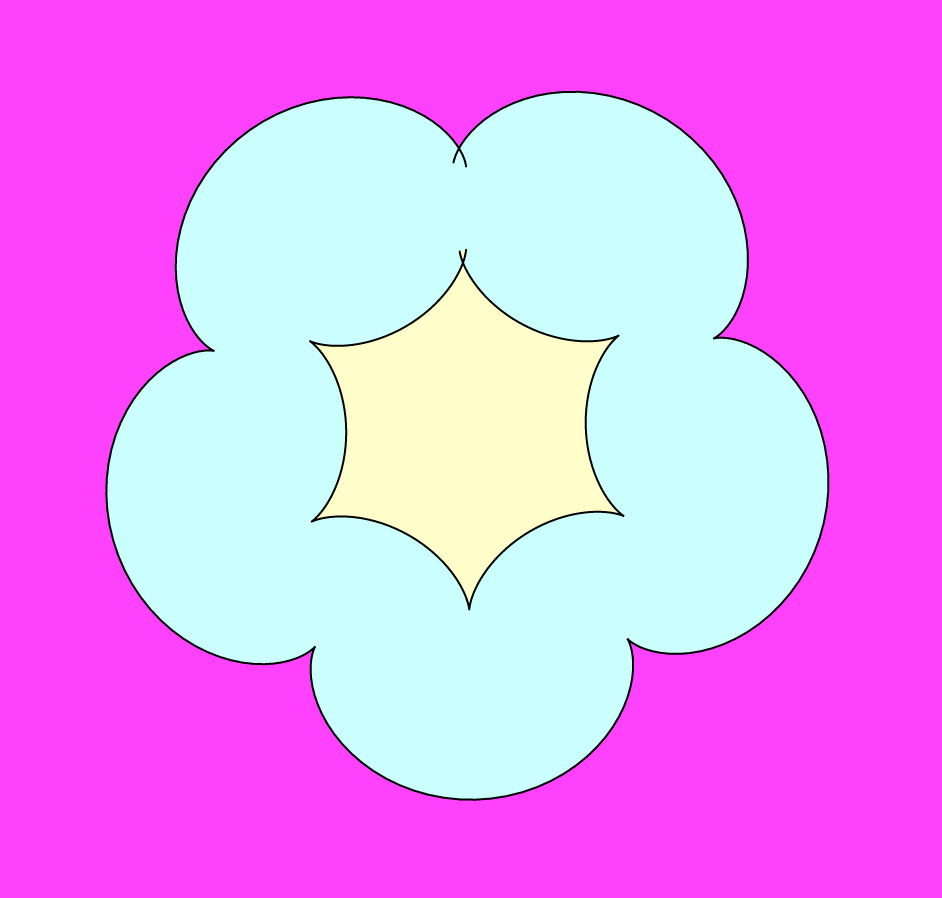
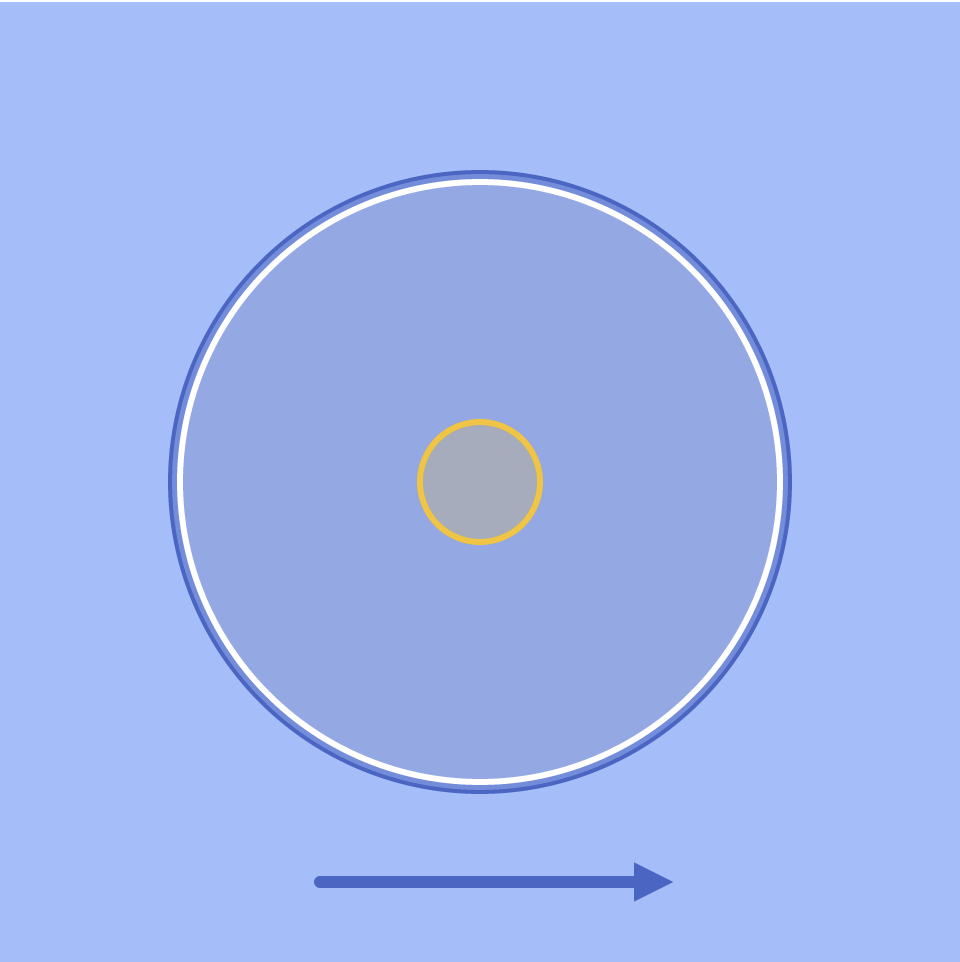
I struggled initially with this project because it had been so long since I mapped parametric curves in any class, let alone in a programming class. However, as I pored through Wolfram Alpha’s libraries, the Quadrifolium, or Rose Curve, immediately jumped out at me for its simplicity and elegance. I really loved how much it looked like a flower, and I thought it was really neat how the number of petals could be manipulated based on a simple constant k before the θ in the equation:
r = a * cos(kθ)
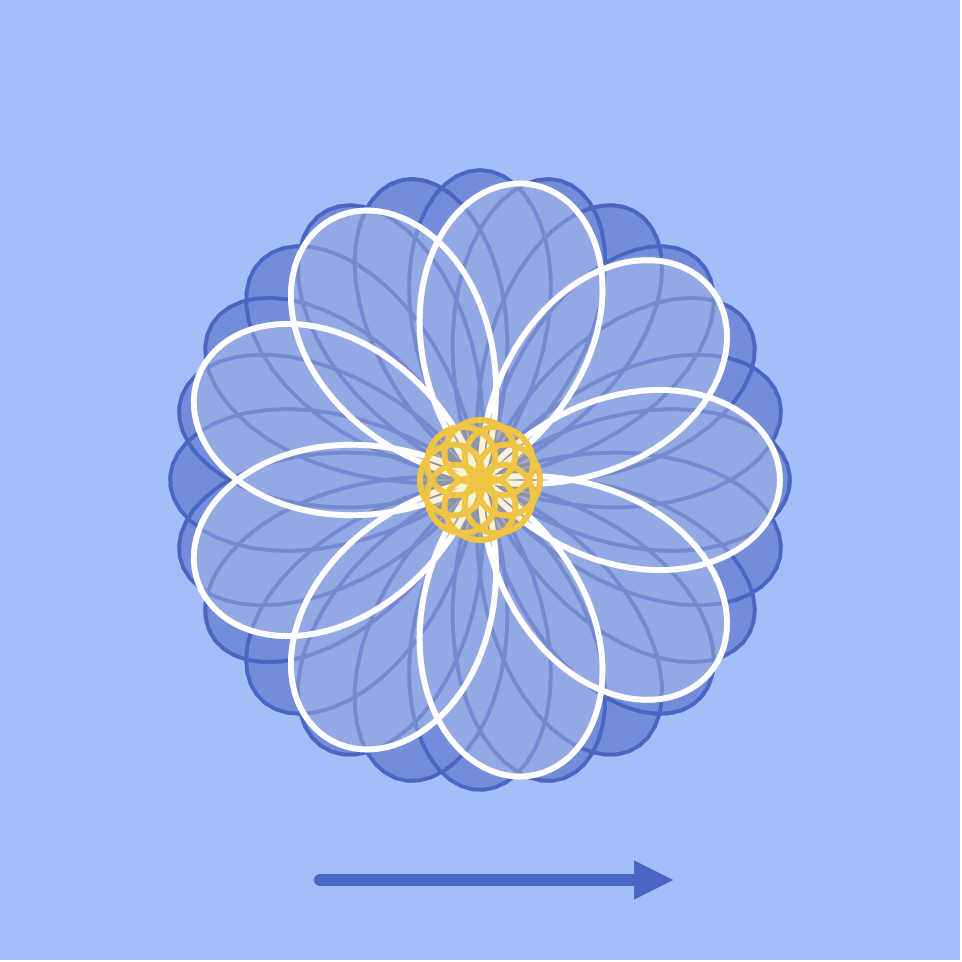
I knew that I wanted to make my quadrifolium feel like an actual flower, so I modeled my design after the blue Chrysanthemum flower.
Blue chrysanthemums, the inspiration for my flower design.
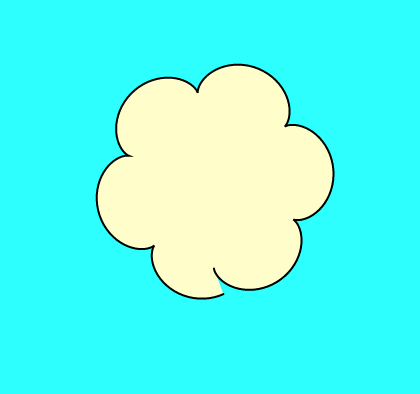
After I had drawn out the basic flower using multiple layers of quadrifolia, I decided to make my piece interactive by having the mouseX control the amount of petals on the flower. By doing so, I was able to make my design/curve “transform” from a basic circle into a beautiful flower!
The starting point of my flower……to the ending point, with petals!
//Caroline Song
//chsong@andrew.cmu.edu
//Section E
//Project 07-Curves

var nPoints = 800;

function setup (){
    createCanvas(480, 480);
}

function draw(){
    background(0);
    //calling functions
    drawHypotrochoid1();
    drawHypotrochoid2();
    drawHypotrochoid3();
}

function drawHypotrochoid1() {
    //Hypotrochoid
    //http://mathworld.wolfram.com/Hypotrochoid.html

    //setting variables for light pink hypotrichoid
    var x1 = constrain(mouseX, 0, width);
    var y1 = constrain(mouseY, 0, height);
    var a1 = 100;
    var b1 = map(mouseY, 0, 500, 0, width);
    var h1 = map(mouseX/10, 0, 500, 0, height);

    push();
    //light pink stroke
    noFill();
    stroke(251, 227, 255);
    strokeWeight(2);
    translate(width/2, height/2); //translate hypotrochoid to middle of canvas
    beginShape();
    for(var i = 0; i < nPoints; i++) {
        var t1 = map(i, 0, 100, 0, TWO_PI);
        x1 = (a1 - b1)*cos(t1) + h1*cos(((a1 - b1)/ b1) * t1);
        y1 = (a1 - b1)*sin(t1) - h1*sin(((a1 - b1)/ b1) * t1);
        vertex(x1, y1);
    }
    endShape(CLOSE);
    pop();

}

function drawHypotrochoid2() {
    //Hypotrochoid
    //http://mathworld.wolfram.com/Hypotrochoid.html

    //setting variables for pink hypotrichoid on the edges of canvas
    var x2;
    var y2;
    var a2 = 300;
    var b2 = 20;
    var h2 = constrain(mouseY/10, 0, height);

    push();
    noFill();
    stroke(237, 162, 250);
    strokeWeight(2);
    translate(width/2, height/2); //translate to middle of canvas
    beginShape();
    for(var i = 0; i < nPoints; i++) {
        var t2 = map(i, 0, 100, 0, TWO_PI);

        x2 = (a2 - b2)*cos(t2) + h2*cos(((a2 - b2)/ b2) * t2);
        y2 = (a2 - b2)*sin(t2) - h2*sin(((a2 - b2)/ b2) * t2);
        vertex(x2, y2);
    }
    endShape(CLOSE);
    pop();

}

function drawHypotrochoid3() {
    //Hypotrochoid
    //http://mathworld.wolfram.com/Hypotrochoid.html

    //setting variables for dark pink hypotrochoid
    var x3;
    var y3;
    var a3 = 600;
    var b3 = 50;
    var h3 = mouseY;

    noFill();
    stroke(227, 92, 250);
    strokeWeight(4);
    translate(width/2, height/2); //translate to middle of canvas
    beginShape();
    for(var i = 0; i < nPoints; i++) {
        var t3 = map(i, 0, 100, 0, TWO_PI);

        x3 = (a3 - b3)*cos(t3) + h3*cos(((a3 - b3)/ b3) * t3);
        y3 = (a3 - b3)*sin(t3) - h3*sin(((a3 - b3)/ b3) * t3);
        vertex(x3, y3);
    }
    endShape(CLOSE);

}
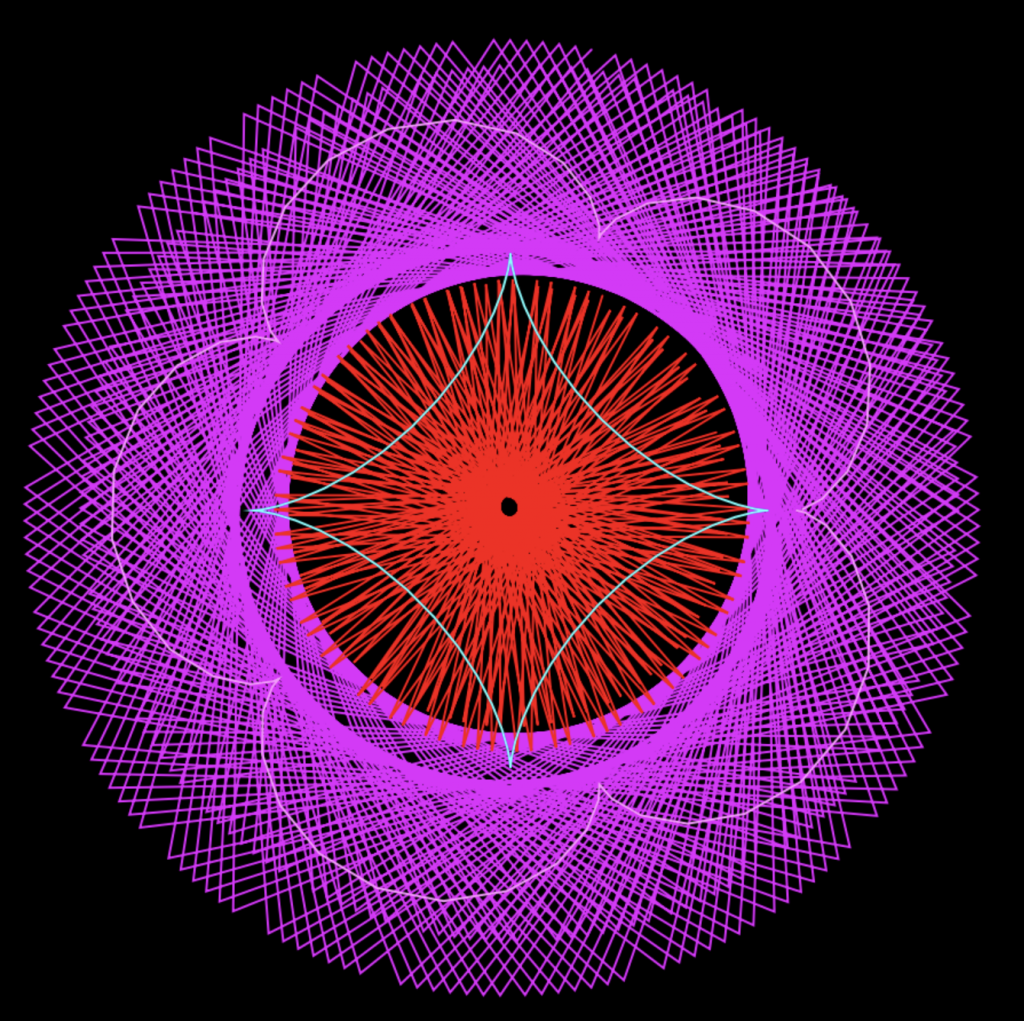
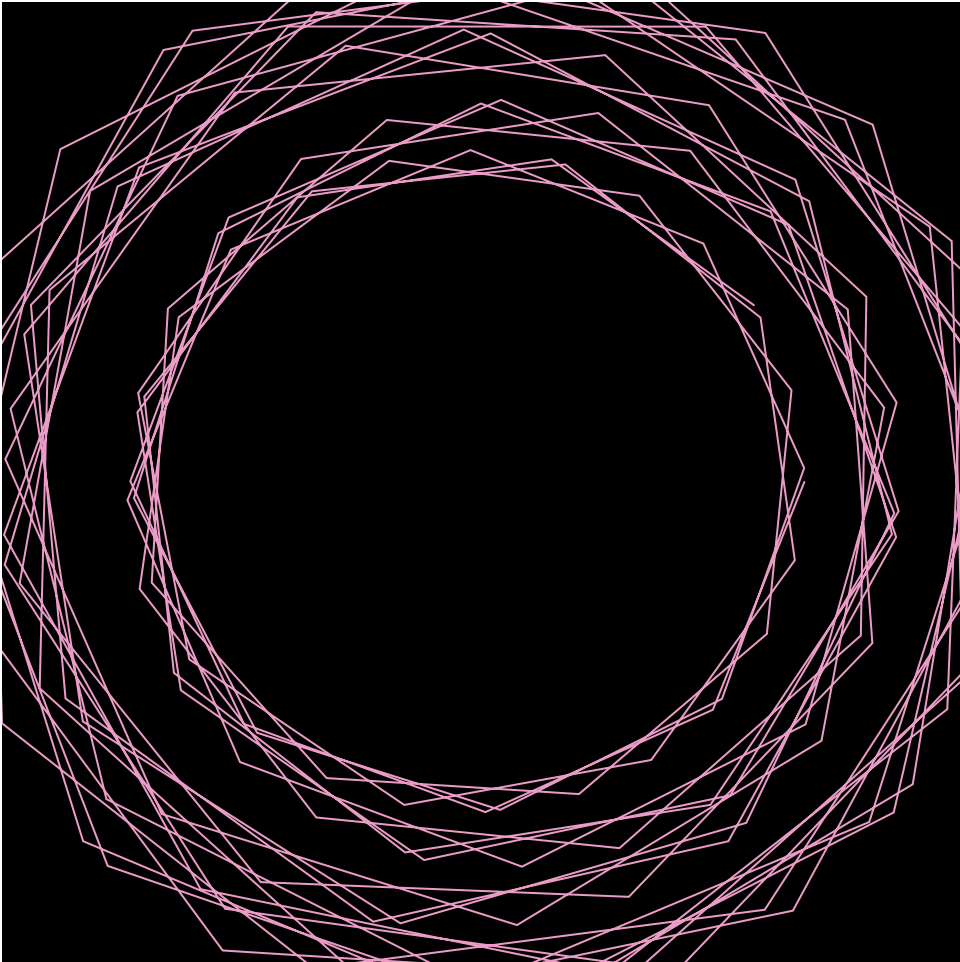
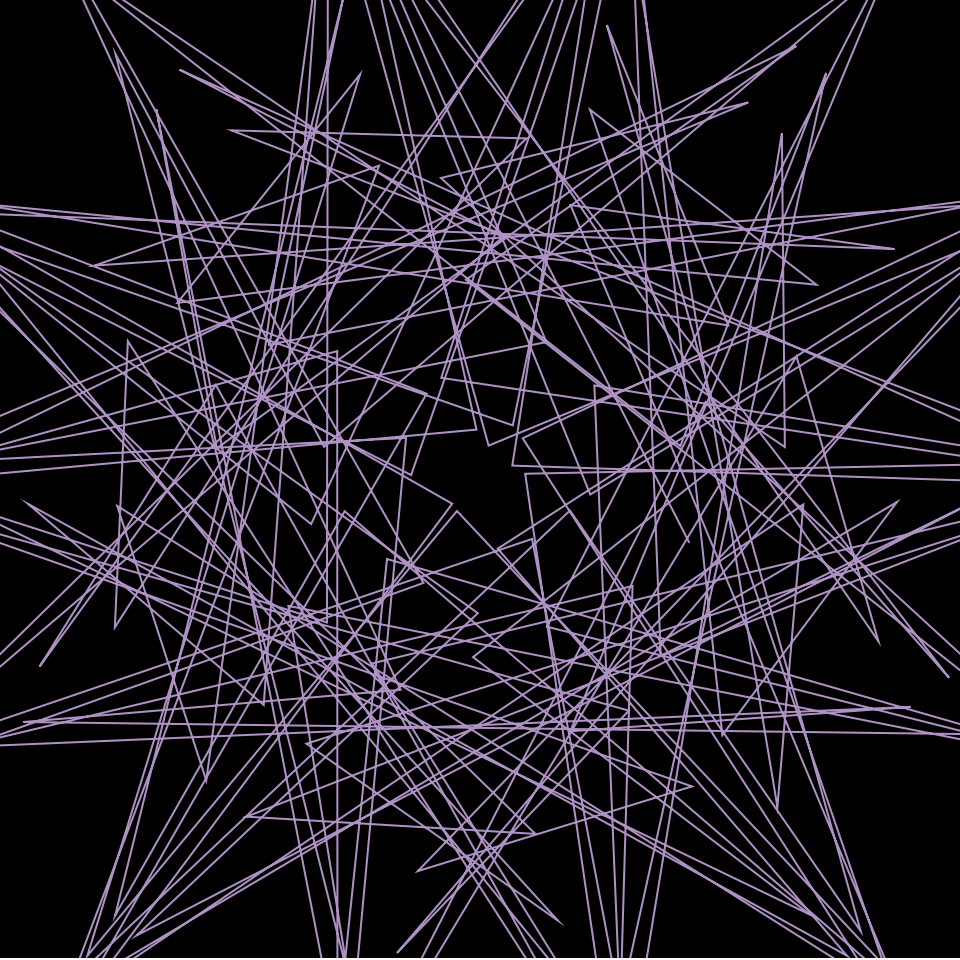
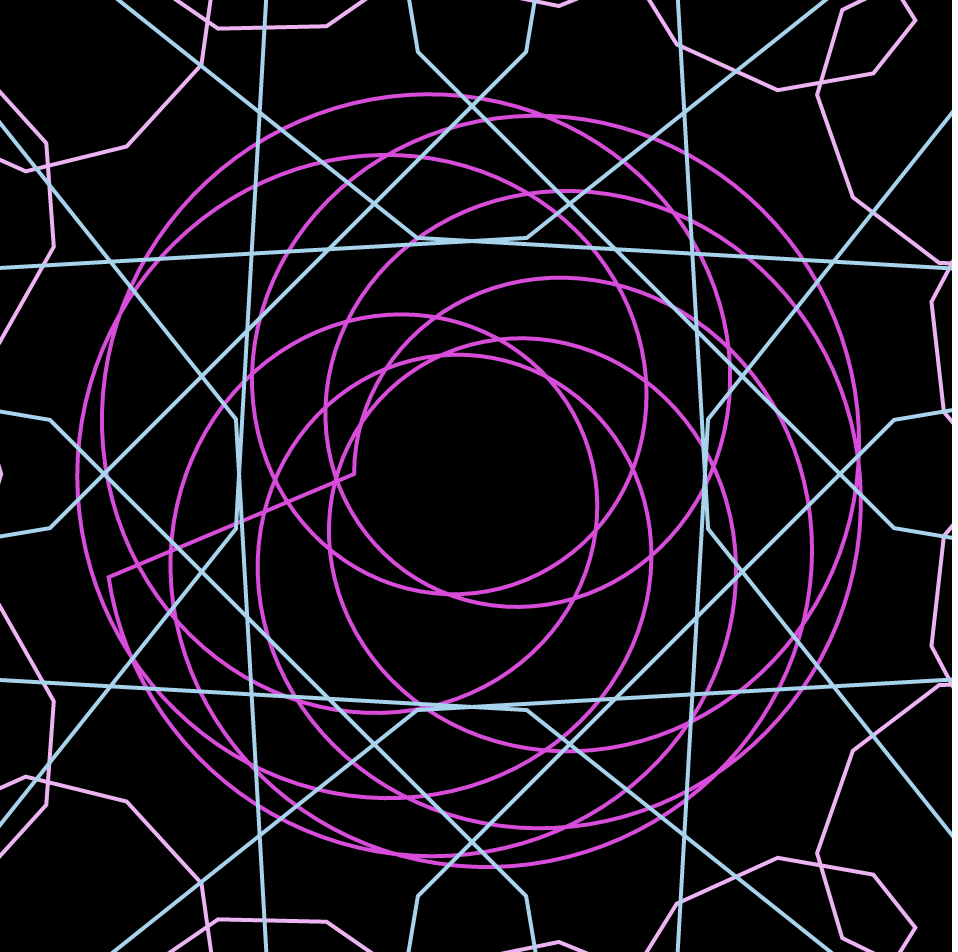
During the project, I didn’t know exactly what I was looking for. I spent a lot of time on the MathWorld site simply trying to decide what kind of curves to play with. I ended up playing with different epispirals and astroids before becoming intrigued with hypotrochoids. I started playing around with the equations itself, plugging in different numbers to simply experiments with how that affects the curve and the interaction it has with the canvas.
First iteration of my project
Playing around with different colorsSecond iteration of my project
![[OLD FALL 2019] 15-104 • Introduction to Computing for Creative Practice](../../../../wp-content/uploads/2020/08/stop-banner.png)