![[OLD FALL 2019] 15-104 • Introduction to Computing for Creative Practice](../../../../wp-content/uploads/2020/08/stop-banner.png)
/*
Hyejo Seo
Section A
hyejos@andrew.cmu.edu
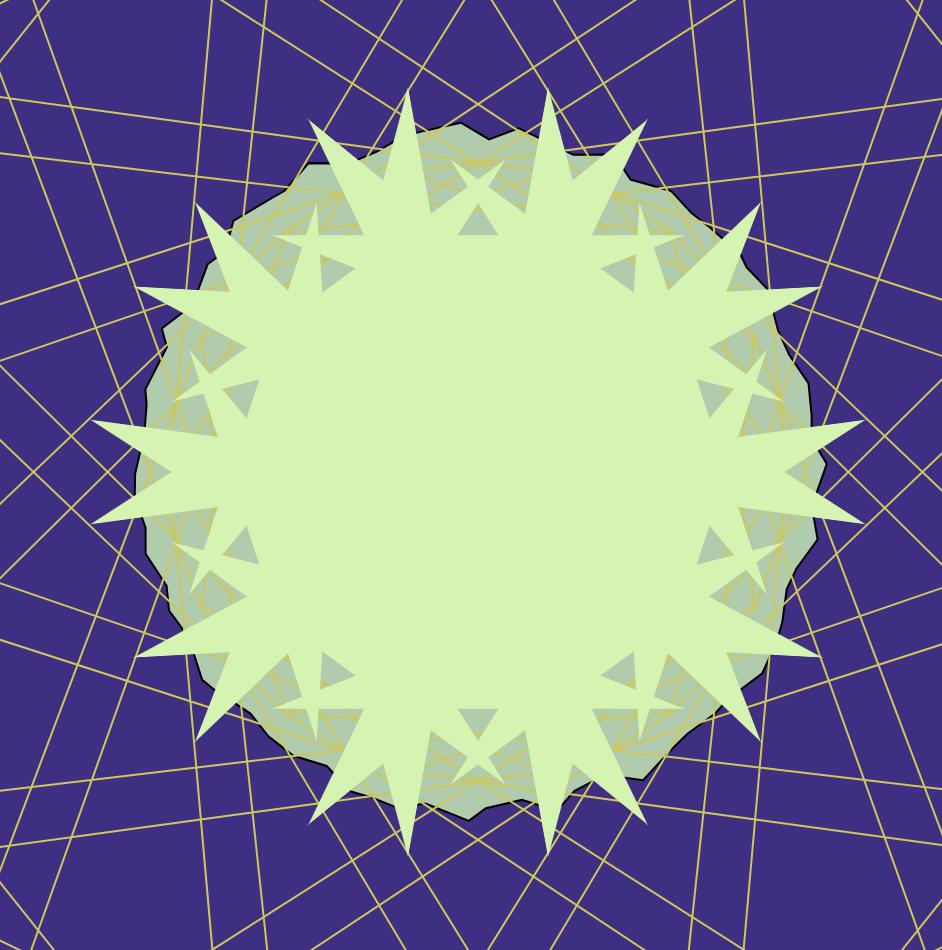
Project 7 - Curves
*/
var nPoints = 200;
var angle = 0;
function setup() {
createCanvas(480,480);
frameRate(20);
}
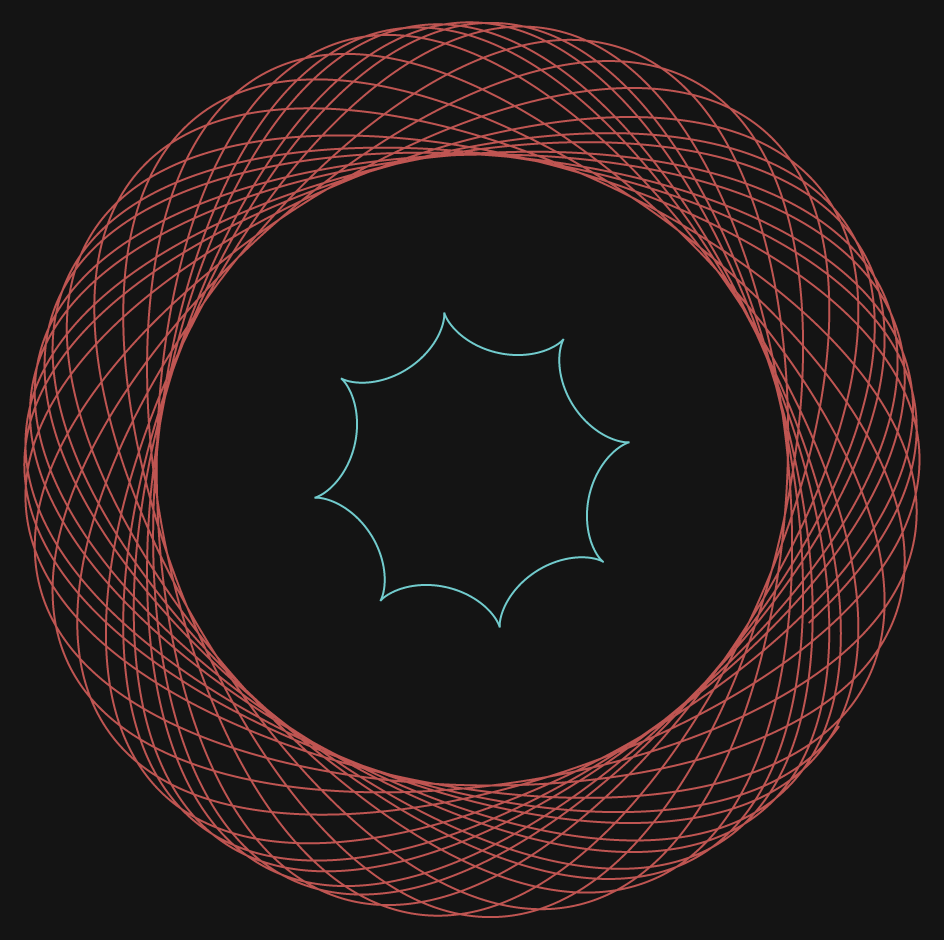
function draw() {
background(56, 63, 81);
// placing Hypocycloid to be centered in the cavas
push();
translate(width/2, height/2);
drawHypocycloid();
pop();
// Making two ranunculoids rotate depending on mouseX position
push();
translate(width/2, height/2);
rotate(radians(angle));
angle += mouseX;
drawRanunculoid();
drawRanunculoid2();
pop();
}
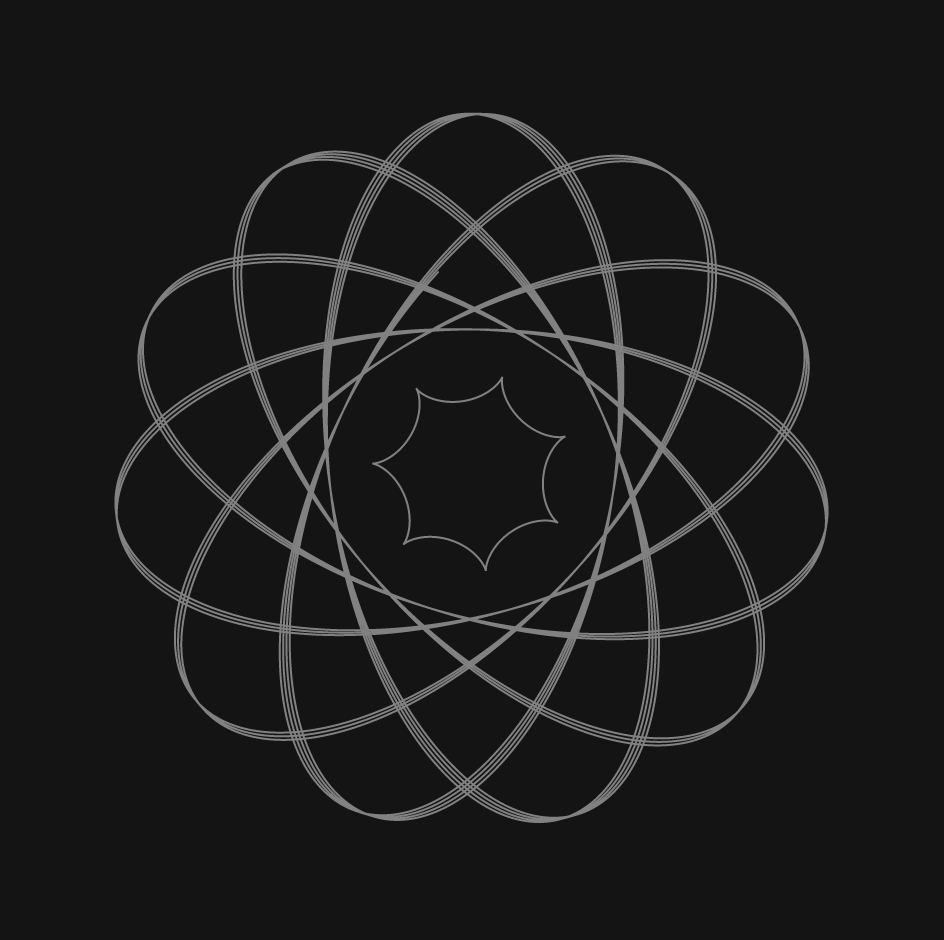
function drawHypocycloid(){
var xh;
var yh;
var ah = map(mouseY, 0, 480, 150, 200);
var bh = 15;
var hh = mouseX / 25;
stroke(255, 200, 200);
strokeWeight(5);
noFill();
beginShape();
// drawing hypocycloid
for (var i = 0; i < nPoints; i++) {
var tH = map(i, 0, nPoints, 0, TWO_PI);
xh = (ah - bh) * cos(tH) + hh * cos((ah - bh) / bh * tH);
yh = (ah - bh) * sin (tH) - hh * sin((ah - bh) / bh * tH);
vertex(xh, yh);
}
endShape(CLOSE);
}
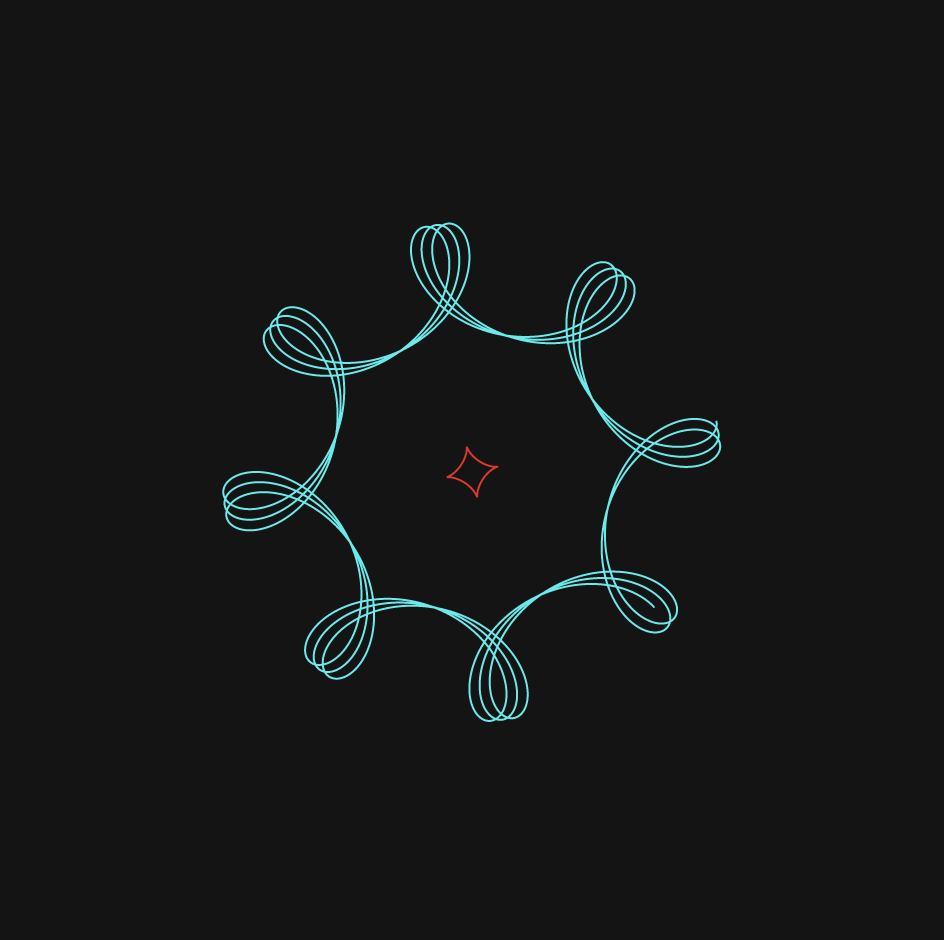
function drawRanunculoid(){
var ar = 20;
stroke(255, 159, 28);
strokeWeight(5);
noFill();
beginShape();
// drawing ranunculoid, for this one, I didn't need small increments with mapping
for (var i = 0; i < nPoints; i += 0.3){
var xr = ar * (8 * cos (i) - cos (8 * i));
var yr = ar * (8 * sin (i) - sin (8 * i));
vertex(xr, yr);
}
endShape();
}
function drawRanunculoid2(){
var ar2 = 15;
fill(215, 252, 212);
noStroke();
beginShape();
// drawing second ranunculoid
for (var i = 0; i < nPoints; i += 0.3){
var xr2 = ar2 * (6 * cos (i) - cos (6 * i));
var yr2 = ar2 * (6 * sin (i) - sin (6 * i));
vertex(xr2, yr2);
}
endShape();
}
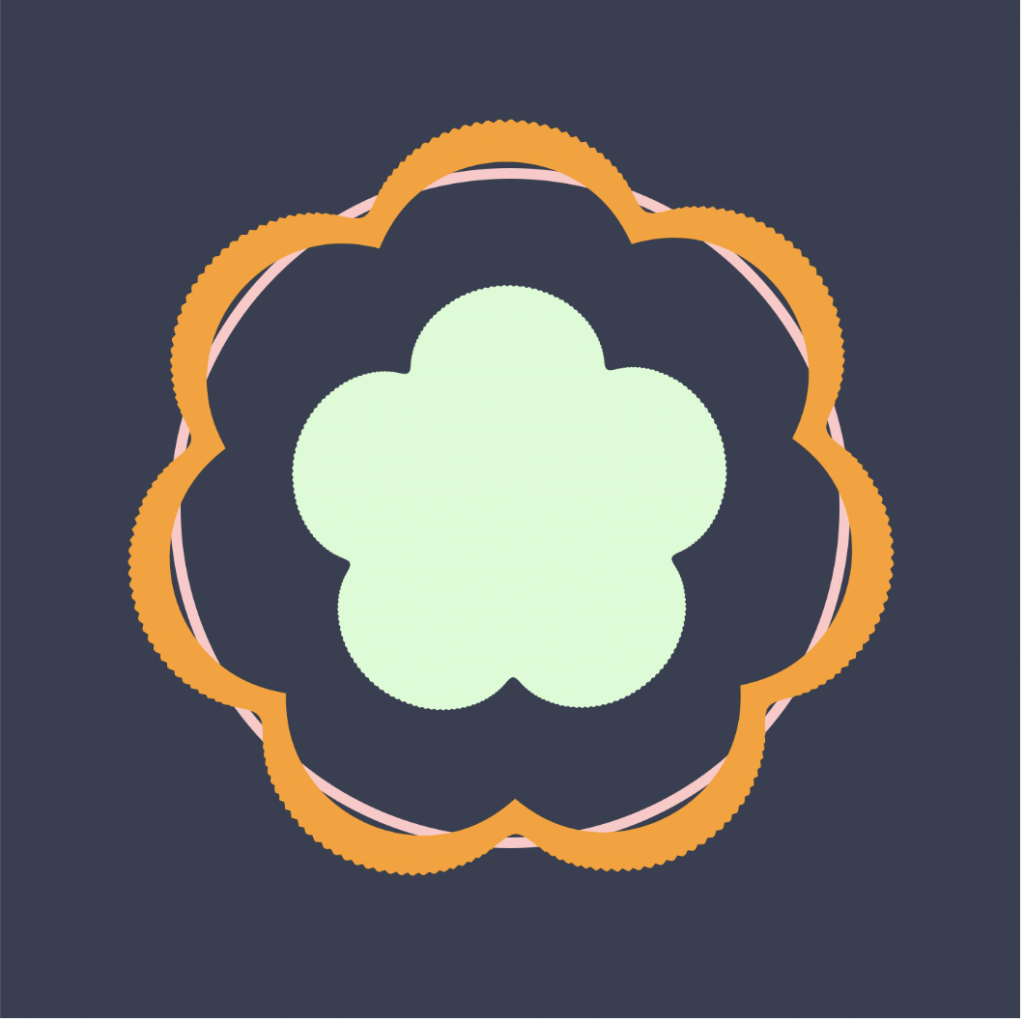
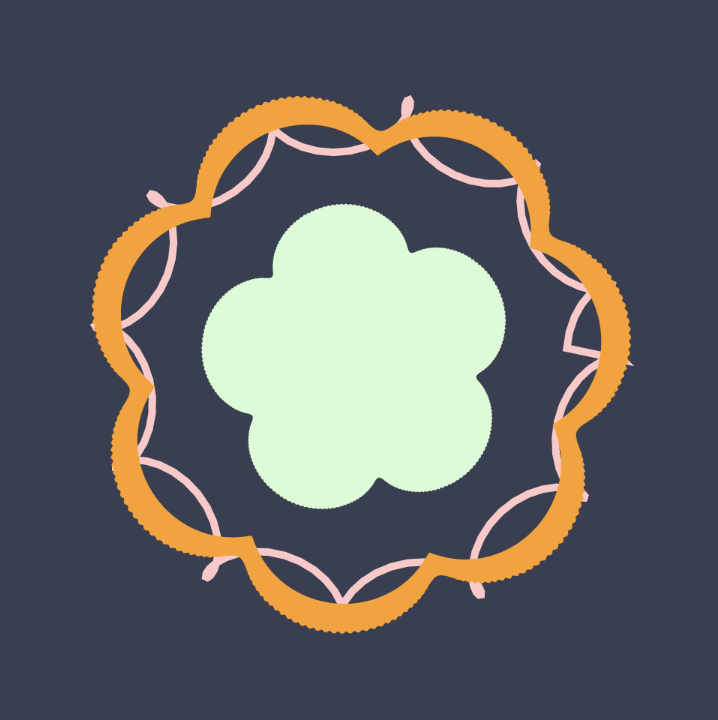
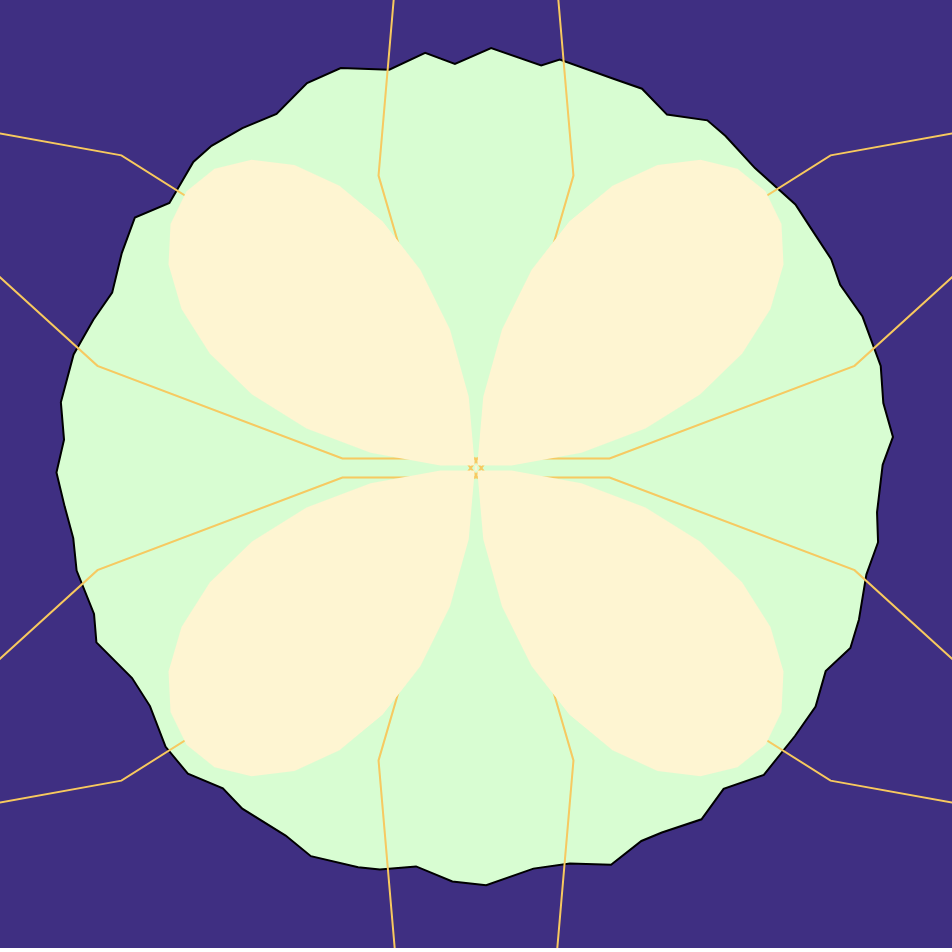
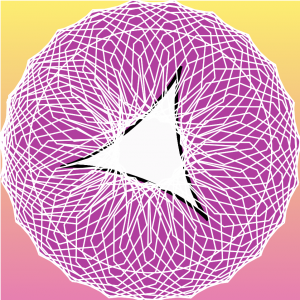
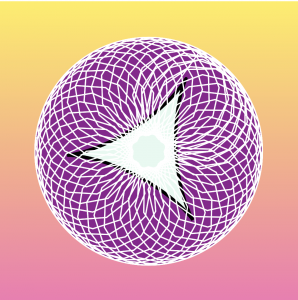
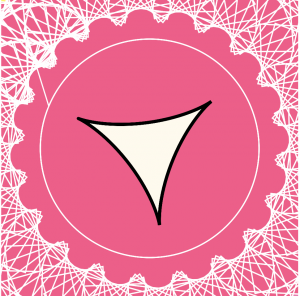
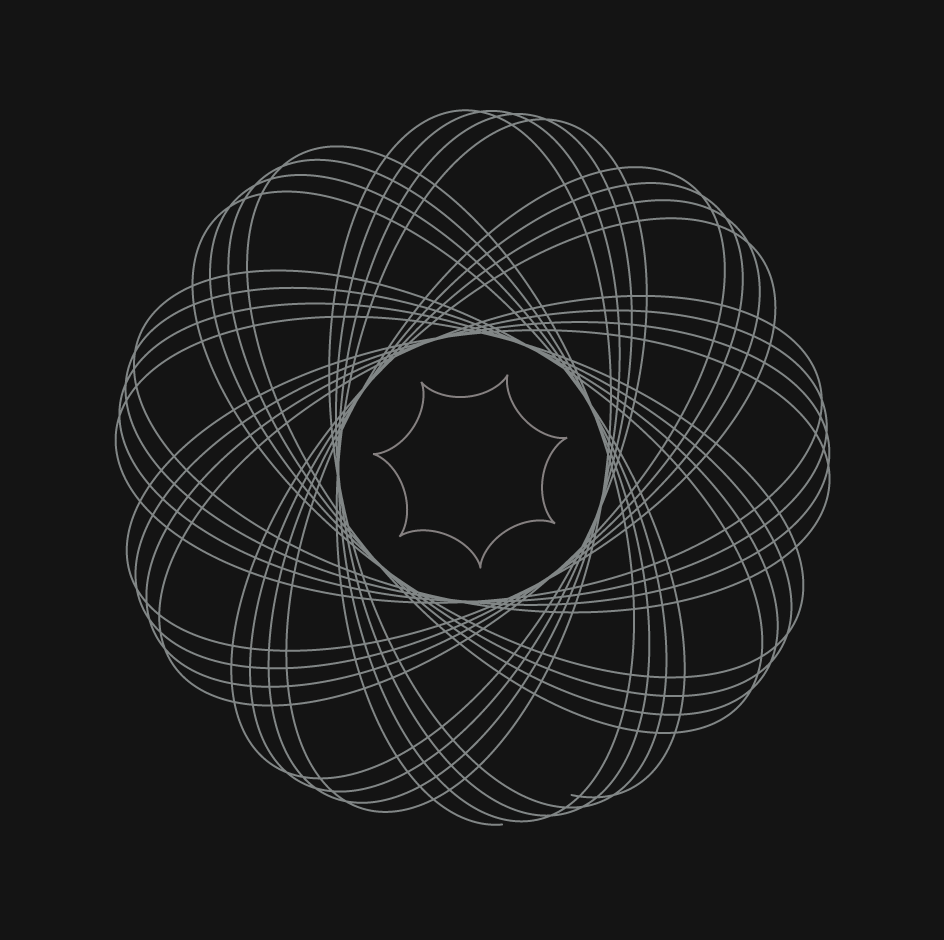
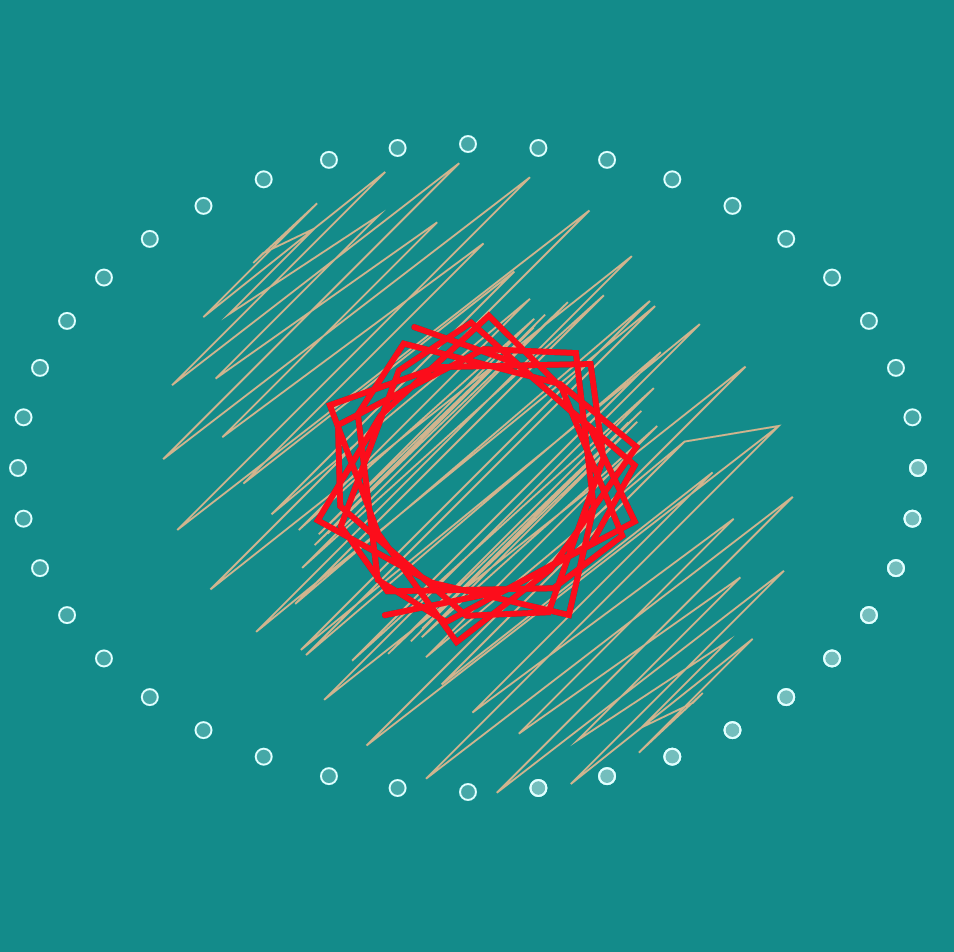
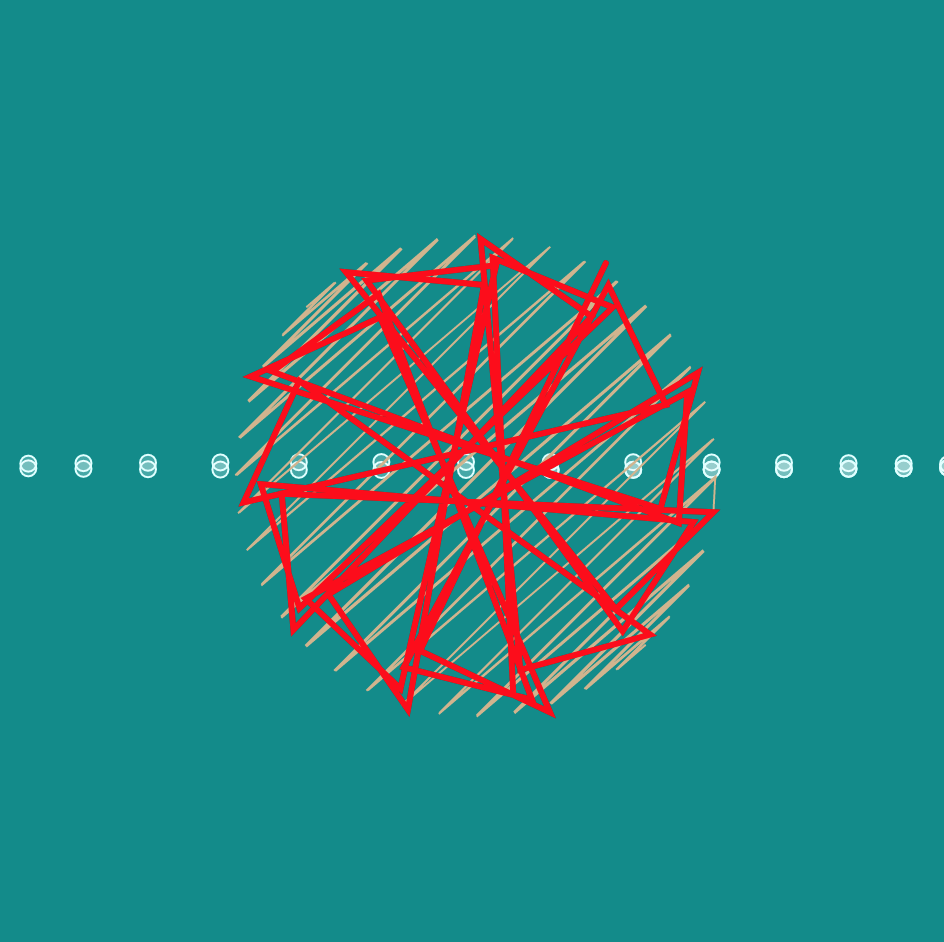
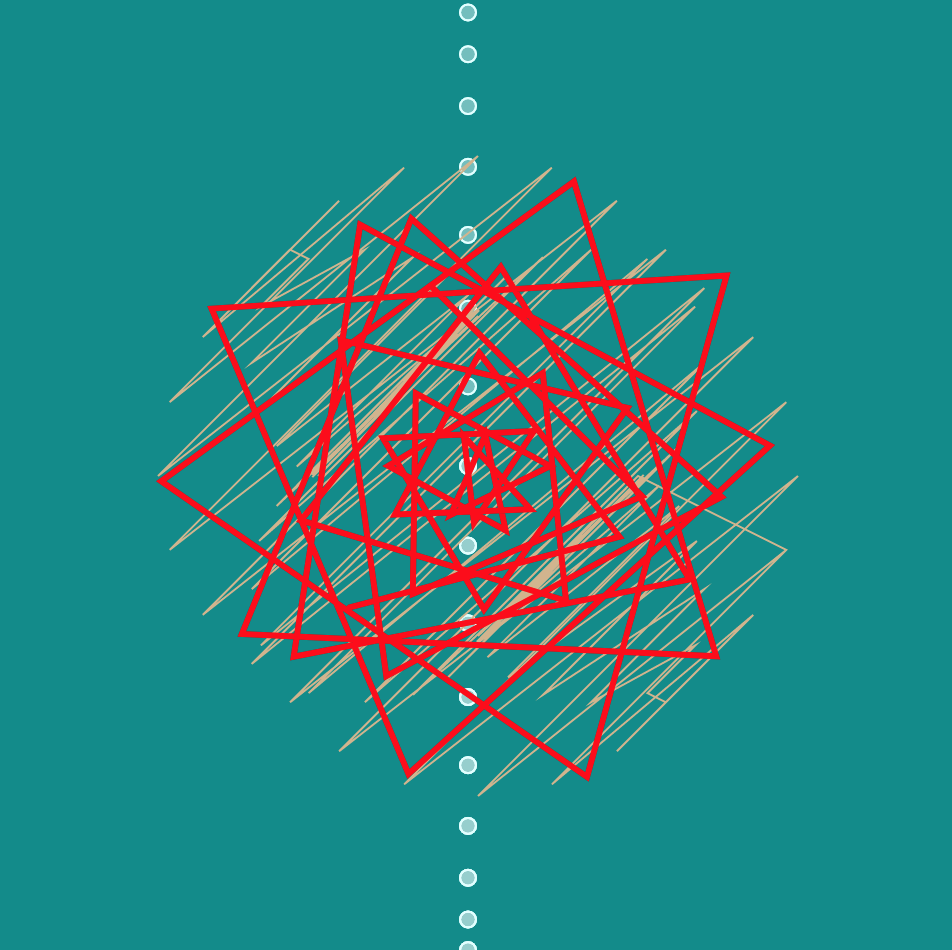
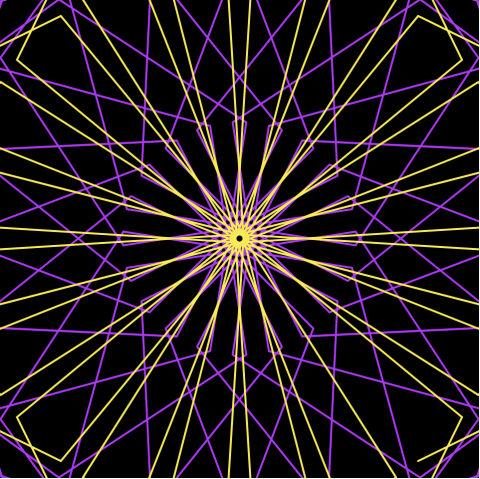
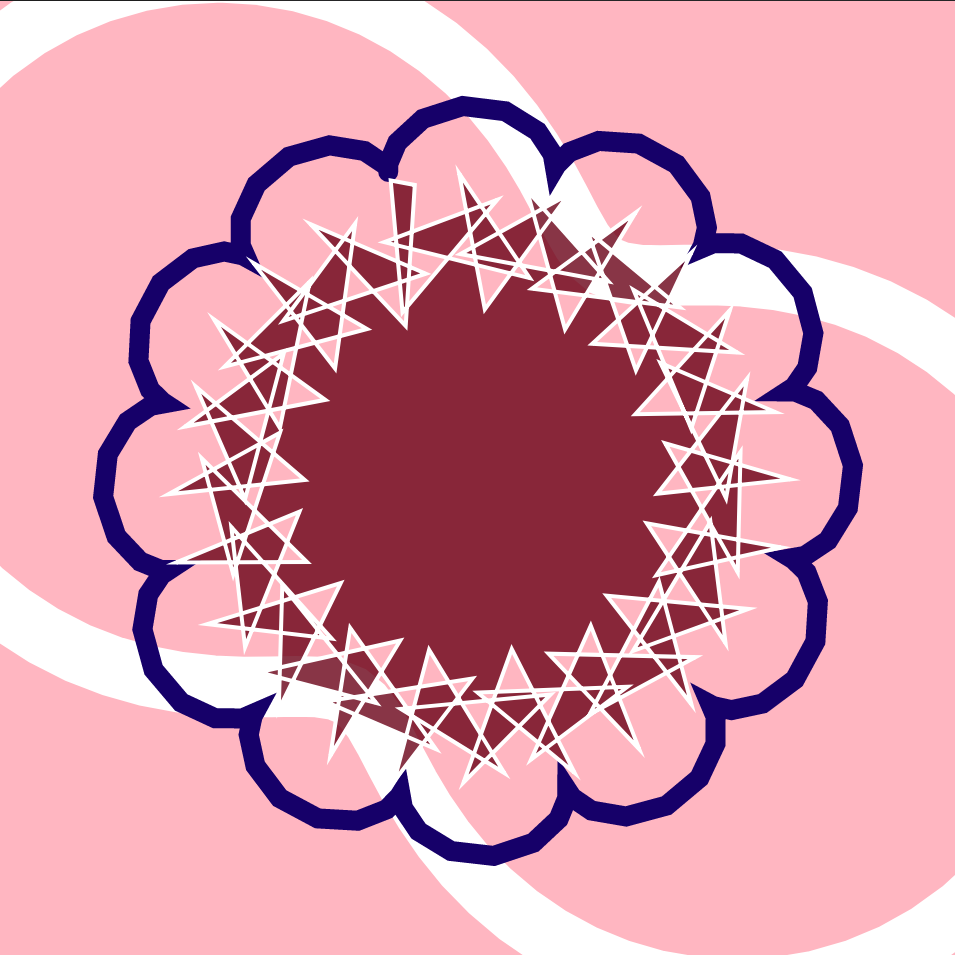
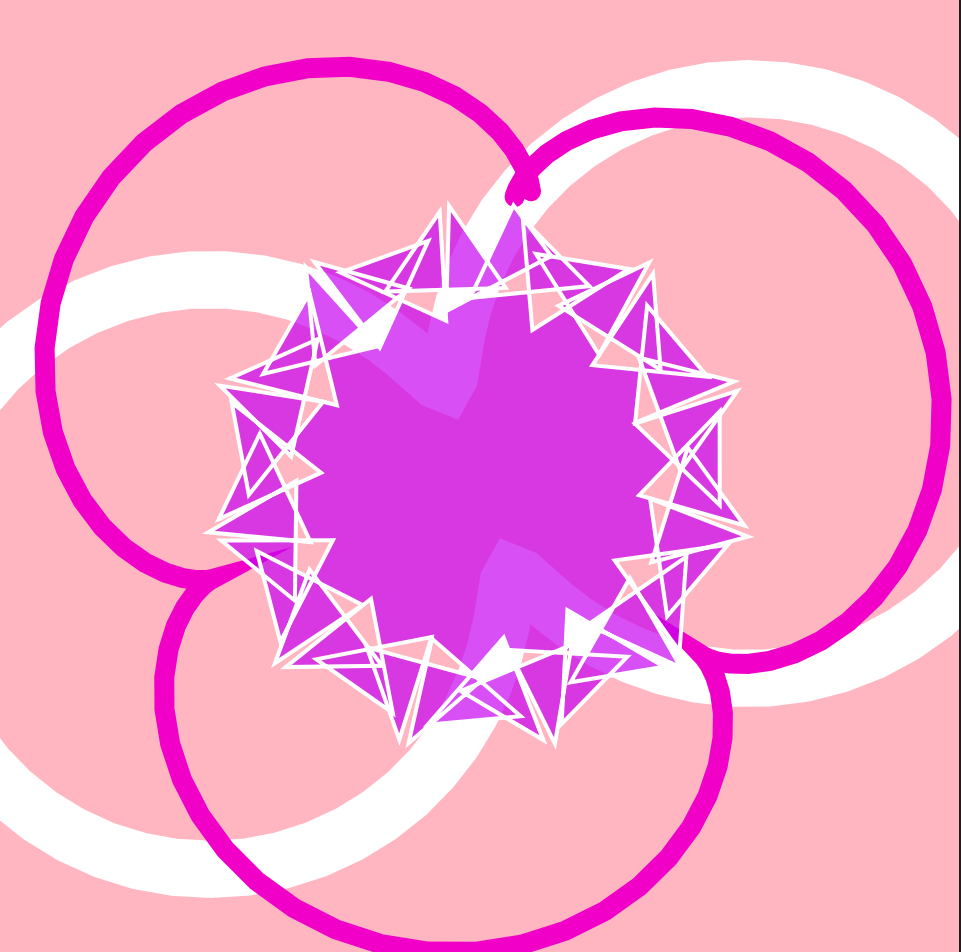
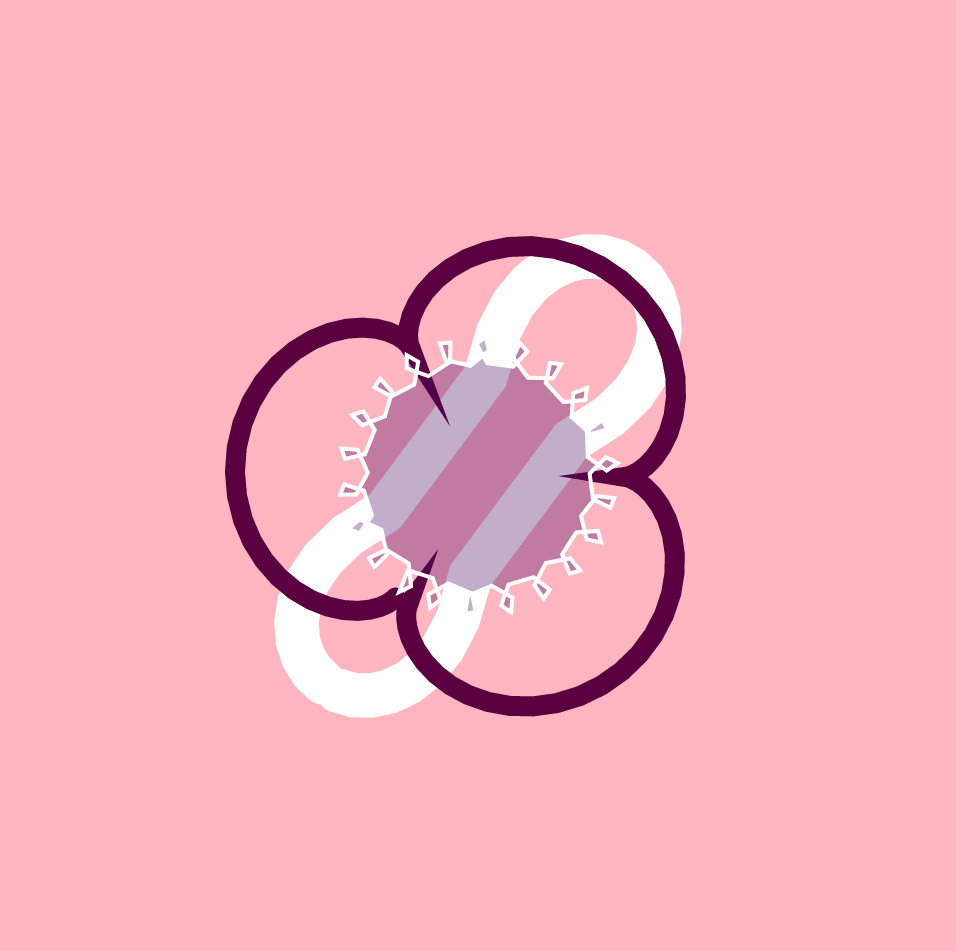
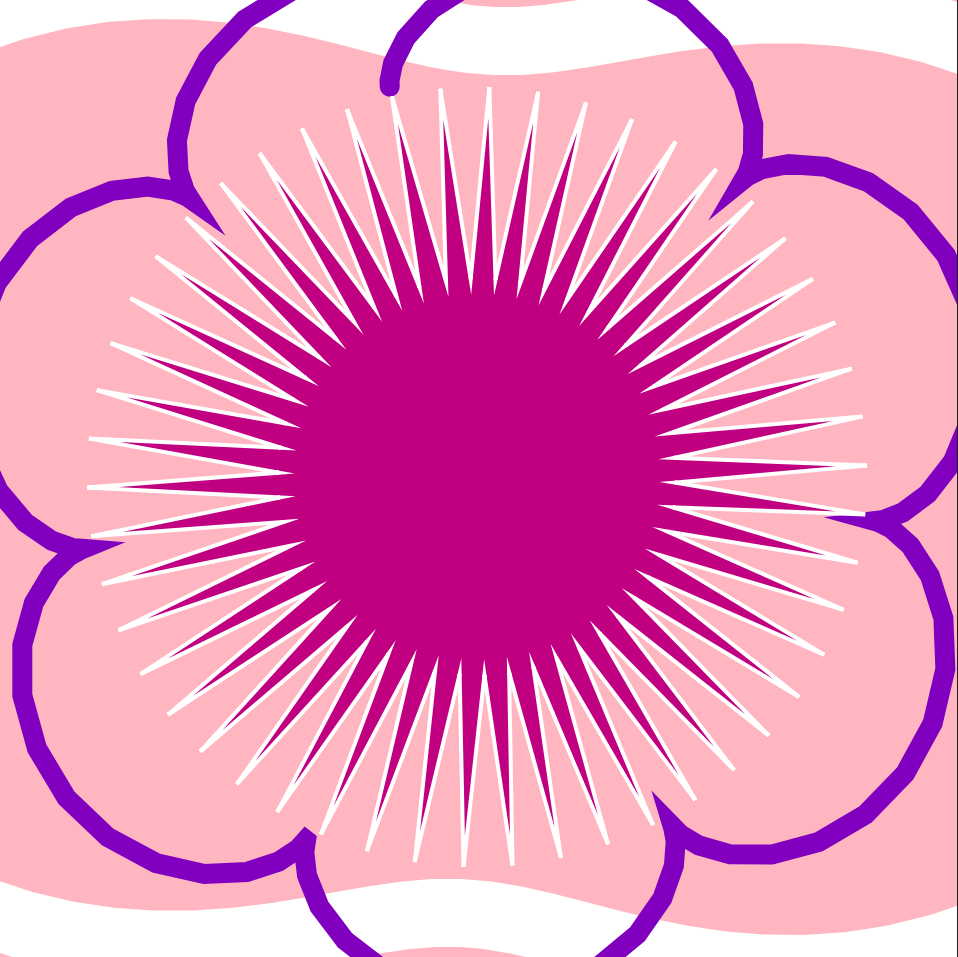
I spent fair amount of time browsing the Mathworld Curves website. How I approached this project was, instead of trying to plan the big picture (unlike the other projects), I chose one curve shape I liked and started there. Then, I slowly added other shapes. Unintentionally, my final work looks like a flower, which I am happy with. As the rotation gets faster and the hypercycloid expands, it almost looks like a blooming flower. Overall, it was interesting to play around with different math equations.