Katrina Hu – Project 07 – Curves

sketch_project07

/*Katrina Hu
15104-C
kfh@andrew.emu.edu
Project-07*/

var nPoints = 100;

function setup() {
    createCanvas(480, 480);
    background(0);
}

function draw() {
    push();
    translate(width/2, height/2);
    drawHypotrochoid();
    drawAstroid();
    pop();

}

function drawHypotrochoid() {
    var x;
    var y;
    //mouse used to change color
    var r = constrain(mouseX, 0, 255);
    var g = constrain(mouseY, 0, 255);
    var b = constrain(mouseY, 200, 255);
    //stroke appearance
    stroke(r, g, b);
    strokeWeight(1);
    noFill();
    //hypotrochoid equation
    var a = map(mouseX, 0, 600, 0, 300);
    var b = 10
    var h = map(mouseY, 0, 600, 2, 105);
    beginShape();
    for (var i = 0; i < nPoints; i++ ) {
        var angle1 = map(i, 0, nPoints, 0, TWO_PI);
        //equation of hypotrochoid
        x = (a - b) * cos(angle1) + h * cos((a - b) * (angle1 / b));
        y = (a - b) * sin(angle1) - h * sin((a - b) * (angle1 / b));
        vertex(x, y);
    }

  endShape();
}

function drawAstroid() {
    //mouse used to change color
    var r = constrain(mouseX, 200, 255);
    var g = constrain(255, mouseY/4, 50);
    var b = constrain(mouseY, 200, 255);
    //stroke appearance
    stroke(r, g, b);
    strokeWeight(2);
    noFill();
    //asteroid equation
    var a = int(map(mouseX, 0, width, 4, 10));
    var b = int(map(mouseX, 0, width, 0, 100));
    beginShape();
    for (var i = 0; i < nPoints; i++){
        angle1 = map(i, 0, nPoints, 0, TWO_PI);
        //equation of Astroid
        x = (b / a) * ((a - 1) * cos(angle1) + cos((a - 1) * angle1));
        y = (b / a) * ((a - 1) * sin(angle1) - sin((a - 1) * angle1));
        vertex(x,y);
    }
    endShape();

}


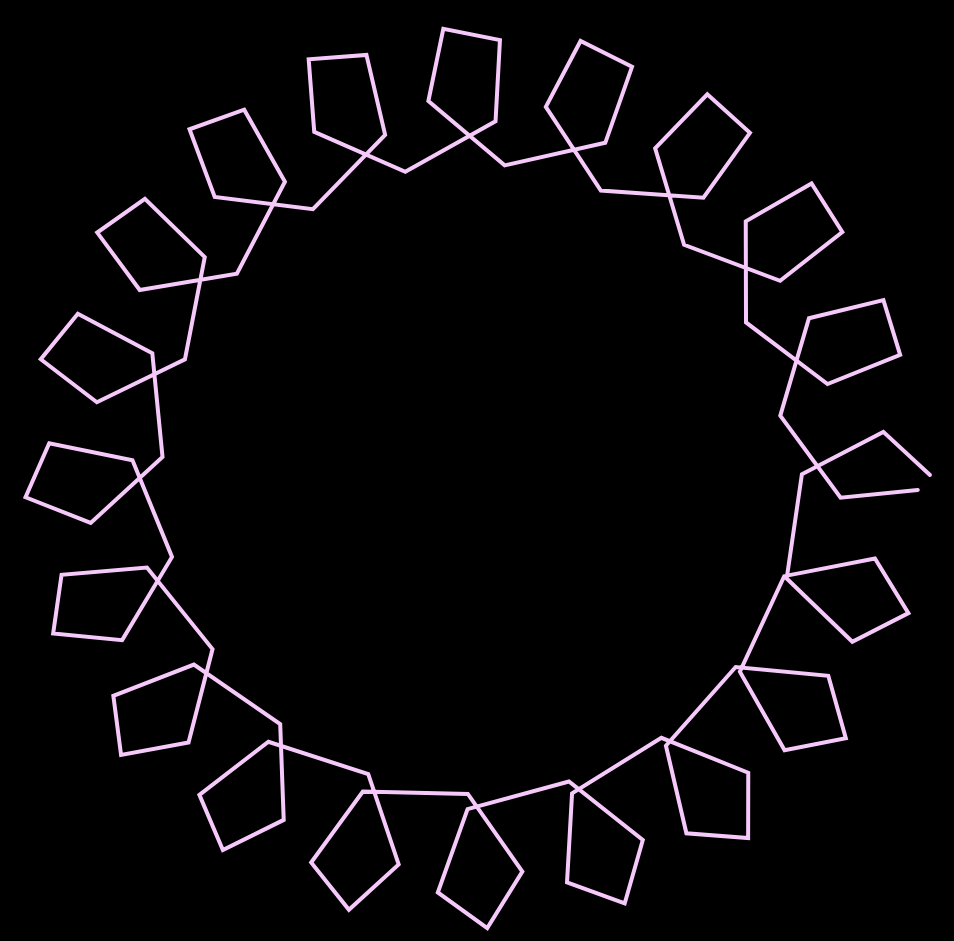
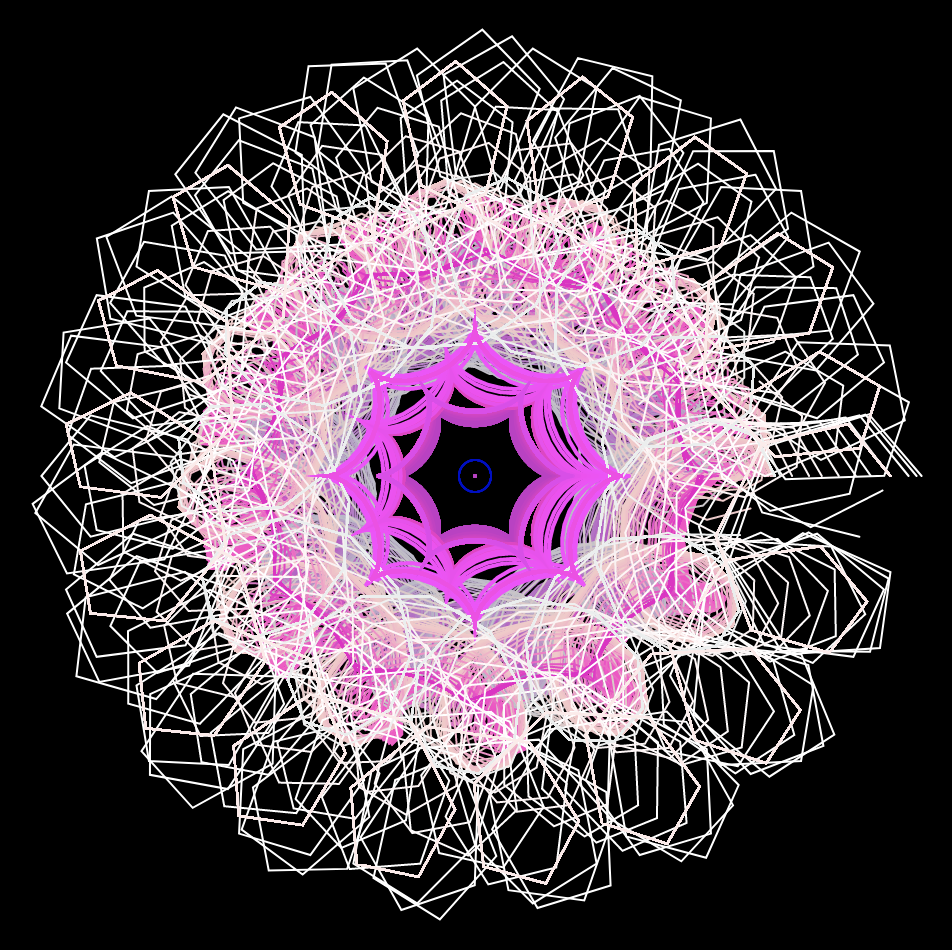
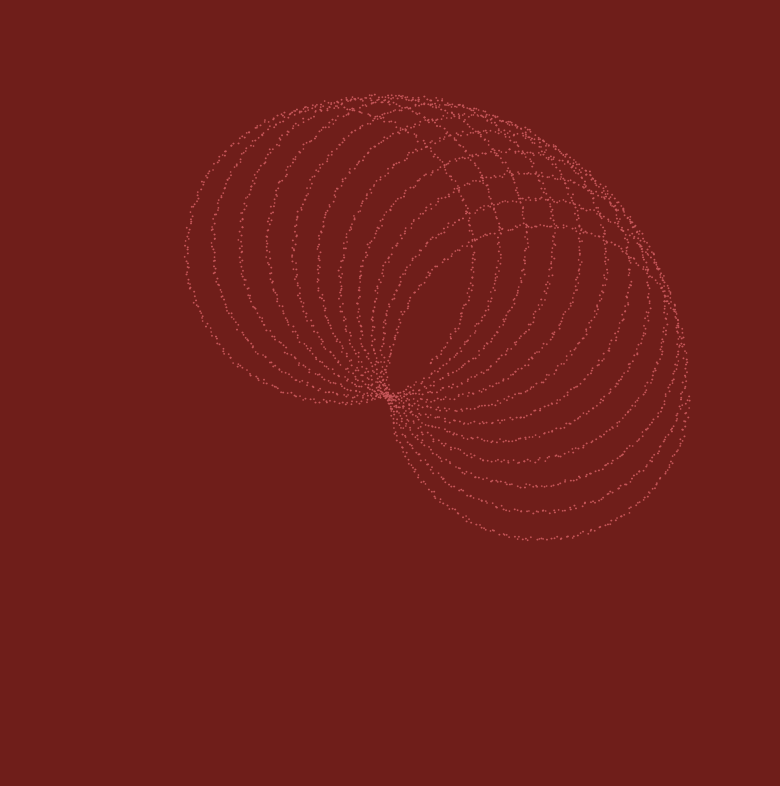
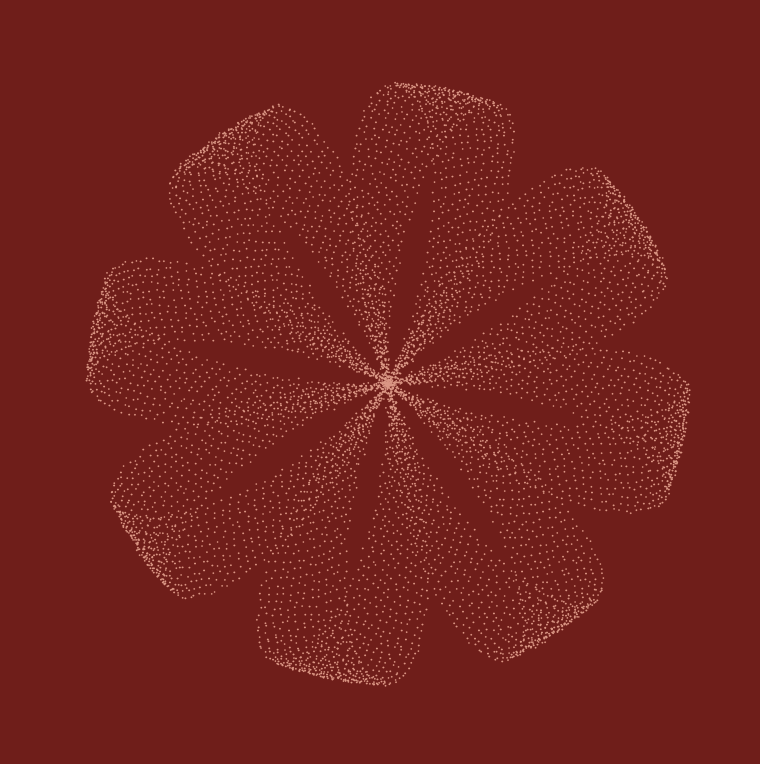
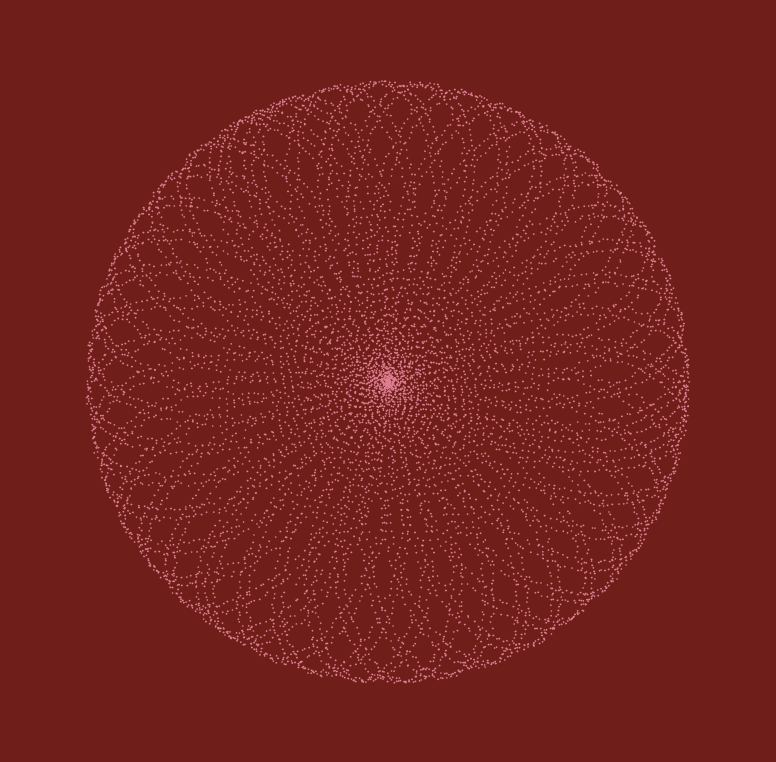
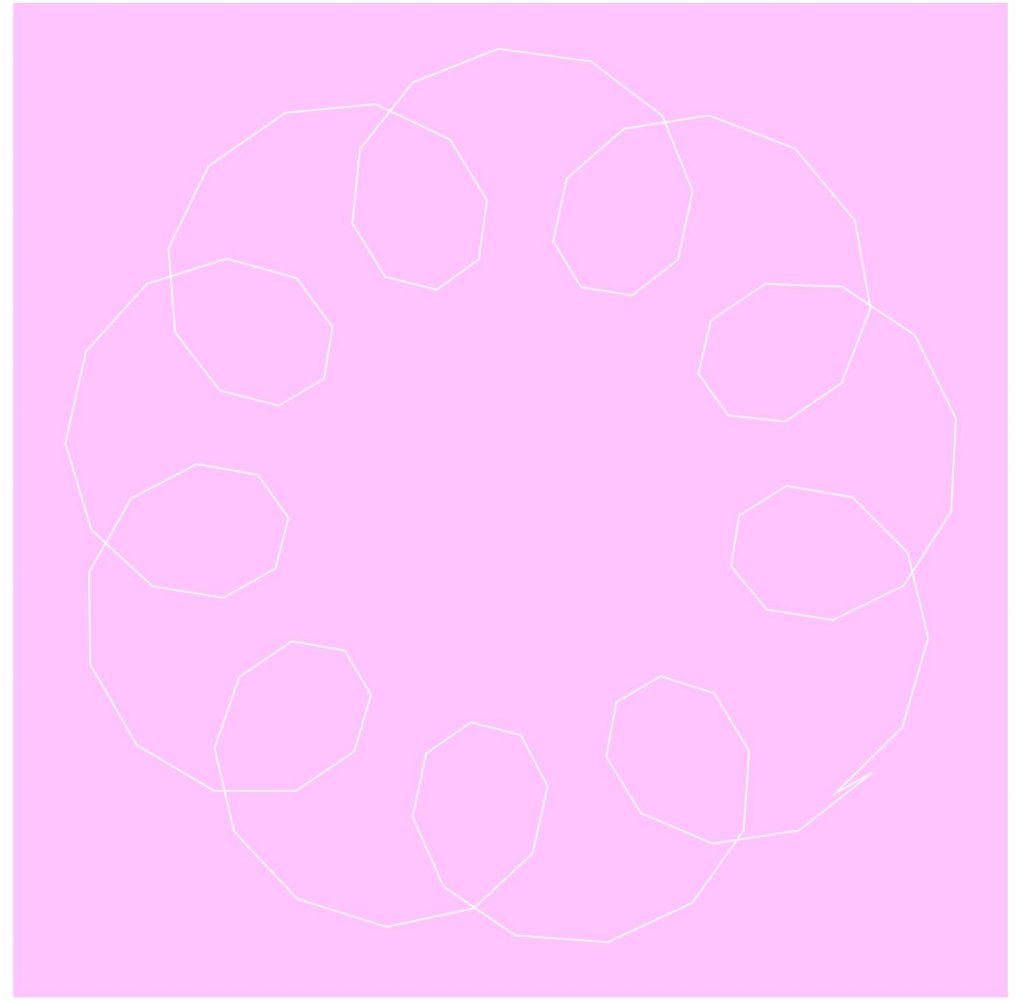
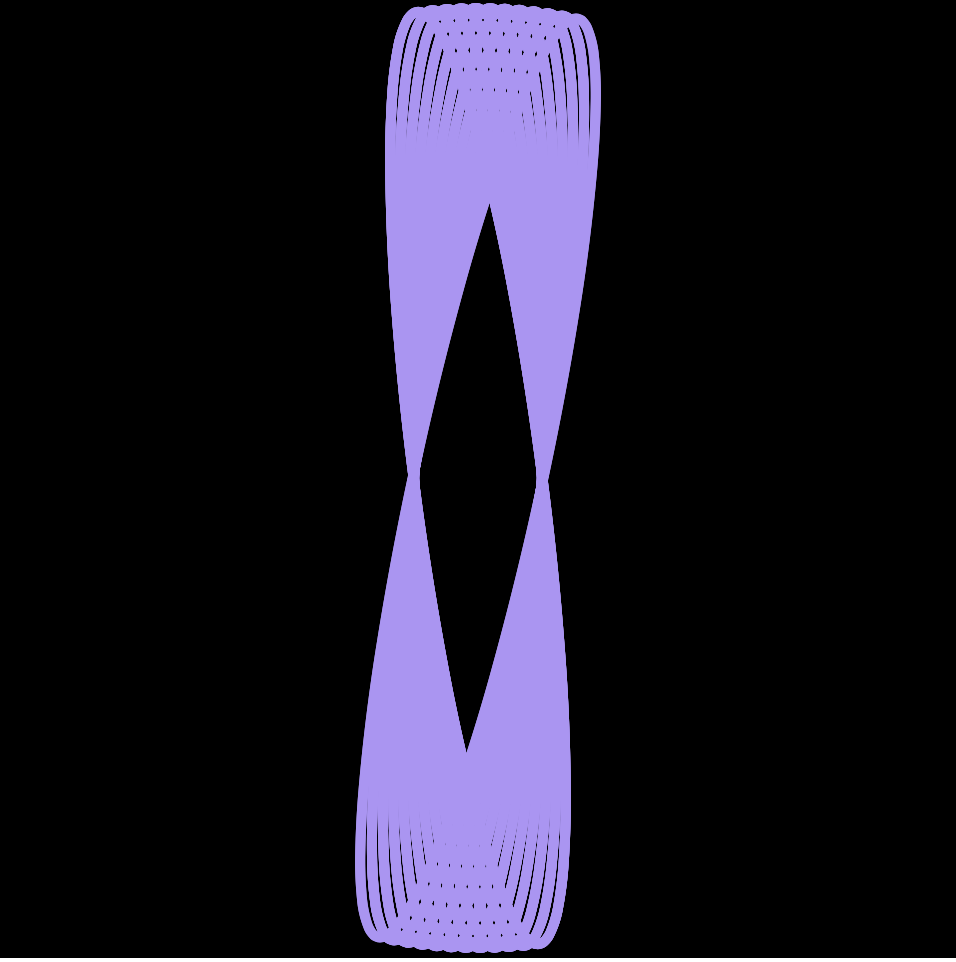
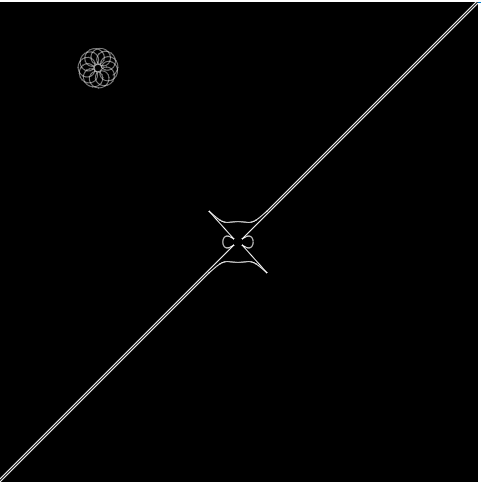
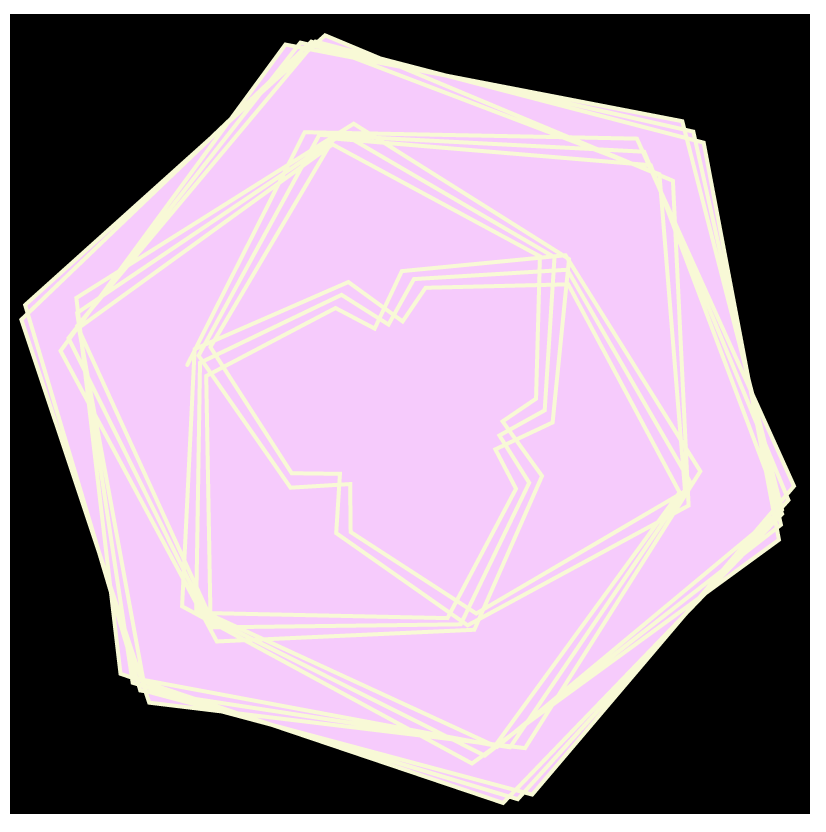
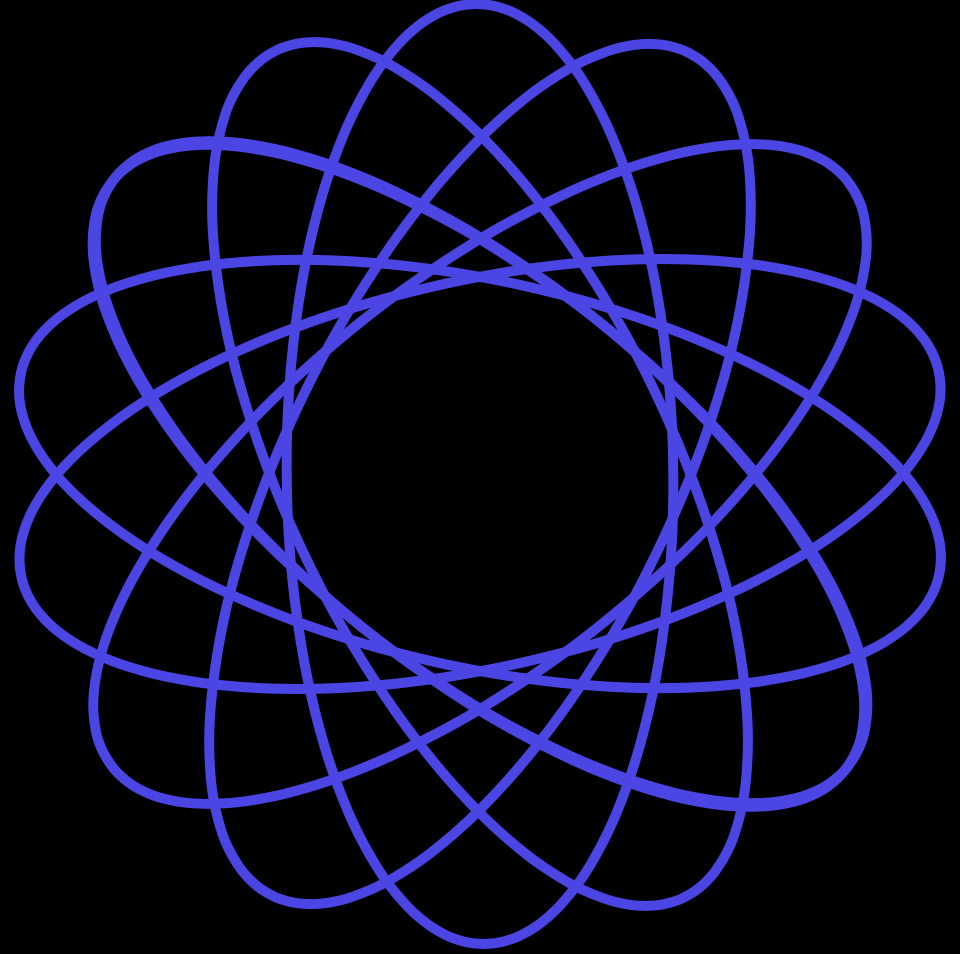
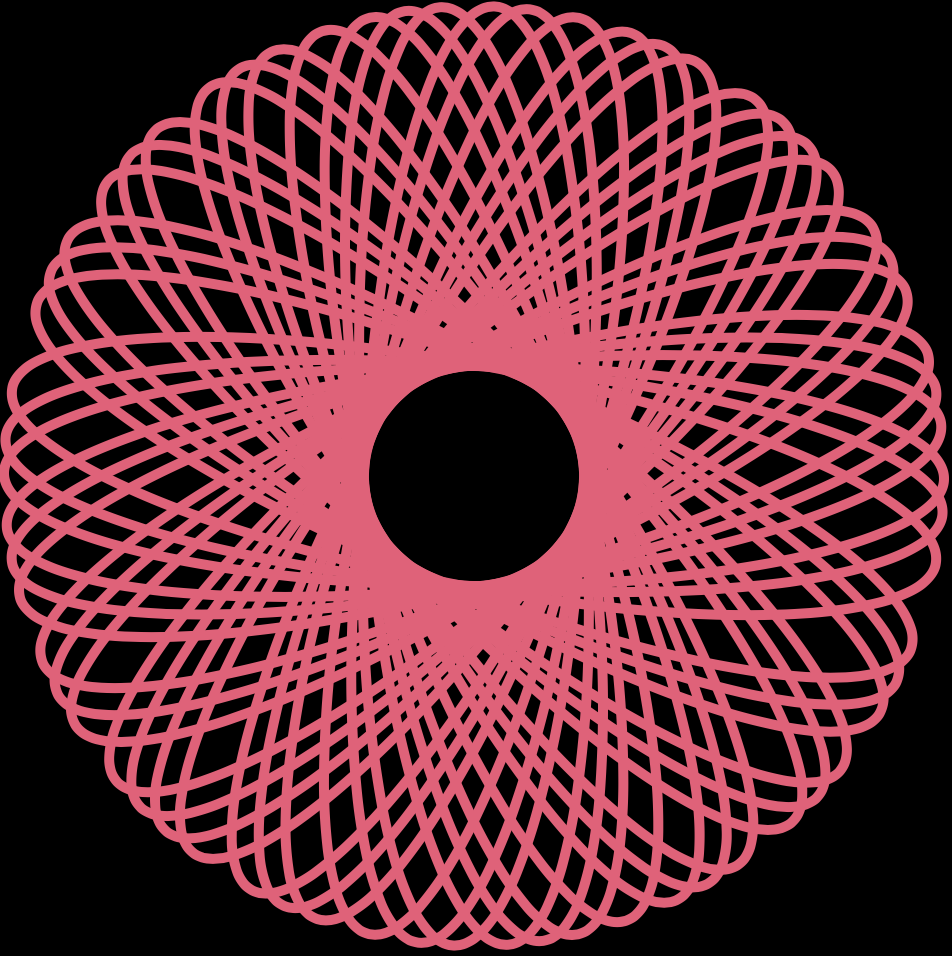
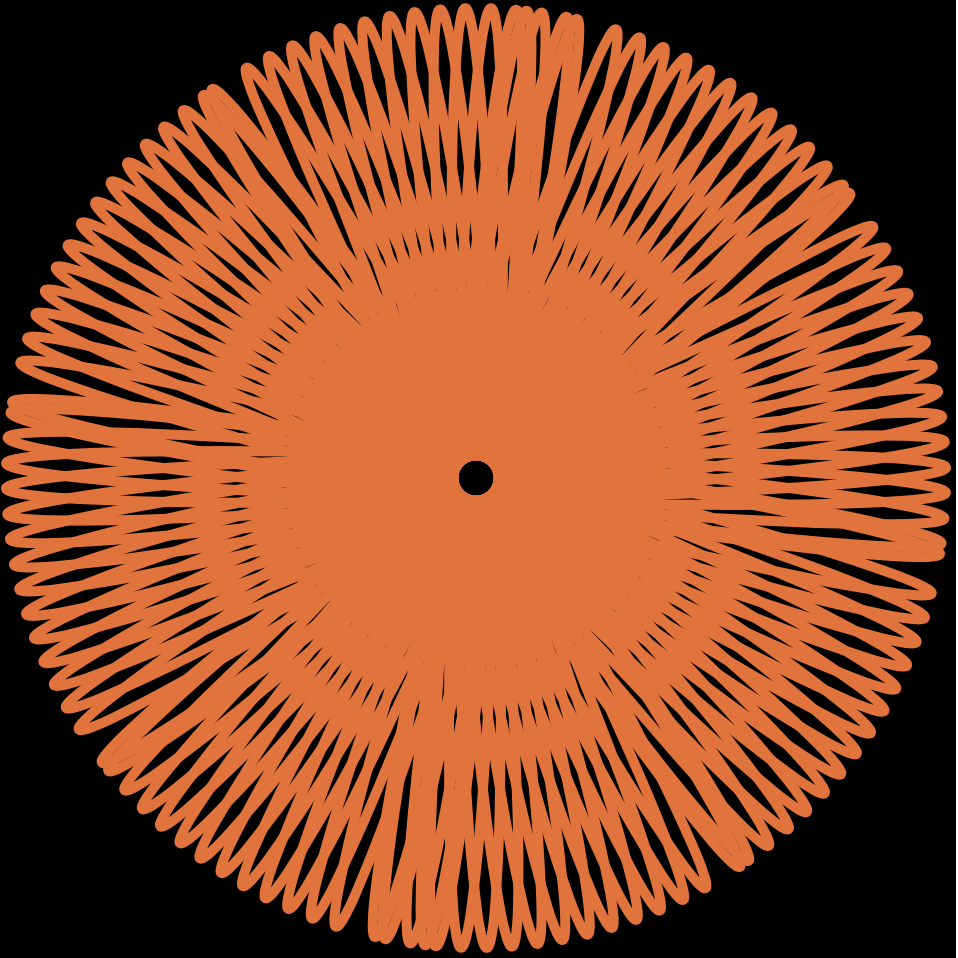
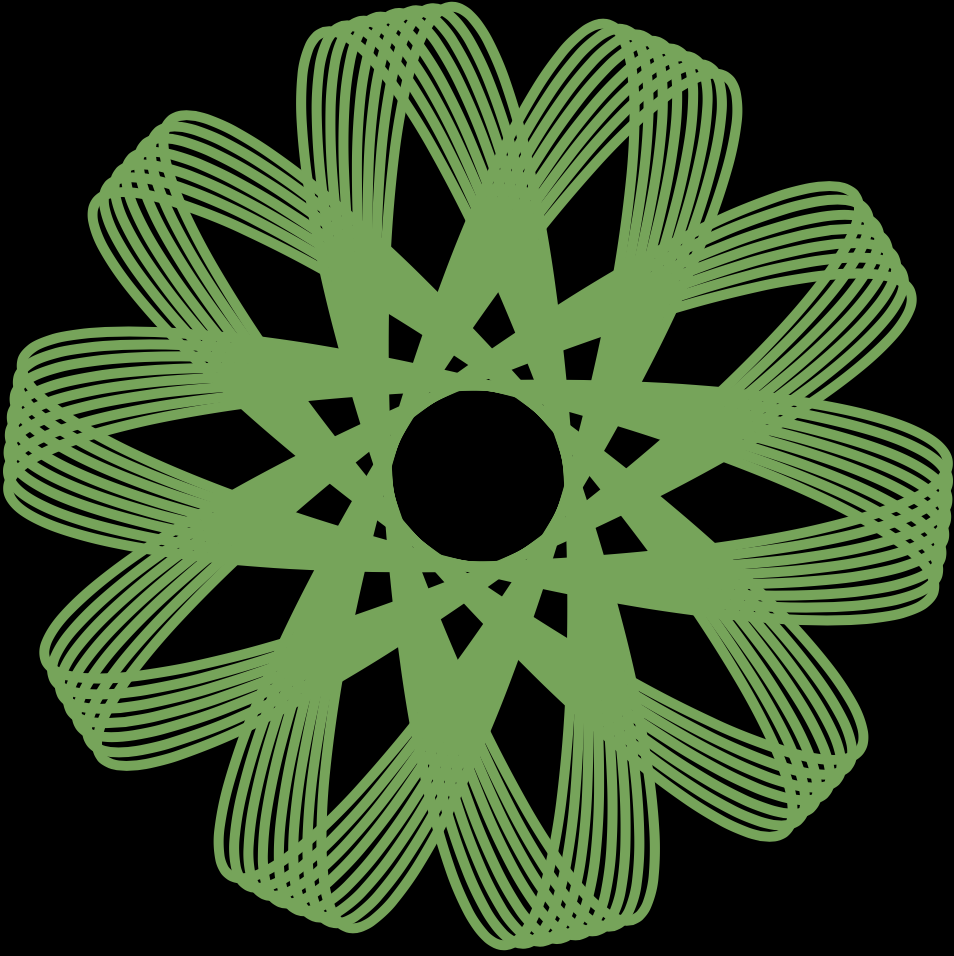
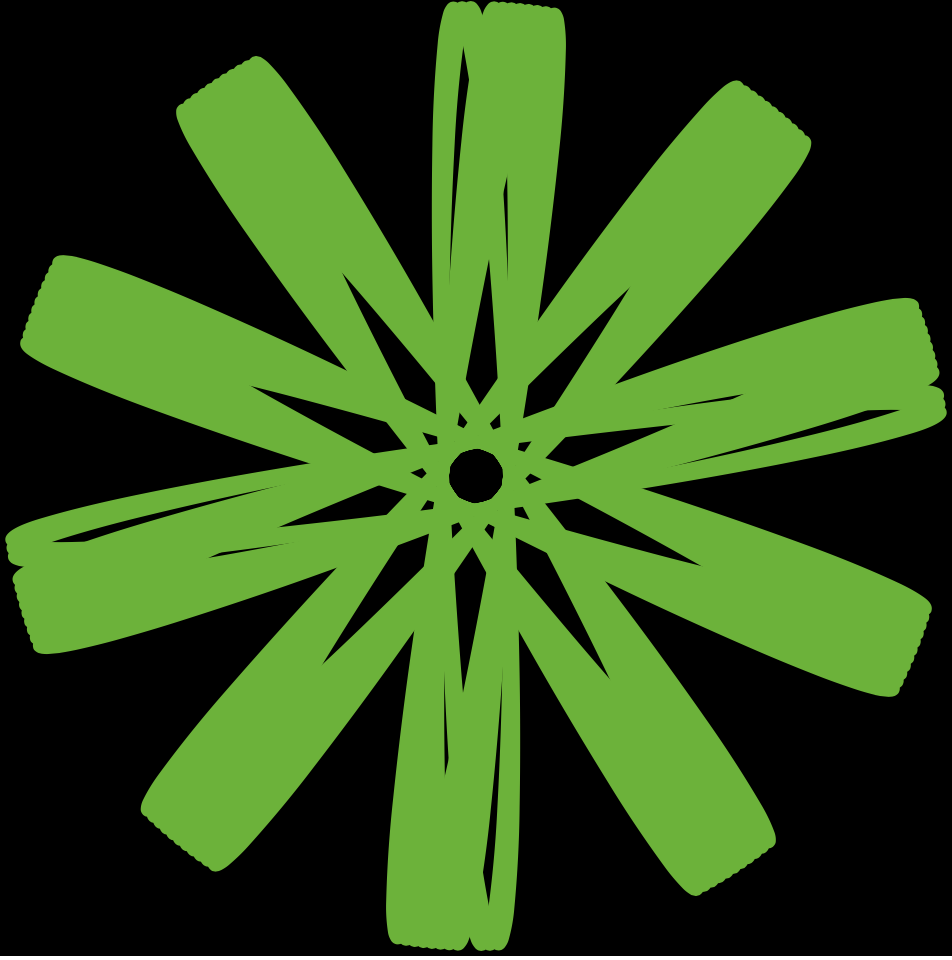
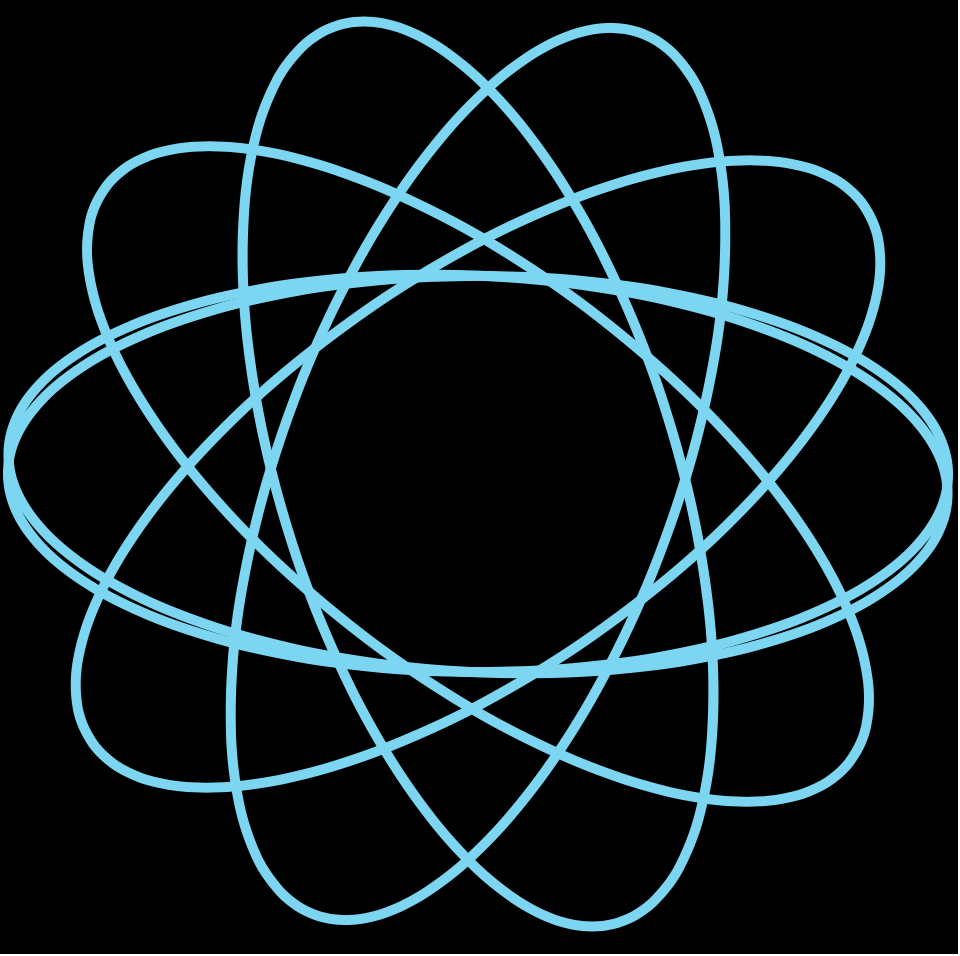
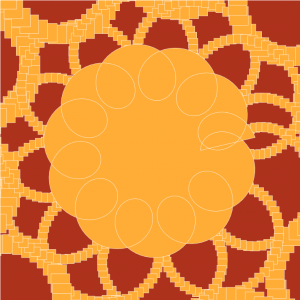
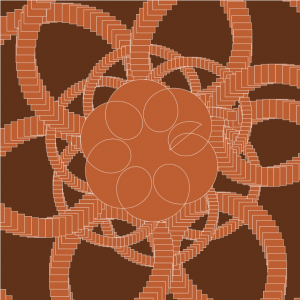
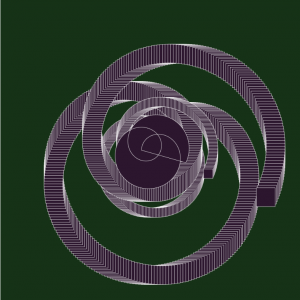
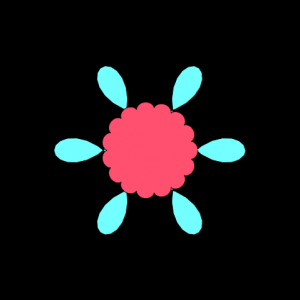
In my project I used a Hypotrochoid and an Asteroid. I decided to use my mouse to play around with the RGB values, which change depending on mouseX and mouseY. The project has a large Hypotrochoid on the outside with the Asteroid on the inside.

I decided to let it draw over itself, as it adds more curves when you move the mouse. I thought it added a cool layering effect where you could see all the colors on top of one another.

Overall, the project was fun to do as I learned a lot about experimenting with the different curves and parametric equations.

The starting Hypotrochoid curve
The curve layered over itself

ilona altman – project 07 – curves

sketch


// Ilona Altman
// Section A
// iea@andrew.cmu.edu
// Project-07

function setup() {
    createCanvas(400, 400);
    frameRate(10);
    noStroke();
}

function draw() {
//pink background
background(121,20,20);

// variables d/n = petal variations
var d = map(mouseX, 0, width, 0, 8);
var n = map(mouseY, 0, height, 0, 8);

// translating the matrix so circle is in the center
push();
translate(width/2, height/2);

//changing the colors
var colorR = map(mouseX, 0, width, 200,255);
var colorG = map(mouseY, 0, width, 50,245);
var colorB = map(mouseX, 0, width, 50,200);

// the loop generating the points along the rose equation
for (var i = 0; i < TWO_PI *3*d; i += 0.01) {
    var r = 150* cos(n * i);
    var x = r * cos(i);
    var y = r * sin(i);

    //making the circles more dynamic, and wobbly
    fill(colorR,colorG,colorB);
    circle(x +random(-1, 1), y + random(-1, 1), 1, 1);
    }

pop();
}


With this project, I was thinking a lot about auras, and energy, and how to make something digital that feels organic. I wanted to experiment with a flickery effect, achieved by alternating the size of the circles which compose this curve. I like the idea of these patterns looking like they are created from vibrations. I have been thinking about sacred geometry a lot, and about the patterns made in water when sound reverberates through it.

Claire Lee – Project 07 – Curves

project07

/* 
Claire Lee
15-104 Section B
seoyounl@andrew.cmu.edu
Project-07
*/

var nPoints = 100;
var angle = 0;
//initial global variables

var bgRed = 135;
// background color variable

function setup() {
    createCanvas(480, 480);
    background(bgRed, 195, 255);
}

function draw() {
    bgRed = 150 + (mouseX * (120 / width));
    background(bgRed, 195, 255);

    push();
    translate((width / 2), (height / 2));
    rotate(radians(mouseY));
    hypotrochoidCurve();
    pop();
    // place curve in center, govern rotation by mouseY

    push();
    translate((width / 2), (height / 2));
    rotate(radians(mouseX));
    epitrochoidCurve();
    pop();
    // place curve in center, govern rotation by mouseX 

    push();
    translate((width / 2), (height / 2));
    rotate(radians(mouseX * 5));
    deltoidRadialCurve();
    pop();
    // place curve in center, govern rotation by mouseX 
    // comparatively faster rotation
}

function hypotrochoidCurve() {
    var a1 = map(mouseX, 0, 480, 80, 200);
    //size changes with repsect to mouseX
    var b1 = 30; 
    var h1 = (mouseX / 10);
    var angle1 = 0;
    // variables for shape 1 (hyopotrochoid)

    strokeWeight(1);
    stroke(255);
    noFill();
    beginShape();
    for (var i = 0; i < nPoints; i++) {
        var angle1 = map(i, 0, nPoints, 0, TWO_PI);
        x1 = (a1 - b1) * cos(angle1) + h1 * (cos(((a1 - b1)/ b1) * angle1));
        y1 = (a1 - b1) * sin(angle1) + h1 * (sin(((a1 - b1)/ b1) * angle1));
        vertex(x1, y1);
    }
    endShape(CLOSE);
    //hypotrochoid curve
}

function epitrochoidCurve() {
    var a2 = map(mouseX, 0, 480, 50, 100);
    //size changes with respect to mouseX
    var b2 = 50;
    var h2 = (mouseY / 20);
    var angle2 = 0;
    // variables for shape 2 (epitrochoid)

    strokeWeight(1);
    stroke(255);
    fill(255, 255, 255, 50);
    beginShape();
    for (var i = 0; i < nPoints; i++) {
        var angle2 = map(i, 0, nPoints, 0, TWO_PI);
        x2 = (a2 + b2) * cos(angle2) - h2 * cos((a2 + b2) * angle2);
        y2 = (a2 + b2) * sin(angle2) - h2 * sin((a2 + b2) * angle2);
        vertex(x2, y2);
    }
    endShape(CLOSE);
    // epitrochoid curve
}

function deltoidRadialCurve() {
    var a3 = map(mouseY, 0, 480, 0, 100);
    //size changes with respect to mouseY
    var angle3 = 0;
    // variables for shape 3 (deltoid radial)

    strokeWeight(1);
    stroke(255);
    fill(255, 255, 255, 50);
    beginShape();
    for (var i = 0; i < nPoints; i++) {
        var angle3 = map(i, 0, nPoints, 0, TWO_PI);
        x3 = (1/3) * a3 * (2 * cos(angle3) + cos(2 * angle3));
        y3 = (1/3) * a3 * (2 * sin(angle3) - sin(2 * angle3));
        vertex(x3, y3);
    }
    endShape(CLOSE);
    // deltoid radial curve   
}

This project was really interesting because I got to see how I could adjust different variables within parametric equations to change with respect to mouse position. I wanted to create something relatively simple that resembles a “blooming” flower as the mouse moves position from (0,0) to (480,480). Admittedly, this took a bit of trial and error, and I ran into a lot of formatting issues in the beginning, but I’m pretty satisfied with how it turned out.

The first hypotrochoid curve — “petals”
Addition of the epitrochoid — “center”

Cathy Dong-07-Curve

sketch

/* Cathy Dong
   Section D
   yinhuid@andrew.cmu.edu
   Project 07 - Composition with Curves
*/

var density = 200;

function setup() {
    createCanvas(480, 480);
}

function draw() {
    background(0);
    stroke(255);
    noFill();

    //call devil's curve
    strokeWeight(1);
    push();
    translate(width/ 2, height / 2);
    devilDraw()
    pop();

    //call curve and make its center move with mouse
    strokeWeight(.5);
    push();
    var xDraw = constrain(mouseX, width / 5, width / 5 * 4);
    var yDraw = constrain(mouseY, width / 8, height / 8 * 7);
    translate(xDraw, yDraw);
    hypocycloidDraw();
    pop();
}

//draw hypocycloid move with mouse
function hypocycloidDraw() {
    var xA;
    var yA;
    var aA = map(mouseX, 0, width, 0, width / 5);
    var bA = map(mouseY, 0, height, 0, height / 8);
    beginShape();
    for (var i = 0; i < density; i++) {
        var t = map(i, 0, density, 0 ,PI * 2);
        xA = (aA - bA) * cos(t) - bA * cos((aA - bA) * t);
        yA = (aA - bA) * sin(t) - bA * sin((aA - bA) * t);
        vertex(xA, yA);
    }
    endShape();
}

// draw devil's curve function
function devilDraw() {
    var xD;
    var yD;
    var aD = map(mouseX, 0, width, 10, width/ 8);
    var bD = map(mouseY, 0, height, 10, height / 10);
    beginShape();
    for (var j = 0; j < density; j++) {
        var t = map(j, 0 , density, 0, PI * 2);
        xD = cos(t) * sqrt((pow(aD, 2) * pow(sin(t), 2) - pow(bD, 2) * pow(cos(t), 2)) / (pow(sin(t), 2) - pow(cos(t), 2)));
        yD = sin(t) * sqrt((pow(aD, 2) * pow(sin(t), 2) - pow(bD, 2) * pow(cos(t), 2)) / (pow(sin(t), 2) - pow(cos(t), 2)));
        vertex(xD, yD);
    }
    endShape();
}

mouse bottom left
mouse upper left

I started the project with browsing Mathworld Curves and found the curves that I am interested in. I used devil’s curve and hypocycloid. Devil’s curve remains at canvas center and its long diagonal edges change side when mouse moves, whereas hypocyloid itself flies with mouseX and mouseY. Hypocyloid is the smallest when it’s at upper left corner and largest at lower left. It is less complex and mouse moves to left of the canvas. The longest devil curve edges and the hypocyloid would only appear to be at the same edge when mouse is at upper right.

Nawon Choi— Project 07 Curves

sketch

// Nawon Choi
// nawonc@andrew.cmu.edu
// Section C
// Project 07 Composition with Curves

// number of points
var np = 100;

function setup() {
    createCanvas(400, 400);
}

function draw() {
    background("black");

    stroke("#f7fad2");
    noFill();
    strokeWeight(2);

    // center the curves
    push();
    translate(200, 200);
    drawHypocycloid(100);

    // color of second curve depends on mouseX
    fill(255, 200, mouseX);
    drawHypocycloid(-200);
    pop();
}


// http://mathworld.wolfram.com/HypocycloidEvolute.html
function drawHypocycloid(xy) {
    var x;
    var y;
    var a = xy;
    var b = mouseY;

    beginShape();
    for (var i = 0; i < np; i++) {
        var t = map(i, 50, np, 50, TWO_PI);

        var one = a / (a - 2 * b);

        x = one * ((a - b) * cos(t) - b * cos(((a - b) / b) * t));
        y = one * ((a - b) * sin(t) + b * sin(((a - b) / b) * t));

        vertex(x, y);
    }
    endShape();
}

For this project, I chose to draw a curve called Hypocycloid Evolute. It was fun playing around by plugging in different variables at different points and seeing how it affects the shape. I eventually decided on having one of the variables, b, be dependent on the y-position of the mouse. I originally drew one curve, but decided to add another one to create depth. I drew another, larger curve and filled in the shape to create different flower-esque shapes as a result. I really enjoyed seeing how the changing colors and varying number of edges and angles created significantly different images with a single curve.

Jina Lee – Project 07

sketch

//Jina Lee
//jinal2@andrew.cmu.edu
//Section E
//Project 07

var numLines = 30;
var angle = 0;
var angleX;
var circleW;
var r;
var g;
var b;

function setup() {
    createCanvas(480, 480);
}

function draw() {
    background(0);
    //r is a random number between 0 - 255
    r = random(255);
    //g is a random number betwen 0 - 255
    g = random(255);
    //b is a random number between 0 - 255
    b = random(255);
    for(var i = 0; i < numLines; i++){
        noFill();
        push();
        //changing the speed of ellipse
        angleX = map(mouseX, 0, 400, 0, 90);
        //changing the amount of lines drawn
        numLines = map(mouseY, 0, 400, 5, 50);
         //changing the ellipse width
        circleW = map(mouseY, 0, 400, 200, 50);
        //color is random
        stroke(r, g, b);
        strokeWeight(5);
        //move it so it is random
        translate(width / 2, height / 2);
        rotate(radians(angle));
        ellipseMode(CENTER);
        ellipse(0, 0, circleW, 470);
        pop();
        angle += angleX;

    }
}

For this project, I was really worried on how to start because the shapes seemed so difficult and complex. As I was working, I realized that it was not as bad as I thought. as long as I defined my variables properly and used a for loop to draw the pattern, it worked. I used the map function to control the to control the speed, number of lines, and width of ellipse.

When the mouse is at the top left corner.
When the mouse is at the center.
When the mouse is at the bottom corner.
When the mouse is at the right side of the canvas.
When the mouse is at the bottom right corner.
When the mouse is at the bottom left corner.
When the mouse is at the top right corner.

Margot Gersing – Project 7 Curves

(click on shapes to activate)

This project I was inspired by some of the shapes shown as examples on the project description. I thought the round shapes were really cute and I could imagine them as a pattern. I made it so that each shape you could manipulate individually by clicking on them. This way there could be more options for what you could create based on the mouse.

>mgersing07

//Margot Gersing - Project 7 - mgersing@andrew.cmu.edu- section E

var oneX = 50; //for mouse press
var oneY = 50;
var act1 = false; //peach shape 'activation'

var twoX = 200; //for mouse press
var twoY = 350;
var act2 = false; //rusty orange shape 'activation'

var threeX = 400; //for mouse press
var threeY = 100;
var act3 = false; //pink shape 'activation'

var fourX = 500; //for mouse press
var fourY = 500;
var act4 = false; //gray shape 'activation'

var nPoints = 100;

function setup() {
    createCanvas(600,600);
    frameRate(10);

}

function draw(){
	background(230, 226, 222);
	noStroke();
	one();
	four();
	two();
	three();

	//filler shapes (static)
	fill(233, 154, 123);
	ellipse(50, 600, 400, 150);
	fill(233, 115, 88);
	ellipse(600, 125, 100, 150);
	fill(95, 44, 39);
	ellipse(150, 150, 25, 25);
	ellipse(175, 175, 20, 20);
	ellipse(135, 180, 25, 25);
	ellipse(185, 135, 25, 25);
	ellipse(155, 115, 20, 20);
	ellipse(500, 500, 20, 20);
	ellipse(490, 535, 25, 25);
	ellipse(600, 275, 25, 25);
	ellipse(575, 250, 25, 25);
	ellipse(560, 285, 20, 20);
	ellipse(60, 480, 25, 25);	

}

function one(){
	//peach shape
	var w1 = 200;
    var h1 = 200;

    //click to activate otherwise static
	if(act1){
		w1 = mouseX * .75;
		h1 = mouseY * .75;
	} else{
		w1 = 200;
		h1 = 200;
	}

	fill(240, 213, 189);
	ellipse(50, 50, w1, h1);
}

function two(){
	//epitrochoid
	var x;
    var y; 
    var a = 80.0;
    var b = a / 2.0;
    var h2 = constrain(100 / 8.0, 0, b);
    var ph2 = 100 / 50.0;

    //click to activate otherwise static
    if(act2){
		h2 = constrain(mouseX / 8.0, 0, b);;
		ph2 = mouseX / 50.0;
	} else{
		h2 = constrain(100 / 8.0, 0, b);
		h1 = 100 / 50.0;
	}
    fill(205, 100, 77);
    beginShape(); //drawing shape
    for (var i = 0; i < nPoints; i++) {
        var t = map(i, 0, nPoints, 0, TWO_PI);
        
        x = (a + b) * cos(t) - h2 * cos(ph2 + t * (a + b) / b);
        y = (a + b) * sin(t) - h2 * sin(ph2 + t * (a + b) / b);
        vertex(x + 200, y + 350);
    }
    endShape(CLOSE);
}

function three(){
	//cranioid
	var x;
    var y;
    var r;
    var a = 40.0;
    var b = 10.0;
    var c = 100.0;
    var p = constrain((width/2), 0.0, 1.0);
    var q = constrain((height/2), 0.0, 1.0);

    //click to activate otherwise static
    if(act3){
    	var p = constrain((mouseX / width), 0.0, 1.0);
        var q = constrain((mouseY / height), 0.0, 1.0);
    } else{
    	var p = constrain((width/2), 0.0, 1.0);
        var q = constrain((height/2), 0.0, 1.0);
    } 
    fill(227, 187, 202);
    beginShape(); //drawing shape 
    for (var i = 0; i < nPoints; i++) {
        var t = map(i, 0, nPoints, 0, TWO_PI);
        r =
            a * sin(t) +
            b * sqrt(1.0 - p * sq(cos(t))) +
            c * sqrt(1.0 - q * sq(cos(t)));
        
        x = r * cos(t);
        y = r * sin(t);
        vertex(x + 400, y + 100);
    }
    endShape(CLOSE);
}

function four(){
	//gray shape
	var w4 = 200;
    var h4 = 300;

    //click to activate otherwise static
	if(act4){
		w4 = mouseX;
		h4 = mouseY;
	} else{
		w4 = 200;
		h4 = 300;
	}

	fill(37, 45, 46);
	ellipse(475, 475, w4, h4);
}


function mousePressed(){

	//if clicked within in defined distance then activation state is... 
	   //changed from true to false so the mouseX and mouseY will now take over
	var d = dist(oneX, oneY, mouseX, mouseY);
	if(d < 200){
		act1 = !act1;
	}

	var d2 = dist(twoX, twoY, mouseX, mouseY);
	if(d2 < 100){
		act2 = !act2;
	}

	var d3 = dist(threeX, threeY, mouseX, mouseY);
	if(d3 < 100){
		act3 = !act3;
	}

	var d4 = dist(fourX, fourY, mouseX, mouseY);
	if(d4 < 100){
		act4 = !act4;
	}

}


YouieCho-Project-07-Composition-with-Curves

sketch

/* Youie Cho
   Section E
   minyounc@andrew.cmu.edu
   Project-07-Composition-with-Curves*/

var nPoints = 500;

function setup() {
    createCanvas(480, 480);
}

function draw() {
    //background color changes based on mouse location
    background(mouseX / 2, 50, mouseY / 2);
    Epitrochoid();
}

function Epitrochoid() {
    stroke(255);
    strokeWeight(0.5);
    //fill color changes based on mouse location
    fill(mouseX, mouseX / 2, mouseY);
    push();
    //begin at the center of the canvas
    translate(width / 2, height / 2);
    //constrain through mouseX and mouseY
    var consx = constrain(mouseX, 0, mouseX, 0, width);
    var consy = constrain(mouseY, 0, mouseY, 0, height);
    //define constants that depend on mouse position
    var a = map(consx, 0, width, 0, width / 3);
    var b = map(consy, 0, width, 0, width / 5);
    var h = map(consy, 0, height, 0, 400);
    //draw primary epitrochoid curve
    beginShape();
    for (var i = 0; i < nPoints; i ++) {
        var t = map(i, 0, nPoints, 0, TWO_PI);
        var x = (a + b) * cos(t) - h * cos((a + b) / b * t);
        var y = (a + b) * sin(t) - h * sin((a + b) / b * t);
        vertex(x, y);
        //draw secondary epitrochoid curve rendered with small rectangles
        rect(x * 1.5, y * 1.5, 15, 15);
        //draw terciary epitrochoid curve rendered with large rectangles
        rect(x * 3, y * 3, 30, 30);
    }
    endShape(CLOSE);
    pop();
}

I chose to use the Epitrochoid curve. I chose this curve because first, I wanted to play around with many constants, and second, I thought that the curly movement is interesting. Because of the way the curve draws in a curly and dynamic way, I though it would be more harmonious to use differently rendered curves derived from the primary curve, instead of adding new Epitrochoid curves that would overlap with the primary curve. It was difficult to understand the different values in the equation, and which valuables controlled the curve in what ways, but after studying it for a while, I could make it so that the details that I wanted were being displayed on the canvas at an appropriate scale. It was very fun to be able to create something very complex and dynamic with the help of a mathematical equation.


Sarah Choi – Project 07 – Composition with Curves

project-07

//Sarah Choi 
//Section D
//sychoi@andrew.cmu.edu
//Project-07

var col;

function setup() {
    createCanvas(400, 400);
}

function draw() {
    background(0);

    //randomize color
    col = color(random(255), random(255), random(255));

    x = constrain(mouseX, 0, width);
    y = constrain(mouseY, 0, height);
    
    // draw the frame
    fill(255); 
    noStroke();
    text("The Butterfly", 20, 40);
    stroke(255);
    noFill(); 
    rect(0, 0, width-1, height-1); 
    
    // draw the curve, rotate on mouseX
    push();
    translate(width / 2, height / 2);
    rotate(map(mouseX, 0, width, 0, 1));
    drawButterfly();
    pop();
}

//--------------------------------------------------
function drawButterfly() {
    // Butterfly Curve:
    // http://mathworld.wolfram.com/ButterflyCurve.html
 
    //adding variability and movement
    var m = (map(x, 0, mouseY, 0, width)); 
    var m = (map(y, 0, mouseX, 0, height));

    stroke(255);
    fill(col);

    beginShape();
    for (var i = 0; i < 300; i++) {
        var t = map(i, 0, 300, 0, 2 * TWO_PI);
        
    //butterfly curve equations
        r = (exp(cos(t))) - (2 * cos(4 * t)) + (sin((1 / 12) * t));

        x = r * sin(t) * m
        y = r * cos(t) * m
        vertex(x, y)
    }
    endShape(CLOSE);
}

I chose a curve that could turn on an angle. Thinking of fully randomizing and creating something abstract on the basis of mathematics was my main goal for this project. Because we have been focusing and reflecting on computational art, I wanted to be able to portray this with my own work. It was interesting to play around with the variables as they made a big difference in how the curve was portrayed.

Below, I have shown three different aspects of the curve showing the beginning and how it manifests as it follows the x and y coordinates of the mouse. I wanted to show portray nature by showing the beginning of a butterfly as pure blackness. As one moves the mouse, the shapes get bigger with colors constantly changing showing the beauty butterflies bring into our world. As the mouse moves more across the screen, the butterfly gets bigger to depict what the human eye takes in as a butterfly flies closer to him or her.

Min Ji Kim Kim – Project 07 – Curves


sketch

I think this was the hardest project to do so far. I didn’t really understand the assignment so I just started by looking at the curves on MathWorld and I was really interested in the Hypotrochoid and the Hypocycloid Pedal Curves. I decided to use those for this project and layer them to create a flower like effect. I think the hardest part of this project was trying to figure out the formulas and how to manipulate the variables but once I got it, it was fun to play around with the shapes and colors. I used mouseX and mouseY to manipulate the variables and the colors to create pretty flowers.

top left

bottom right

top right

/*
Min Ji Kim Kim
Section A
mkimkim@andrew.cmu.edu
Project-07
*/

function setup() {
    createCanvas(480, 480);
}

function draw () {
    background(0);
    drawHypotrochoid(); //draw the Hypotrochoid
    drawHypocycloidPC(); //draw the Hypocycloid Pedal Curve
}

function drawHypotrochoid() { //http://mathworld.wolfram.com/Hypotrochoid.html
    var a = int(map(mouseX, 0, width, 100, 200)); //radius of Hypotrochoid
    var b = int(map(mouseY, 0, height, 50, 80)); //radius of circle b
    var h = int(map(mouseX, 0, width, 40, 50)); //distance between center and point P of circle with radius b    
    //draw Hypotrochoid
    push();
    translate(width / 2, height / 2); //move center to middle of canvas
    fill(150, mouseX, mouseY); //color changes depending on mouseX and mouseY
    beginShape(); 
    for(var i = 0; i < 100; i++) { 
        var tH = map(i, 0, 100, 0, TWO_PI); //map theta angle
        var x = (a - b) * cos(tH) + h * cos((a - b) * tH); //parametric equations
        var y = (a - b) * sin(tH) - h * sin((a - b) * tH);
        vertex(x, y);
    }
    endShape();
    pop();
}

function drawHypocycloidPC() { // http://mathworld.wolfram.com/HypocycloidPedalCurve.html
    var a = int(map(mouseY, 0, height, 30, 80)); //map the radius with mouseX movement
    var n = int(map(mouseX, 0, width, 5, 20)); //map the number of cusps with mouseX movement
    //draw Hypocycloid Pedal Curve
    push();
    translate(width / 2, height / 2); //move center to middle of canvas
    fill(mouseY, 100 , 120); //color changes depending on mouseY
    beginShape();
    for(var i = 0; i < 500; i++) {
        var t = map(i, 0, 500, 0, TWO_PI); //map theta angle
        var x = a * ((n - 1) * cos(t) + cos((n - 1) * t)) / n; //pedal curve equations
        var y = a * ((n - 1) * sin(t) + sin((n - 1) * t)) / n;
        vertex(x, y);
    }
    endShape();
    pop();
}