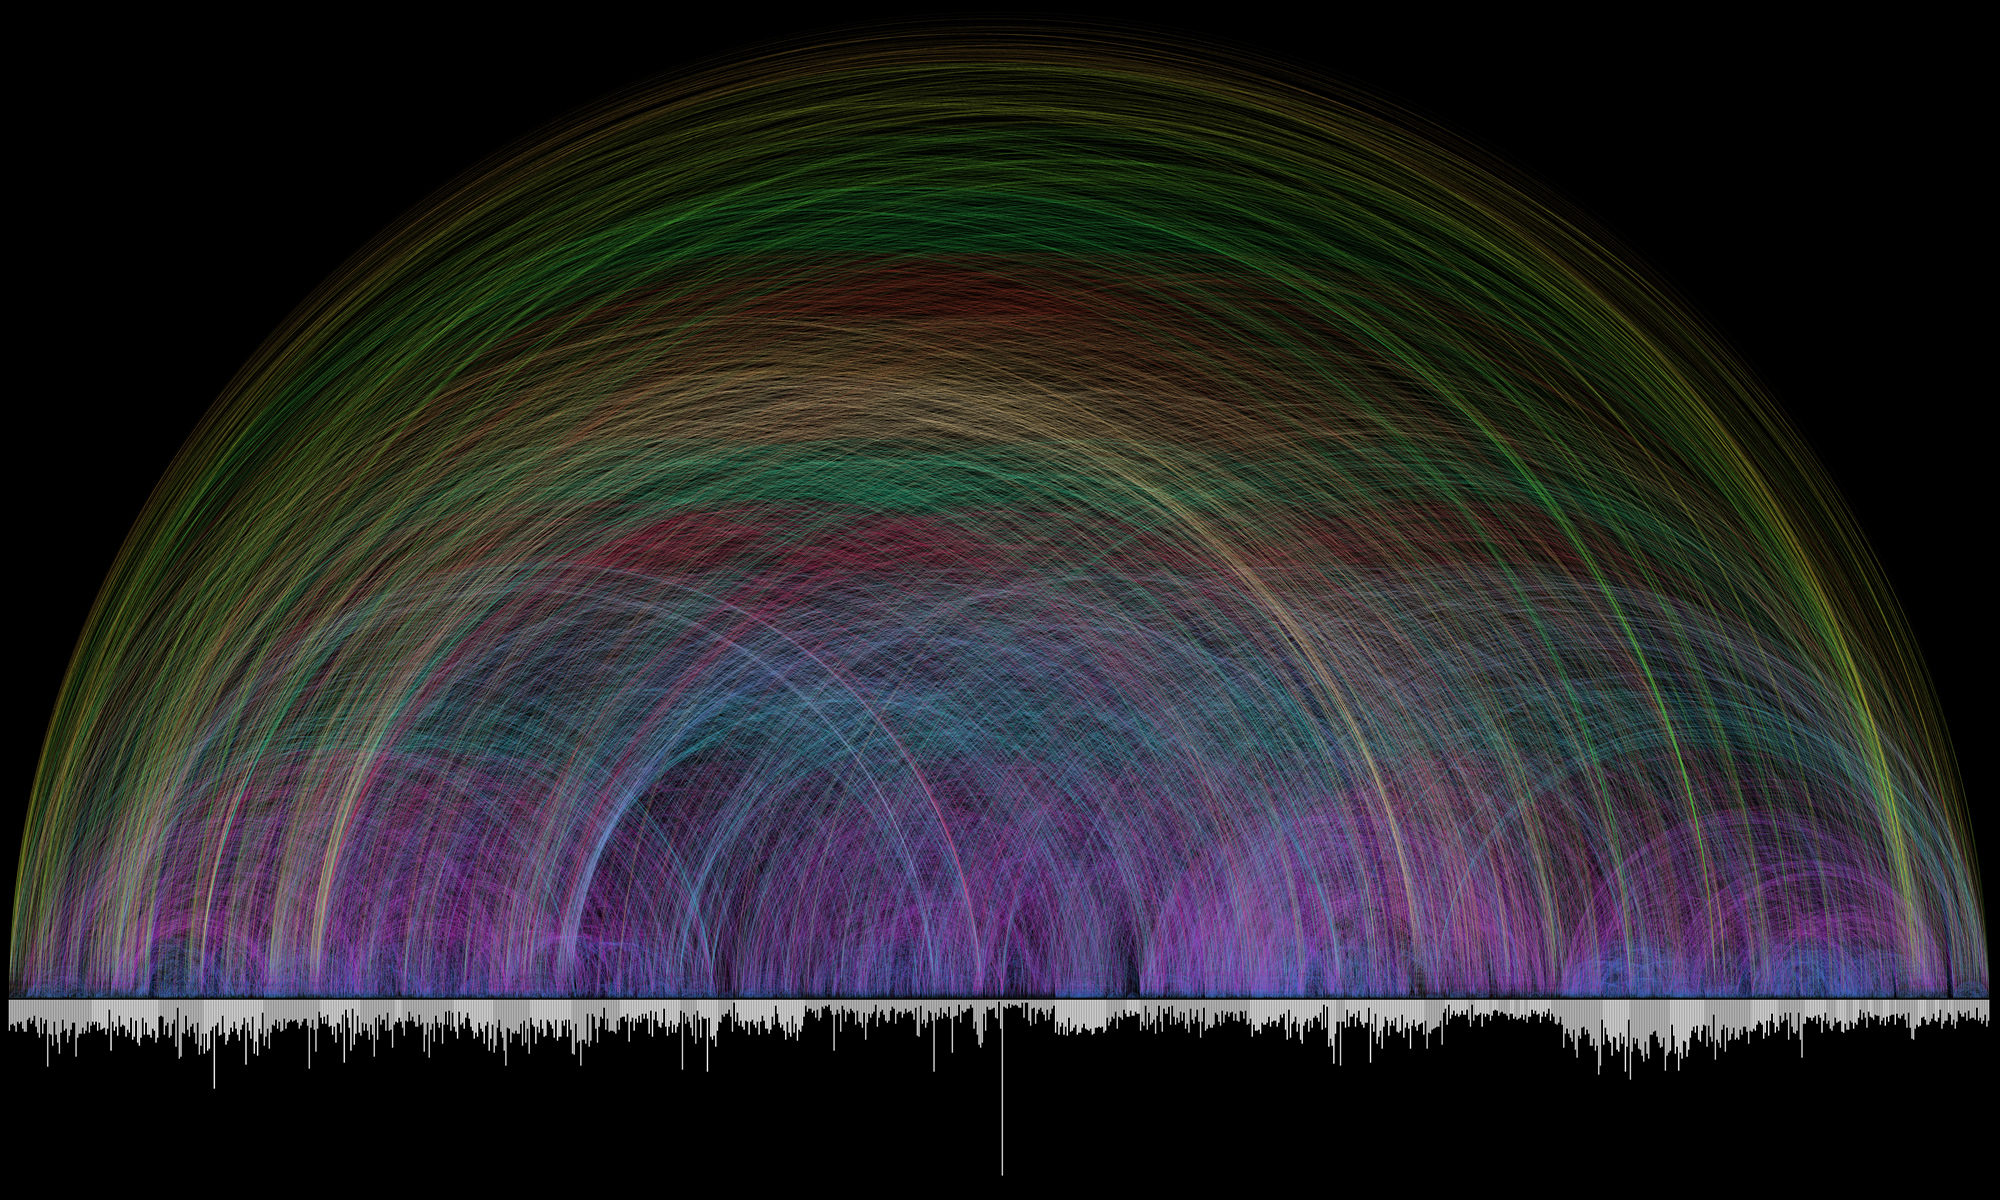
Chris Harrison’s Bible Cross-References data visualization
Bible Cross-References is a collaboration piece between Chris Harrison and Pastor Christoph Römhild. Pastor Römhild had begun putting together data on cross-references within the Bible and wanted to visualize them with the help of Harrison. Together, they were able to take over 63,000 cross references to create this beautiful rainbow. The bottom bars are the different books of the Bible (alternating color between white and gray) and the bar length is how many verses each chapter has. The arc color denotes the distance between the cross-referenced chapters.
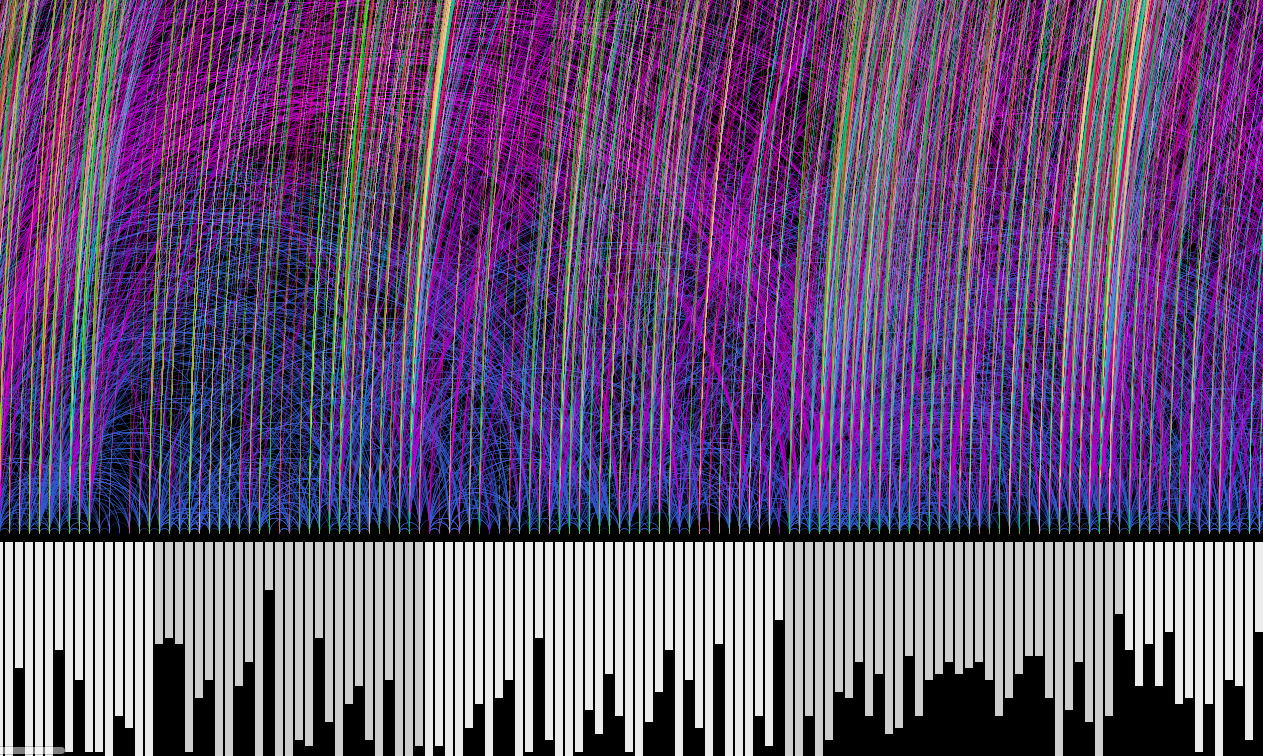
Closeup of a portion of the Bible Cross-References data visualization piece.
I am a Christian, and while reading my study Bible there have been multiple times I have thought, “There are so many cross-references to other books, I wonder if we could analyze them… that would be amazing”. When I found this piece, I was fascinated. Looking at these cross-references visually though Harrison’s work has really shed a light on how extensively connected the Bible is and I am in awe. I really appreciate how Harrison and Römhild were able to create such a beautiful piece using data from the Bible.
You can see his other data visualization projects here.
var x = [0];
var y = [0];
var Xoffset = 0;
var Yoffset = 0;
var col = 255;
var resetclr = 0;
var sc = [0];
var gRate = 0; //gradient speed
var activity = 0;


function setup() {
  createCanvas(480, 480);
  background(0);
  frameRate(30);
  var H = hour();
  var M = minute();
  var S = second();
}

function neuron() {
  col = random(0, 255);

stroke(col, 80)
  beginShape()
  for (i = 0; i < x.length; i++){
    vertex(x[i], y[i]);
  }
  endShape()
  Xoffset = random(-10, 20);
  Yoffset = random(-10, 20);
  x.push(x[x.length-1]+Xoffset);
  y.push(y[y.length-1]+Yoffset);
  if (i % 60 == 0) {
    x[i] = 0;
    y[i] = 0;
    background(0)
    endShape()
    beginShape()
  }
  if (second() % 5 == 0) {
    fill(0, 0, 0, resetclr);
    noStroke();
    rect(-50,-50, width + 50, height + 50);
    x = [0];
    y = [0];
    resetclr ++;
  }

}
//function to determine the breathing rate
function activeness(){
  //fast breathing during the active hours of the day
  if (hour() > 6 & hour() < 23) {
  activity = 2;
}
  //slow breathing due to sleep
  if (hour() < 6 || hour() > 23) {
    activity = 0.3
  }
  //medium speed breathing when waking up and going to bed
  if (hour() == 6 & hour() == 23) {
  activity = 1;
}
}

//changing the gradient to represent breathing
function breathing(){
  var c = map(sin(radians(gRate)), -1, 1, 0, 255);
  for (j = 0; j < 255; j++) {
      stroke(abs(j - abs(sin(radians(gRate))) * 255));

      circle(width / 2, height / 2, j);
      print(c);
    }
}

function draw(){
noFill();
//the
for (rota = 0; rota < 4; rota ++) {
  push()
  translate(width / 2, height / 2);
  rotate(PI / 2 * (rota + 1))
  neuron()
  pop()
}

if (second() % 6 == 0) {resetclr = 0;}
activeness();
breathing();


gRate = gRate + activity;
}
I made a biological clock trying to describe two phenomenons that happen within our bodies constantly: breathing and information exchange between neurons. The gradient circle in the middle represents breathing and the electricity-looking lines represent the signals being transferred between the neurons.
The breathing speed changes depending on the hour of the day. I took into account how a person’s activeness affects their breathing. When the person is asleep, 12am – 5am, breathing is the slowest, medium speed at 6am and 11am, when people state of activeness is transitioning, and fastest from 7am to 10pm, which are the active hours for me.
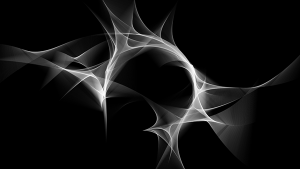
I really enjoy the simplicity of the contrast in the color and how the overlaying of gradience creates a sense of 3D space. Also, the art is at the subliminal boundary of solid and gas. The tool that was used is Action Script, which is something I never have heard of before. I am willing to look into it see how I might be able to manipulate it.
It looks like motion blur of an object’s movement. However, I am curious, if this was drawn over time, which part is the starting point and the ending point. The artist only shows the shot of the final image, so it’s hard for me to imagine the process.
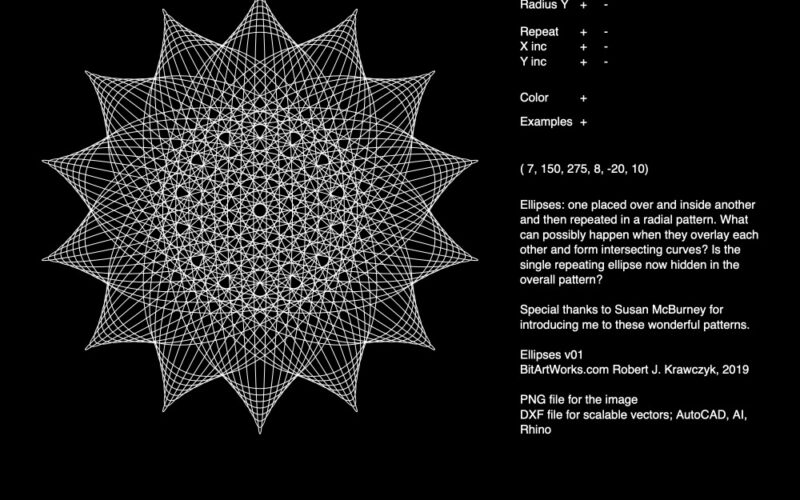
screen shot of a possible iterationgeometric shape iterations
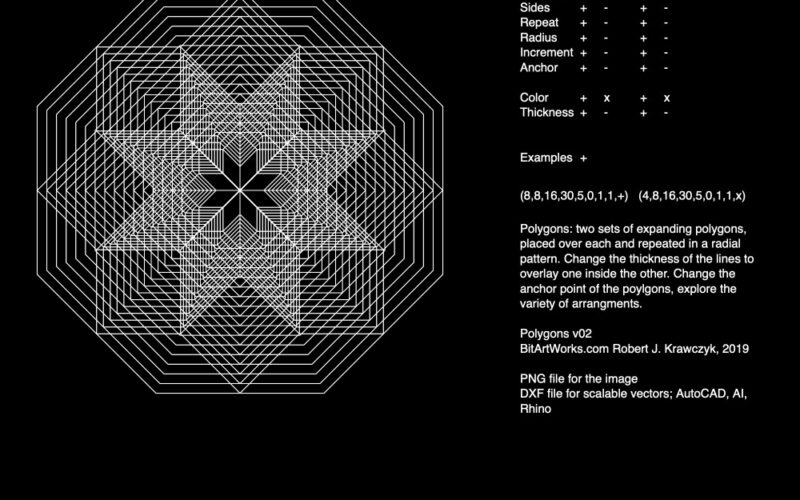
I thought this piece was very interesting in its simplicity. This work is by Robert Krawczyk and is part of a series called “Summer Diversions”. This work is manifested as a website that creates a series of repeating shapes that create different mandalas. The interactivity and randomness of the project is where one can input more or less shapes, altering their repetition, shape and rotation.
I thought it was really lovely because the article even mentioned these were made with p5.js! It also reminds me very much of our line art project. I would guess this project was programed much the same way: variables are set and correlated to the number of mouse clicks on the “=” and “-“. These variables alter the looping of a repeated form, which is also translated in order to create the mandala effect.
I admire how something so simple could be so beautiful. I love that uncertainty exists within any structure.
“My overall interest is to investigate methods which can develop forms that are in one sense predictable, but have the element to generate the unexpected; the unexpected in a predictable way. The custom software becomes the instructions for producing the work itself.” Robert Krawczyk
These values of predictability and unpredictability are very well communicated in the work. Making the mechanisms of the mandalas so transparent and allowing for interaction gives a sense of structure and predictability, whereas the results are often much more beautiful and complex than one might have imagined.
At first I didn’t really know how to approach this project, so I started looking at what kind of shapes I wanted to use for my clock. I ultimately found inspiration from a picture of hanging frames online. I started by sketching the shapes using magic numbers and then I tried to figure out how to use the hour, minute, and second functions to manipulate the time. I used the map function to manipulate the time increments to fit the box height. I decided to use primary colors for the boxes and secondary colors for the small rectangles connecting the boxes. Time is indicated by the increasing darker hues in the lighter hue background. Overall, I had a lot of fun creating this abstract clock.
inspiration from dreamstime
/*
Min Ji Kim Kim
Section A
mkimkim@andrew.cmu.edu
Project-06
*/

function setup() {
    createCanvas(350, 480);
}

function draw() {
    var h = hour();
    var m = minute();
    var s = second();

    background(0); //map time to fit the boxes
    mS = map(s, 0, 59, 0, 110);
    mM = map(m, 0, 59, 0, 110);
    mH = map(h, 0, 23, 0, 110);

    //purple rectangle
    noStroke();
    fill('#804FB3');
    rect(150, 140, 20, 40);

    //yellow rectangle
    fill('#edd011');
    rect(190, 300, 20, 40);

    //blue hour
    strokeWeight(10);
    stroke('#e3edff');
    fill('#0058ff');
    rect(60, 20, 120, 120);

    //red minute
    stroke('#ffdbdb');
    fill('#ff3333');
    rect(140, 180, 120, 120);

    //green second
    stroke('#d7ffcf');
    fill('#2bcf2b');
    rect(105, 340, 120, 120);

    //changing the box color inside to match time
    noStroke();
    fill('#82adff');
    rect(65, 25, 110, 110 - mH); //hour
    fill('#ff9696'); //minute
    rect(145, 185, 110, 110 - mM);
    fill('#a2fc90'); //second
    rect(110, 345, 110, 110 - mS);

    //display time on top
    noStroke();
    fill(255);
    text(nf(h, 2, 0) + ":" + nf(m, 2, 0) + ":" + nf(s, 2, 0), 270, 30);
    textSize(18);
}
var circlecenter = 0;

function setup() {
    createCanvas(480, 480);
}


function draw() {

    // variables for time, hour, minute, second
    var h = hour();
    var m = minute();
    var s = second();

    // variables for color mapping
    var colorR = map(h, 0, 23, 0, 255);
    var colorG = map(m, 0, 59, 0, 255);
    var colorB = map(s, 0, 59, 0, 255);
    // variables for lighter color mapping
    var lightcolorR = map(h, 0,23, 180, 255);
    var lightcolorG = map (m, 0, 59, 180, 255);
    var lightcolorB = map (s, 0, 59, 180, 255);

    // time keeping seconds
    var exactSecond = (h*60)+(m*60)+s;


    // background to change color as day progresses
    background(colorR, colorG, colorB);

    // interlapping pattern of circles that change color with the time
    for (var y = 0; y < height+50; y += width/2) {
        for (var x = 0; x < width+50; x += width/3) {
            fill(255-colorG,255-colorB, 255-colorR,30);
            ellipse(x, y, width/2, width/2);
            noStroke();
        }
    }

    // tiny little dots
    for (var y = 0; y < height+10; y += 2) {
        for (var x = 0; x < width+50; x += 2) {
            fill(lightcolorR,lightcolorG,lightcolorB);
            ellipse(x, y, 1, 1);
            noStroke();
        }
    }

    // mapping for exact second along the x axis
    var secondMapX = (exactSecond, 0, 86400, 0, width);
    // mapping for exact second  along the y axis
    var secondMapY = (exactSecond, 0, 86400, 0, height);

    // circle for current second
    ellipse(secondMapX,secondMapY,2,2);
    fill(255, 255, 255);

}
I wanted to create a clock that emphasized how time is a fluid progression of movement, difficult to conceptualize at times. I decided to do this through a slow gradient of color, that shifts with the time. I wanted to create something that would emphasis both the fluidity of time, as well as how it can be broken into the tiniest of chucks. I did this through overlaying the smallest of dots on top of the work.
Ideally, I would like to make a clock that was rooted to the moon cycles of Lithuania, where my family is from. I think it would be interesting to show how our ancestry, what we adopt from those before us roots us especially in the way it affects our unconscious and when we sleep. I had some trouble figuring out how to embed API data into processing, but I would love to learn this sometime.
/*
Hyejo Seo
SectionA
hyejos@andrew.cmu.edu
Project-06-Abstract Clock
*/
var balloonW;

function setup() {
  createCanvas(400, 400);
}

function draw() {
    var secs = second();
    var mins = minute();
    var hr = hour();
    var balloonY = 250;
// mapping
    var secsM = map(secs, 0, 59, 0, 150);
    var minsM = map(mins, 0, 59, 0, 220);
    var hrM = map(hr, 0, 23, 10, 100);
    background(234, 239, 211);

// balloon pump
    fill(0);
    rect(345, 170, 10, 70);
    quad(330, 240, 370, 240, 360, 300, 340, 300);
    quad(343, 300, 358, 300, 354, 350, 347, 350);
    fill(47, 41, 99);
    noStroke();
    rect(320, 20 + secs, 60, 150);

// pipe
    fill(147, 181, 198);
    rect(347, 350, 7, 30);
    rect(100, 373, 250, 7);
    rect(93, 350, 7, 30);
    ellipse(335 - minsM, 376, 40, 20); // circle representing the air movement

//Balloon
    balloonW = 90;
    fill('#CEEC97');
    stroke(0);
    strokeWeight(2);
    rect(92, balloonY + 70, 10, 28);
    ellipse(97, balloonY + 98, 10, 5);
    ellipse(95, balloonY, balloonW + hrM/2, 150); // increases size by the hour
    // showing the hour on the balloon
    fill(0);
    noStroke();
    textSize(50);
    textFont('Avenir');
    text(int(hr), 68, balloonY + 15);
}
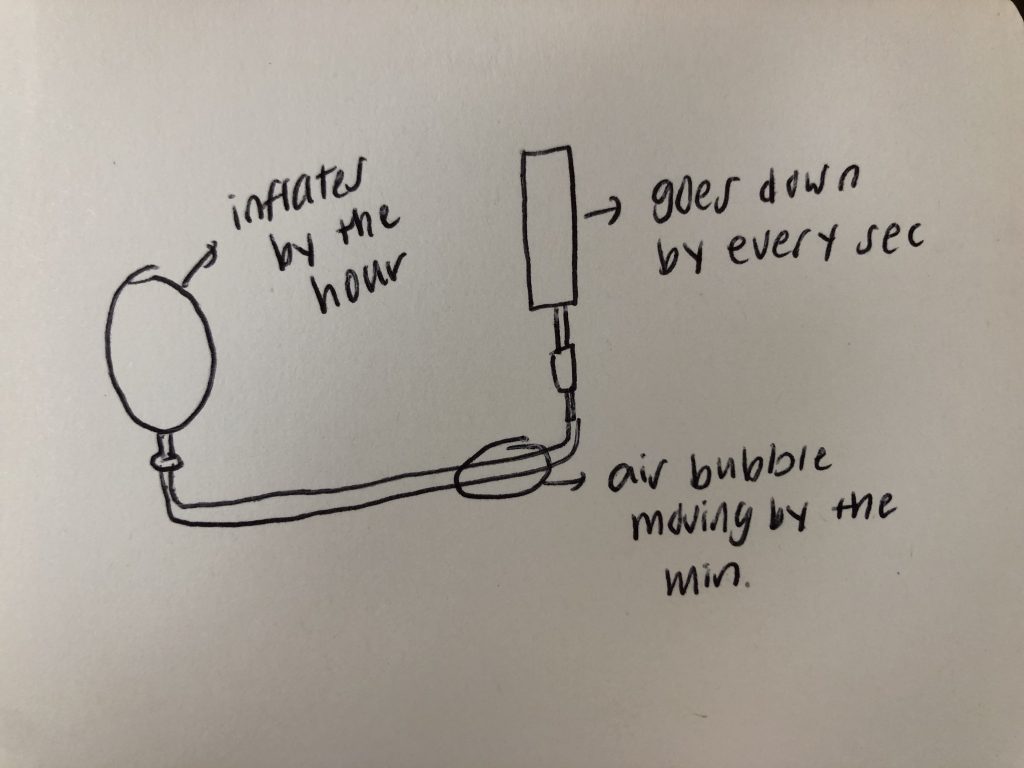
sketching my idea for this project
It took me awhile to think of something fun to represent time. I focused on the increasing factor of time, which led me to think of a balloon inflating. I decided to control the movement of the balloon pumper with seconds, and the air bubble moving through the wire with minutes. Then, the balloon inflates every hour.
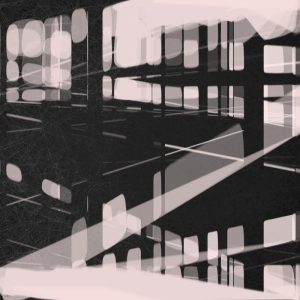
Blue White Black 0.48by Tyler Hobbs is one of his many algorithmic computational pieces that displays the properties of randomness. Hobbs is a generative artist that particularly focuses on the interaction between randomness and order. This particular piece models how brush strokes would appear on a physical canvas. At first glance, the painting exudes a loose and free vibe. However, upon closer inspection, you can actually notice the fine structure and detail involved in the rendering of each brush stroke. By using computational algorithms, Hobbs created an art piece that seems random at first, but is actually made with extreme mathematical precision.
A close-up of a portion of Blue White Black 0.48
I was attracted to this art piece because of how realistic the brush strokes and paint drips were rendered. These brush strokes looked really random to me at first but after looking closely, the details and preciseness involved amazed me. I really loved how Hobbs was able to blend the dichotomy of loose painting and precise algorithmic computation into this piece.
Randomness has brought artists with a more natural composition of artworks. However, randomness in artistic expressions is still under intentional control to maintain a better big picture.
The artist, Tyler Hobbs, who takes advantage of random numbers, combines his intention of relating randomness to graphical proximity, transparency, brightness of the specific elements to create amazing compositions. The Continuity No. 8 impresses me the most with its “random” intention to create the architectural space. By generating semi-random quadrilateral shapes, the artist carefully controls the sizes of the elements and allows the intersections of the shapes to become negative spaces. By randomly choosing focal points, the artist succeeds in creating a collage painting with multiple perspectives and transparencies. The overlapping areas are randomly distributed in adjustment with the transparency and brightness to give a visual depth and hierarchy. Meanwhile, contents from different layers are thus connected to give a pseudo-realistic effect.
Such an interesting painting of randomness me inspires me that by combining the random numbers and sizes with specific parameters such as transparency and brightness, we are able to depict an architecture or even a scenary. I have never thought of random images or polygons can “have” such intentions to collaborate under these manipulations. What’s more, such a process will never produce two same compositions, meaning that the infinite graphical collages and abstract paintings can be created even under one same template.
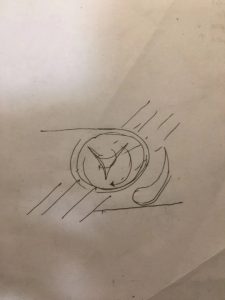
For this project, I tried to create an interstellar-style clock with arcs and circles cycle in different rates. The bluish ink-like path represents the current pace of the second. The two horizontal bars represent the current minute and the amount and length of diagonal bars represent the current hour. As I gained the inspiration from an hourglass, I realized that the cycle period didn’t have to be exactly a minute, or an hour. Then I created a web-like form in the center that revolves with a period of 20 seconds and the red arc with a period of 5 minutes.
function setup() {
    createCanvas(480, 480);

}

var xarray =[]; // array for ink graphics according to seconds
var x1; //variables for central web form
var stepX1 = 10;// steps of the spacing of the central web form
var circleMove = 0;//blue circles movement

function draw() {
    background("black");

    //diagonal bars to represent the growth of every hour and the exact hour of the current time(only look at one side)
    var h = hour();
    var hLength = map(h,0,24,50,440);
    var hColor = map(h,0,24,40,160);

    circleMove +=1;
    for (var hz = 0; hz<h; hz++){
        stroke(133,62,hColor);//changing color of the bar
        strokeWeight(8);
        line(0+15*hz,480,0.5*hLength+15*hz-20,480-0.7*hLength+5*hz);//amount of the purple bar to represent time
        stroke(133,62,hColor);//changing color of the bar
        strokeWeight(8);
        line(480-15*hz,0,480-0.5*hLength-15*hz+20,0.7*hLength-5*hz);//amount of the purple bar to represent time
        noStroke();
        fill("blue");//moving blue circles as fun animation
        circle(0.5*hLength+15*hz+circleMove-20,480-0.7*hLength+5*hz-circleMove,5);
        if (circleMove>50){
            circleMove = 0;
        }
    }


    //two horizontal bars to represent the grouth of minute overtime
    var m = minute();
    var mAdjusted = map(m,0,60,30,480); //fullfill a full length when one hour passed
    var mColor = map(m,0,60,26,150);
    noStroke();
    fill(180,58,mColor);
    rect(0,50,mAdjusted,8);
    noStroke();
    fill(180,mColor,40);
    rect(480,480-8-50,-mAdjusted,8);
    //second
    if (xarray.length>=6){
        xarray.shift();
    }
    var s = second();
    //create ink-like path to represent the path of seconds
    for (var i = s-8; i<=s; i++){
        xarray.push(i);
        var colorOfCircle = map(i,s-8,s,90,255);
        var sizeOfCircle = map(i,s-8,s,5,30);//define the size of the circle
        push();
        translate(240,240);
        rotate(-PI/2);
        stroke(0);
        fill(colorOfCircle, colorOfCircle, 255);
        noStroke();
        strokeWeight(1);
        rotate(radians(6*i));//the ink like traces will move every second and fullfill a full cycle after 60s
        var px = 180 + random(-5,5);
        var py = 0 + random(-3,3);
        frameRate(9);
        circle(px,py,sizeOfCircle);
        pop();
    }
    //changing color of the purple circle to represent the growth of a minute
    var colorOfRing0 = map(s,0,60,145,200);
    var colorOfRing1 = map(s,0,60,0,122);
    var colorOfRing2 = map(s,0,60,90,150);
    noFill();
    strokeWeight(20);
    stroke(colorOfRing0, colorOfRing1,colorOfRing2);
    circle(240,240,230);
    //slowly growing red circle
    var mil = millis();
    push();
    translate(240,240);
    frameRate(30);
    noFill();
    stroke("red");
    strokeWeight(15);
    rotate(-PI/2);
    arc(0,0,100,100,0,mil*PI/150000,OPEN); //revolving a circle every 5 min
    pop();

    // central rotating web-form
    //    Central White Lines
    push();
    translate(240,240);
    rotate(radians(mil*18/1000));//the web form fulfills a cycle every 20 seconds
    for(x1 = 0; x1 < 150; x1 += stepX1){
        strokeWeight(1);
        stroke("white");
        line(x1, 0, -(150-x1)*tan(radians(30)), 150-x1);
    }
    //     Central blue lines
    rotate(radians(120));
    for(x1 = 0; x1 < 150; x1 += stepX1){
        strokeWeight(1);
        stroke(109,129,185);
        line(x1, 0, -(150-x1)*tan(radians(30)), 150-x1);
    }
//    central light purple lines
    rotate(radians(120));
    for(x1 = 0; x1 < 150; x1 += stepX1){
        strokeWeight(1);
        stroke(152,109,185);
        line(x1, 0, -(150-x1)*tan(radians(30)), 150-x1);
    }
    pop();


}
![[OLD FALL 2019] 15-104 • Introduction to Computing for Creative Practice](../../../../wp-content/uploads/2020/08/stop-banner.png)