![[OLD FALL 2019] 15-104 • Introduction to Computing for Creative Practice](../../../../wp-content/uploads/2020/08/stop-banner.png)
//Sewon Park
//sewonp@andrew.cmu.edu
//Section B
//Project-07
function setup() {
createCanvas(480, 480);
}
function draw() {
background(0,0,0);
push();
translate(width/2, height/2); //placing curve at center
drawBicorn();
pop();
}
function drawBicorn(){
var x;
var y;
var w = map(mouseX,0,width,0,200); // changes length of the curve through mouse control
var h = map(mouseY,0,height,0,200) // changes height of the curve through mouse control
stroke(255,0,0);
beginShape();
for(var i = 0; i <200; i ++){
var t = map (i, 0, 200, 0 ,200);
x = (w*sin(t)); //x coordinate equation for Bicorn
y = (h*sin(t)*cos(t)); //y coordinate equation for Bicorn
vertex(x,y); // placing curve at center
}
endShape(CLOSE);
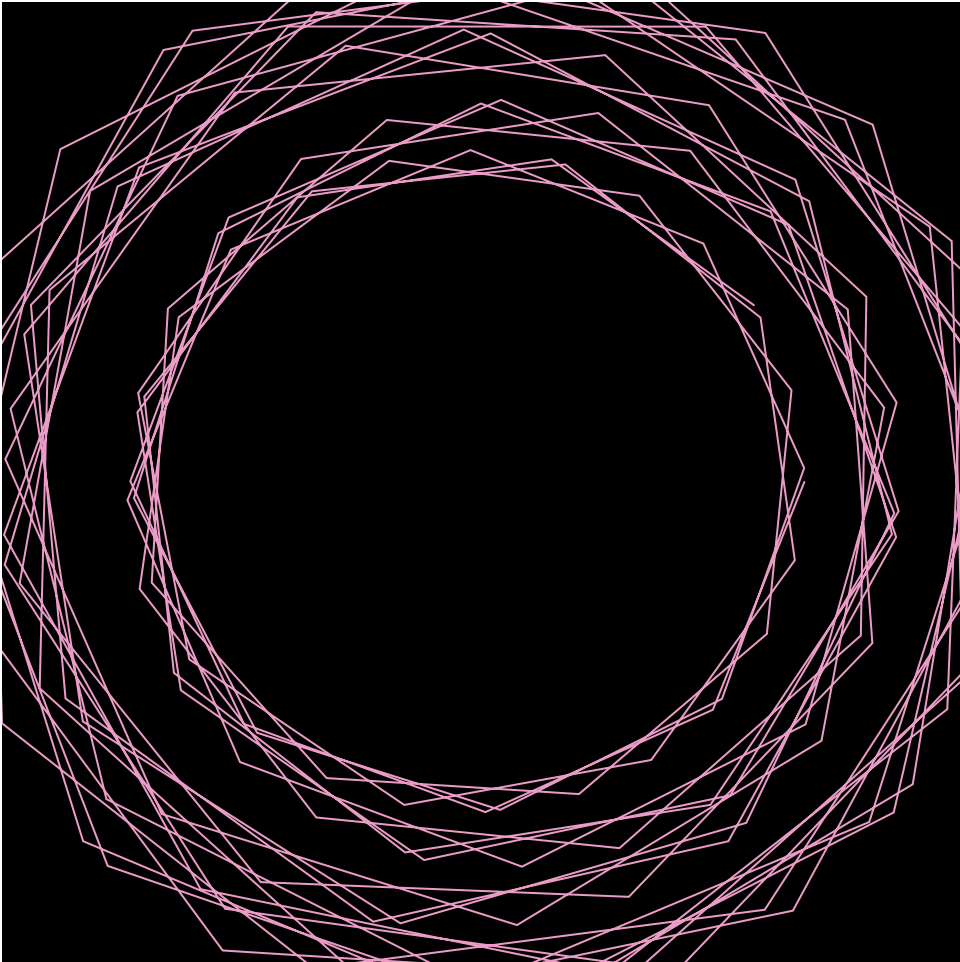
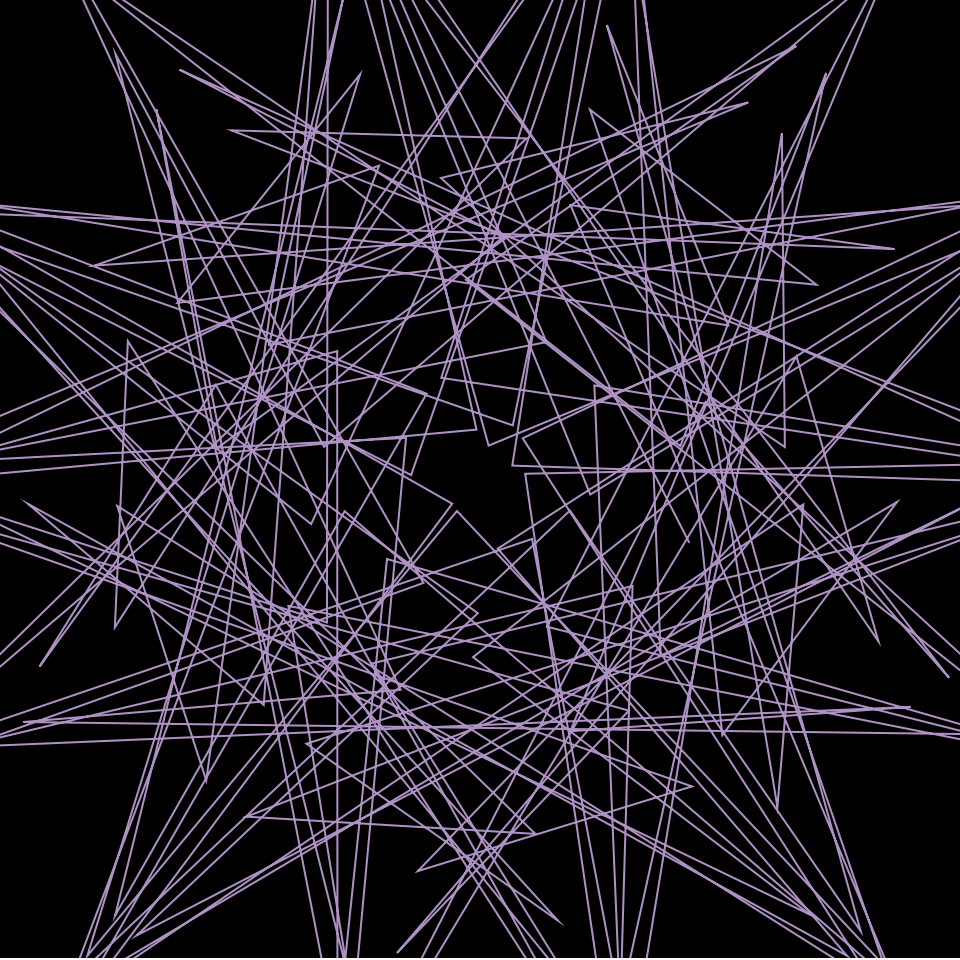
}For this project, I was very conflicted about choosing the curve as I was not knowledge about the realm of mathematical graphs. Having only known parabolas and hyperbolas, I was surprised to see the myriad of curves on the reference website. Many of the curves seemed somewhat randomly drawn without specific symmetry or shape. As I appreciate symmetry, I decided to select the Bicorn curve. The curve represented a variety of objects such as a ribbon, the infinity sign, and a mask. I tried to develop an abstract visualization of Deadpool’s mask.
I also thought of Spiderman whilst making the project, prompting me to create a web like structure to assimilate spiderwebs when creating the mask.