![[OLD FALL 2019] 15-104 • Introduction to Computing for Creative Practice](../../../../wp-content/uploads/2020/08/stop-banner.png)
//sarah kang
//section c
//sarahk1@andrew.cmu.edu
//project-07-curves
var ang = 0;
var nPoints = 100;
function setup() {
createCanvas(480, 480);
}
function draw() {
background(0);
noFill();
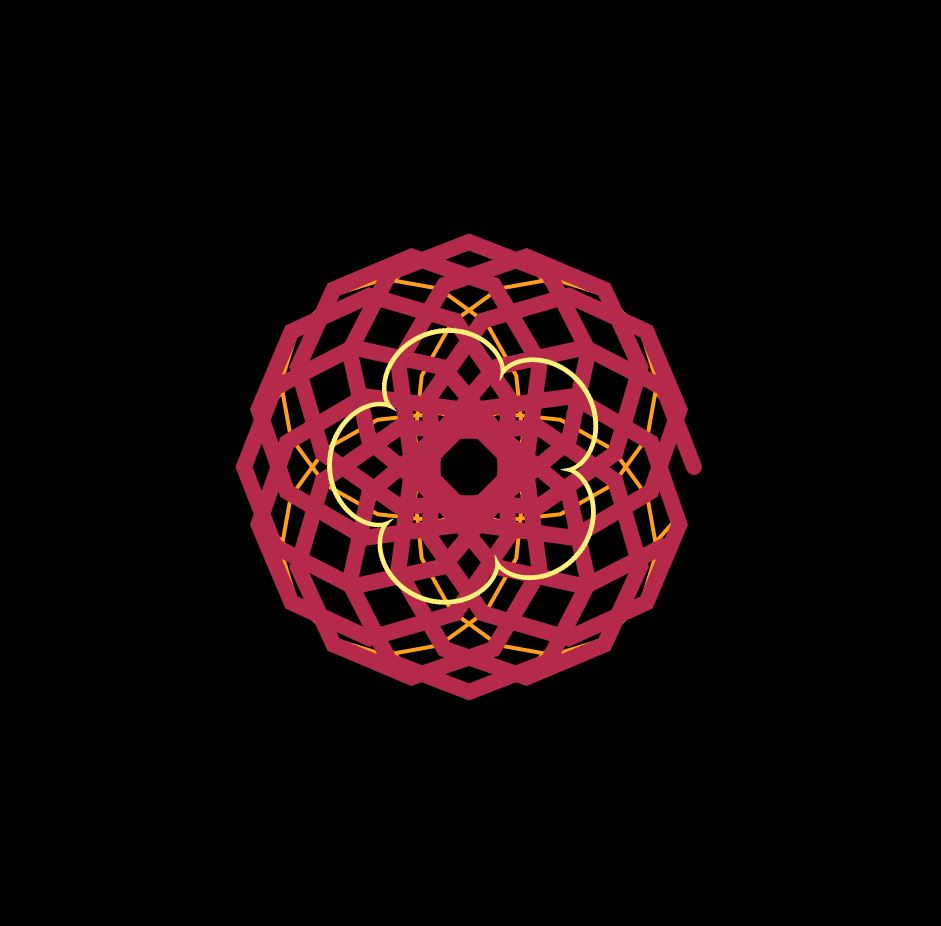
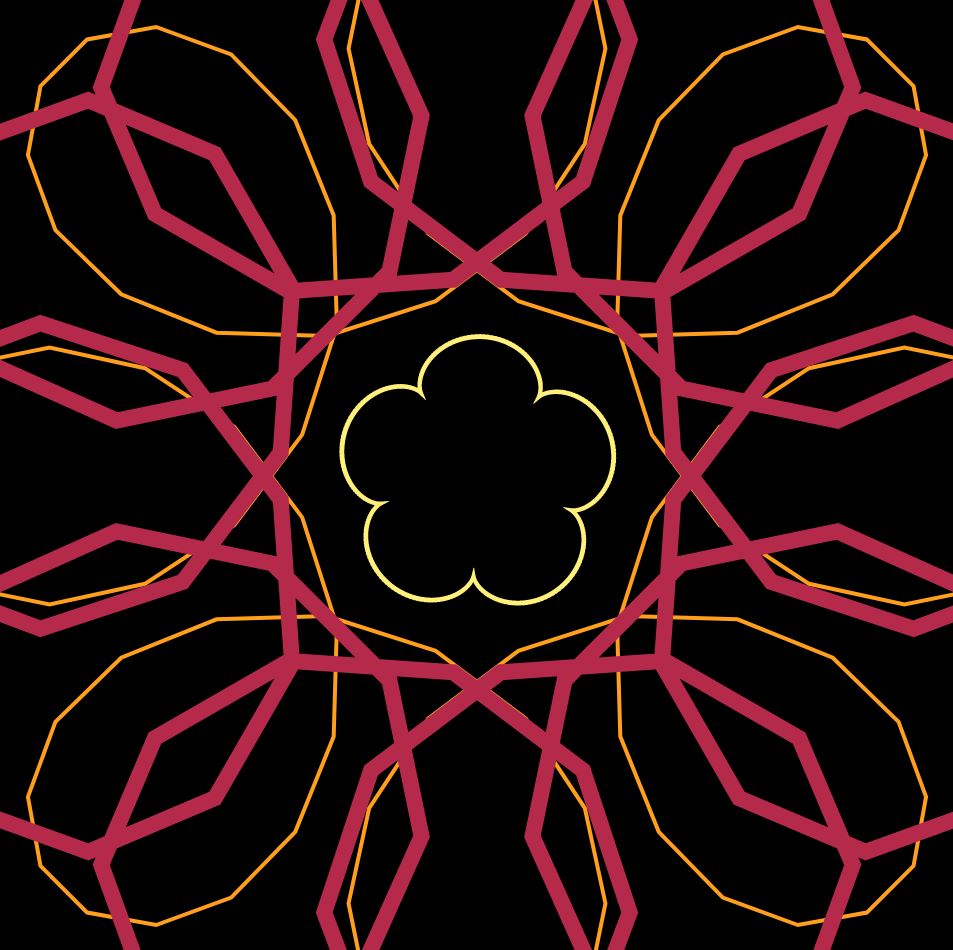
//orange curves
push();
translate(width / 2, height / 2);
strokeWeight(2);
stroke(255, 159, 28);
drawHypo1();
pop();
//red curves
push();
translate(width / 2, height / 2);
strokeWeight(8);
stroke(181, 42, 74);
drawHypo2();
pop();
//yellow curves
push();
strokeWeight(2);
stroke(255, 240, 122);
translate(width / 2, height / 2);
rotate(radians(ang));
ang += mouseX / 50;
drawRan();
pop();
}
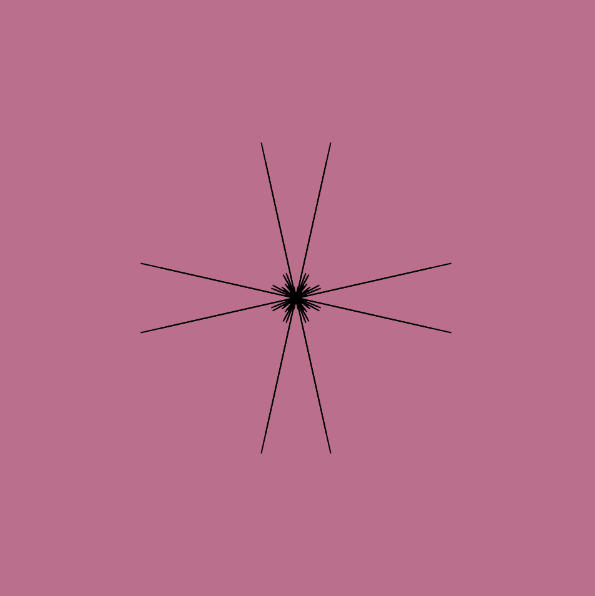
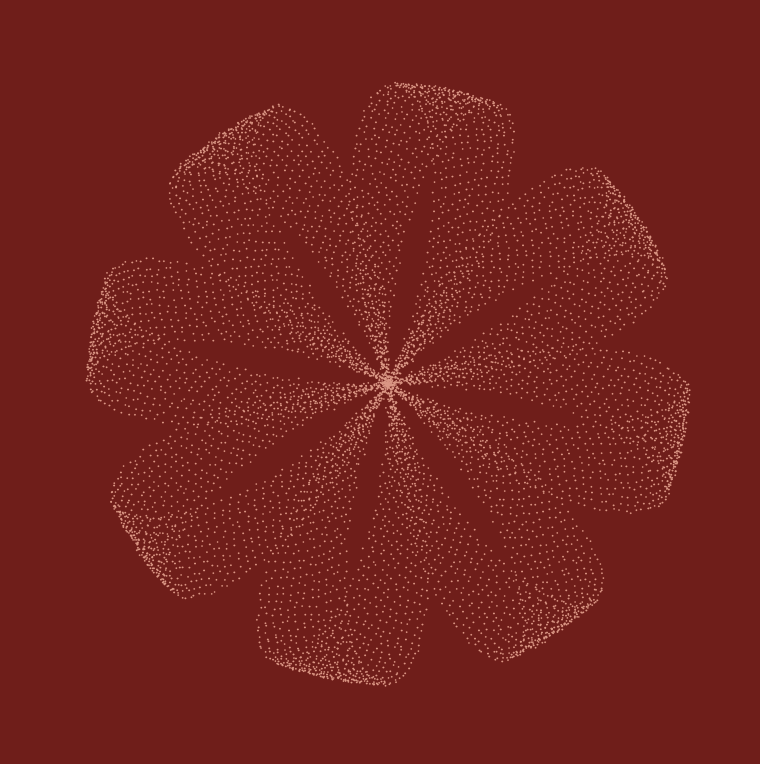
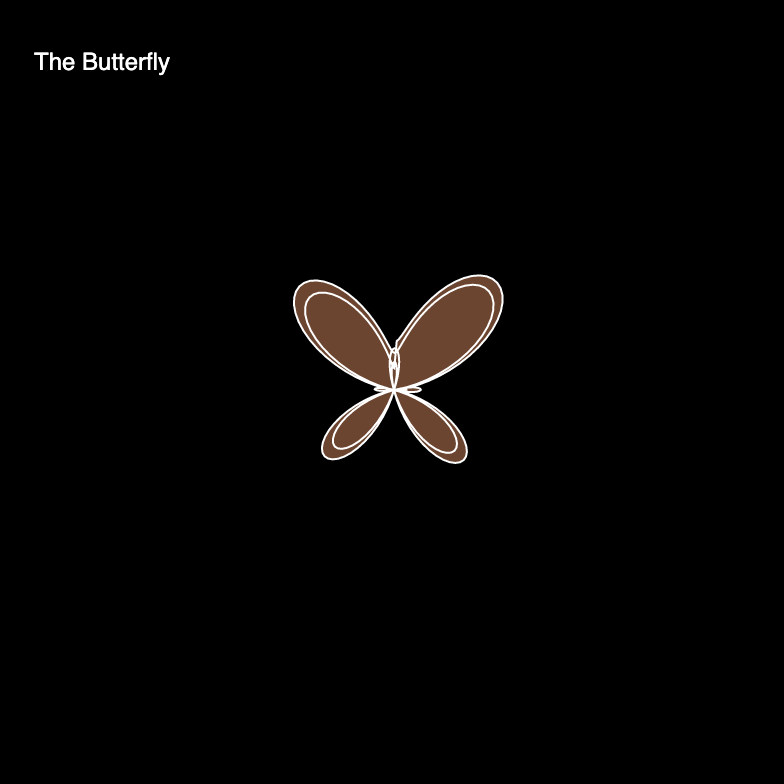
//Ranunculoid Curve
function drawRan(){ //http://mathworld.wolfram.com/Ranunculoid.html
var sz = 10;
//curve
beginShape();
for (var i = 0; i < nPoints; i += 0.1){
var xr = sz * (6 * cos (i) - cos (6 * i));
var yr = sz * (6 * sin (i) - sin (6 * i));
vertex(xr, yr);
}
endShape();
}
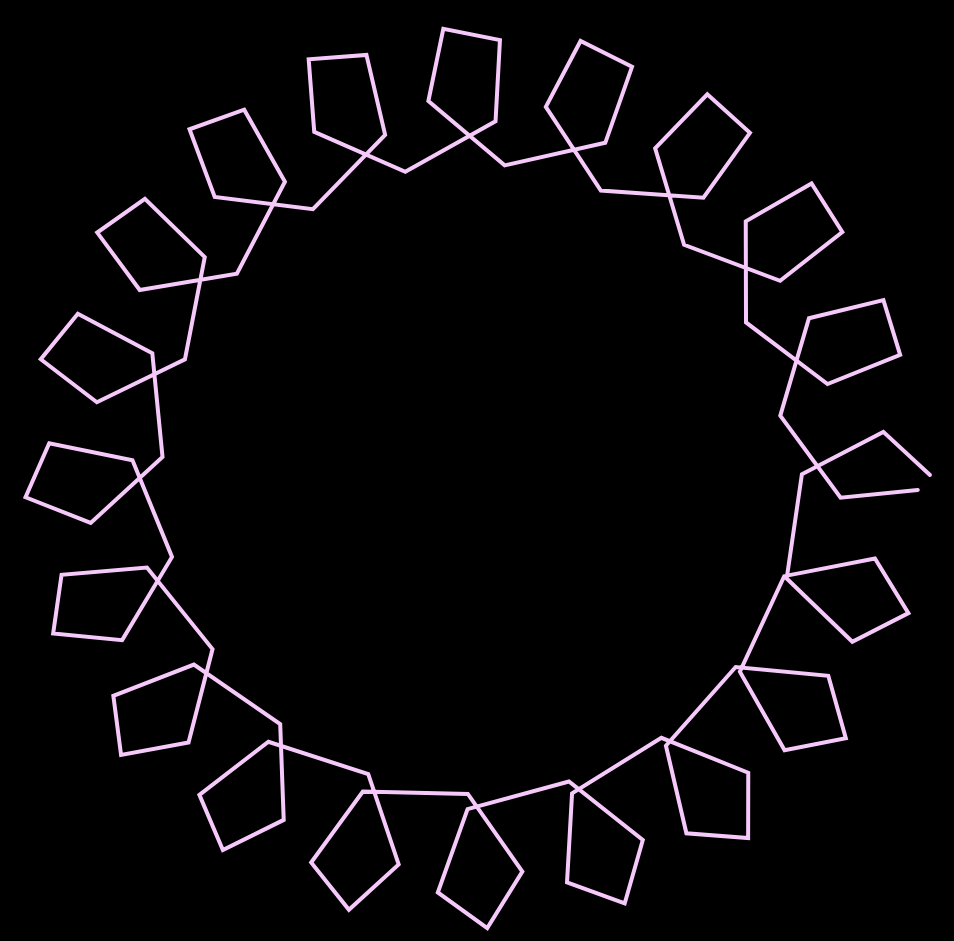
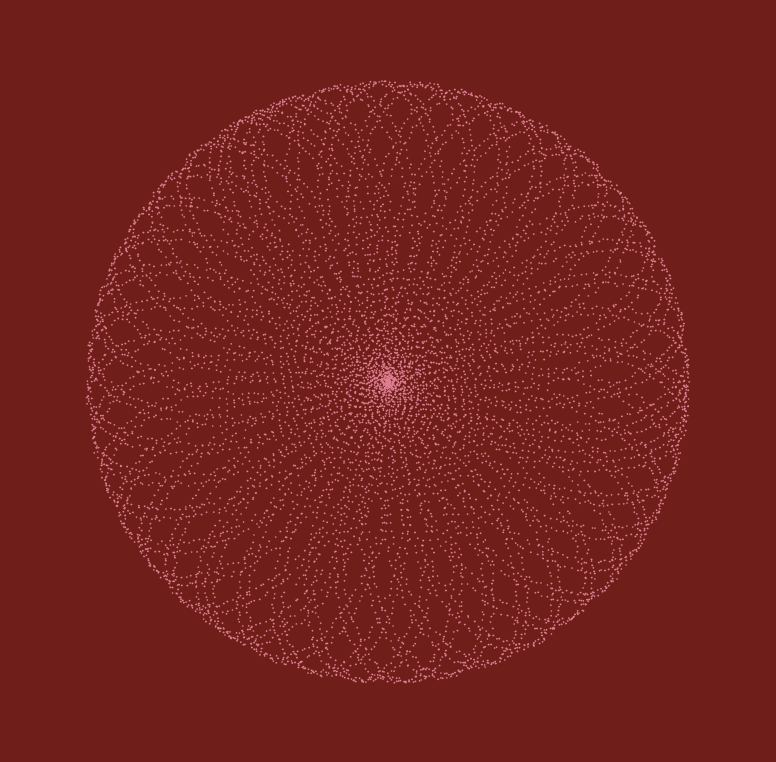
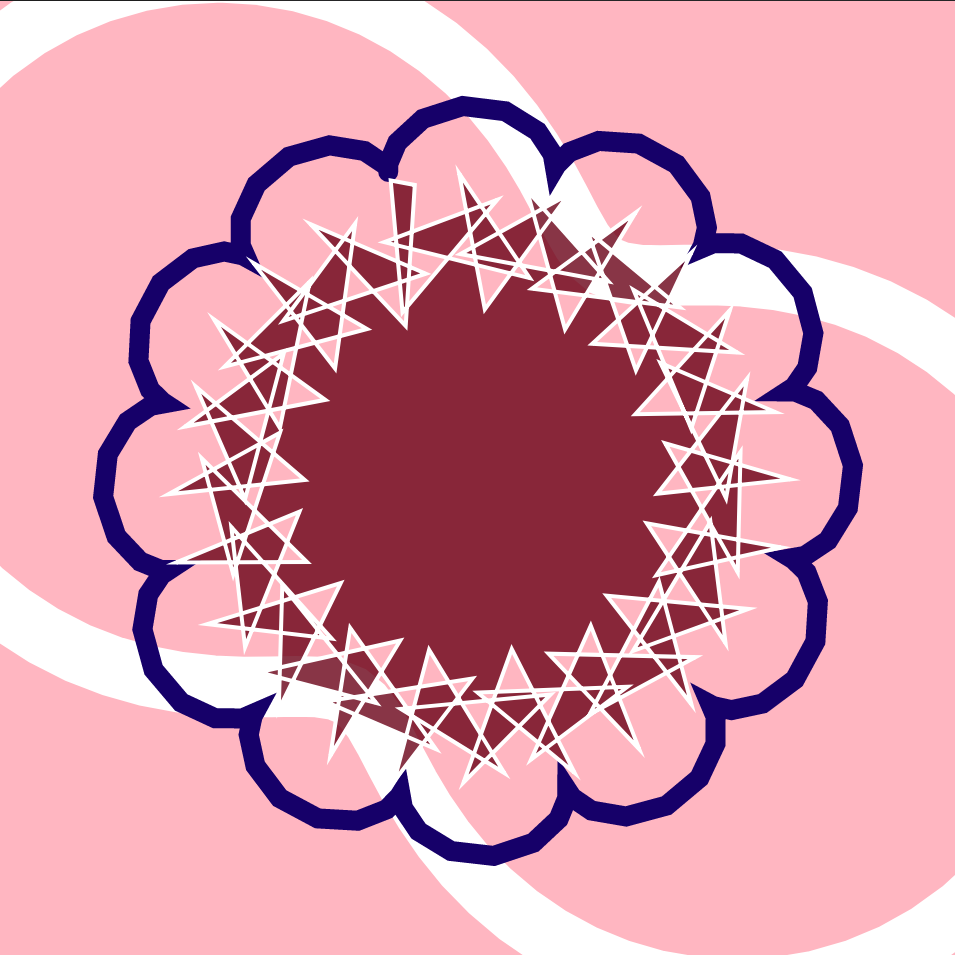
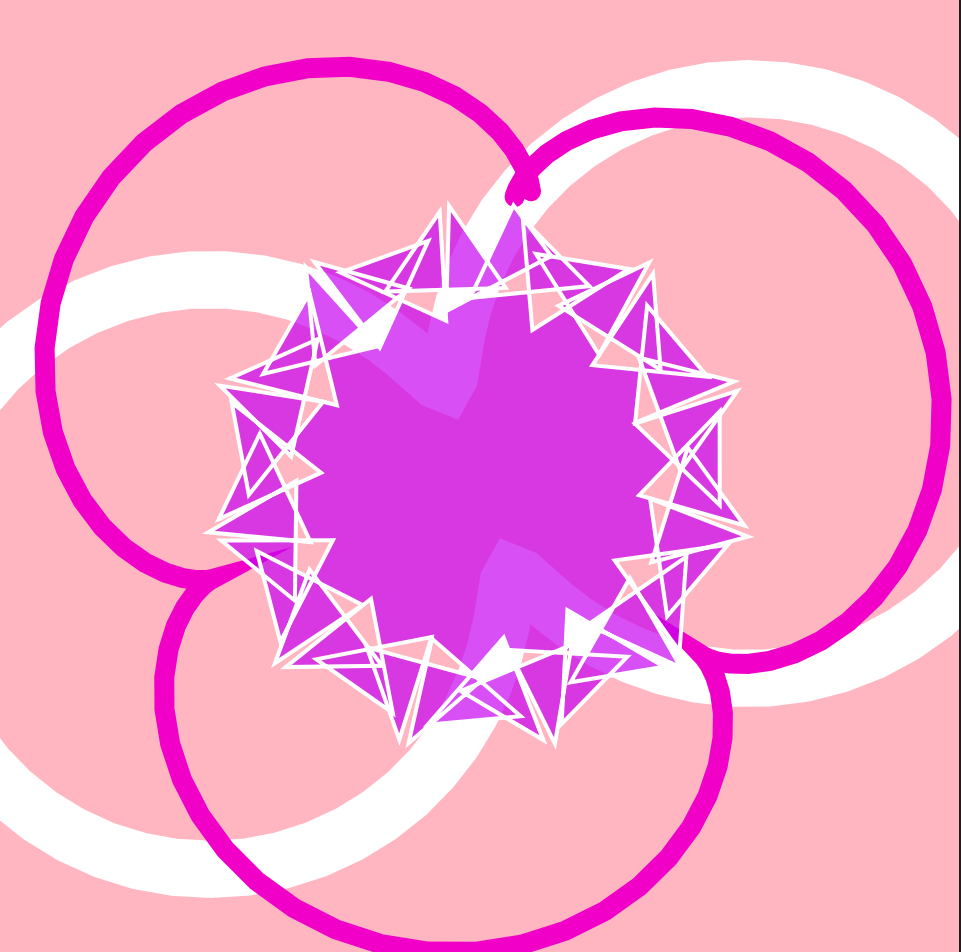
//Hypotrochoid Curve 1
function drawHypo1() { //http://mathworld.wolfram.com/Hypotrochoid.html
var x;
var y;
//controls
var h = map(mouseY, 0, height, 0, 80);
var a = map(mouseX, 0, width, 0, 300);
var b = a / 8;
//curve
beginShape();
for (var i = 0; i < nPoints; i ++) {
var t = map(i, 0, 100, 0, TWO_PI)
x = (a - b) * cos(t) + h * cos(((a - b) / b) * t)
y = (a - b) * sin(t) - h * sin(((a - b) / b) * t)
vertex(x, y)
};
endShape();
}
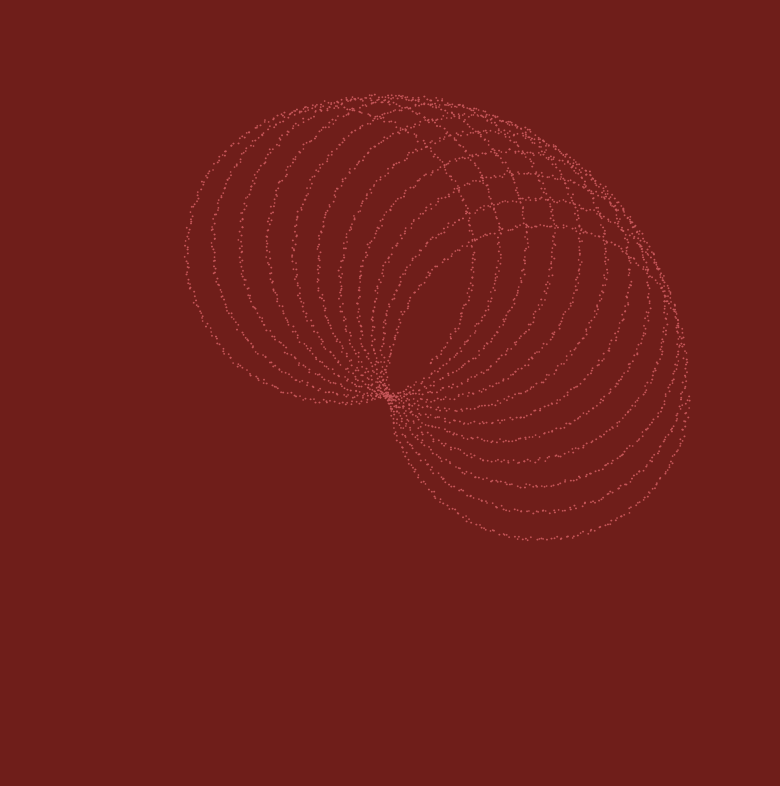
//Hypotrochoid Curve 2
function drawHypo2() { //http://mathworld.wolfram.com/Hypotrochoid.html
var x;
var y;
//controls
var h = map(mouseY, 0, height, 0, 80);
var a = map(mouseX, 0, width, 0, 300);
var b = a / 12;
//curve
beginShape();
for (var i = 0; i < nPoints; i ++) {
var t = map(i, 0, 100, 0, TWO_PI)
x = (a - b) * cos(t) + h * cos(((a - b) / b) * t)
y = (a - b) * sin(t) - h * sin(((a - b) / b) * t)
vertex(x, y)
};
endShape();
}
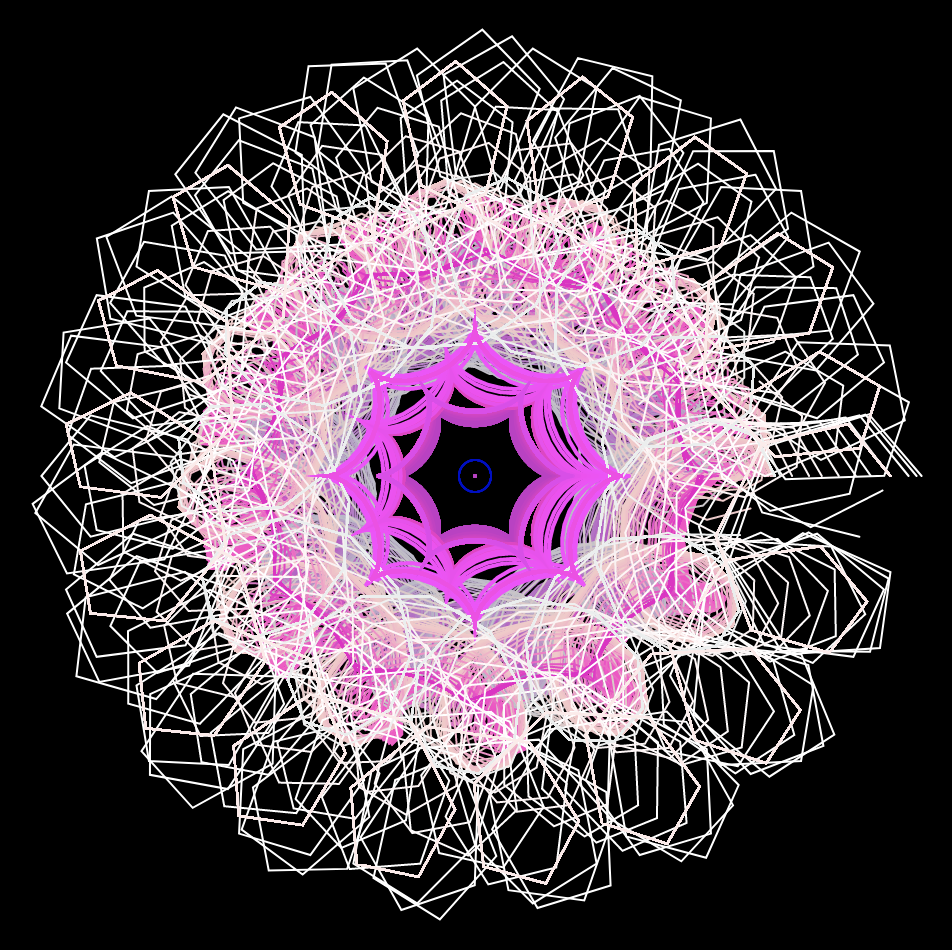
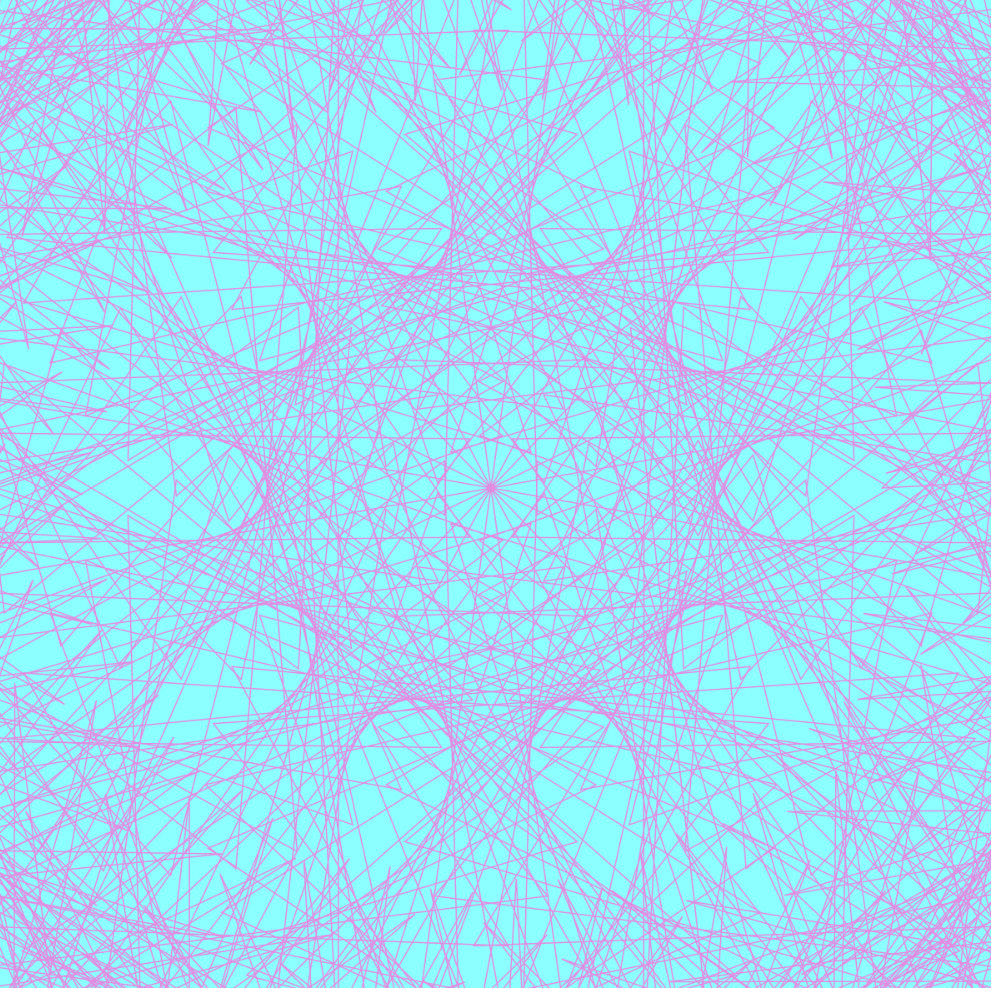
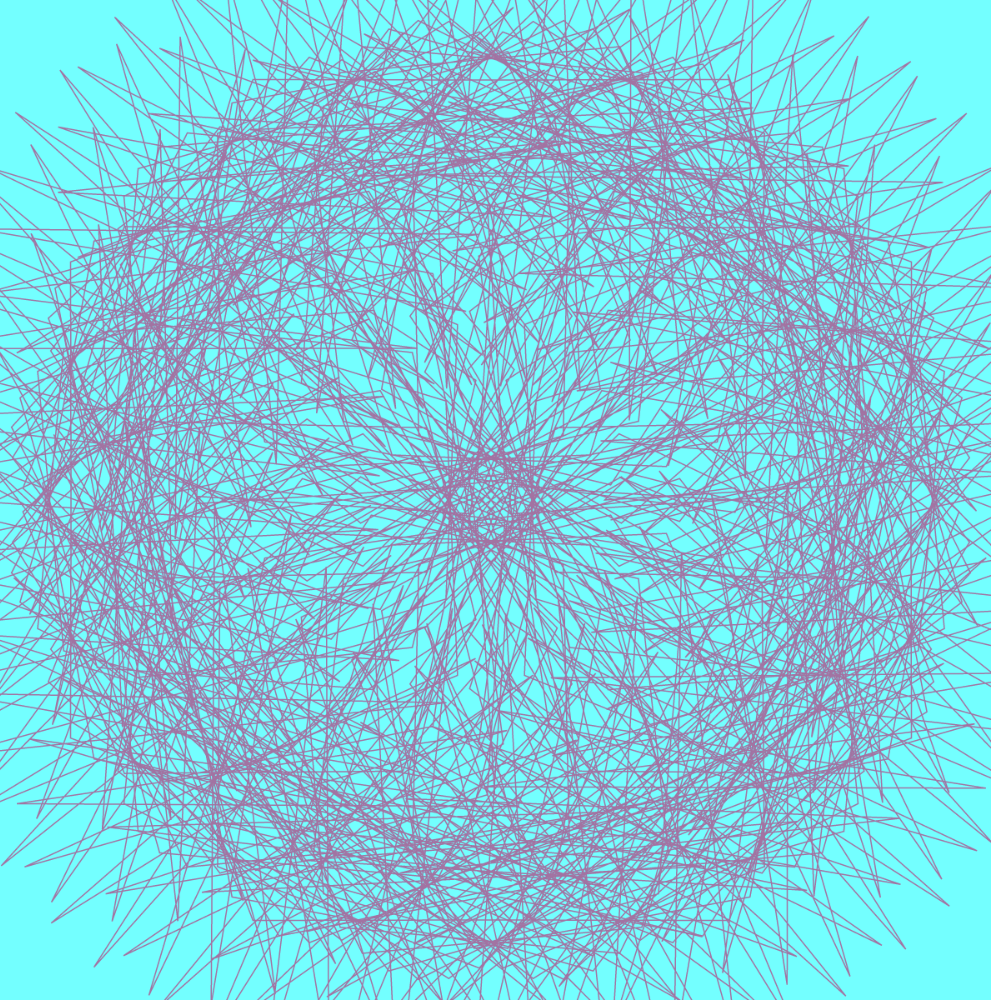
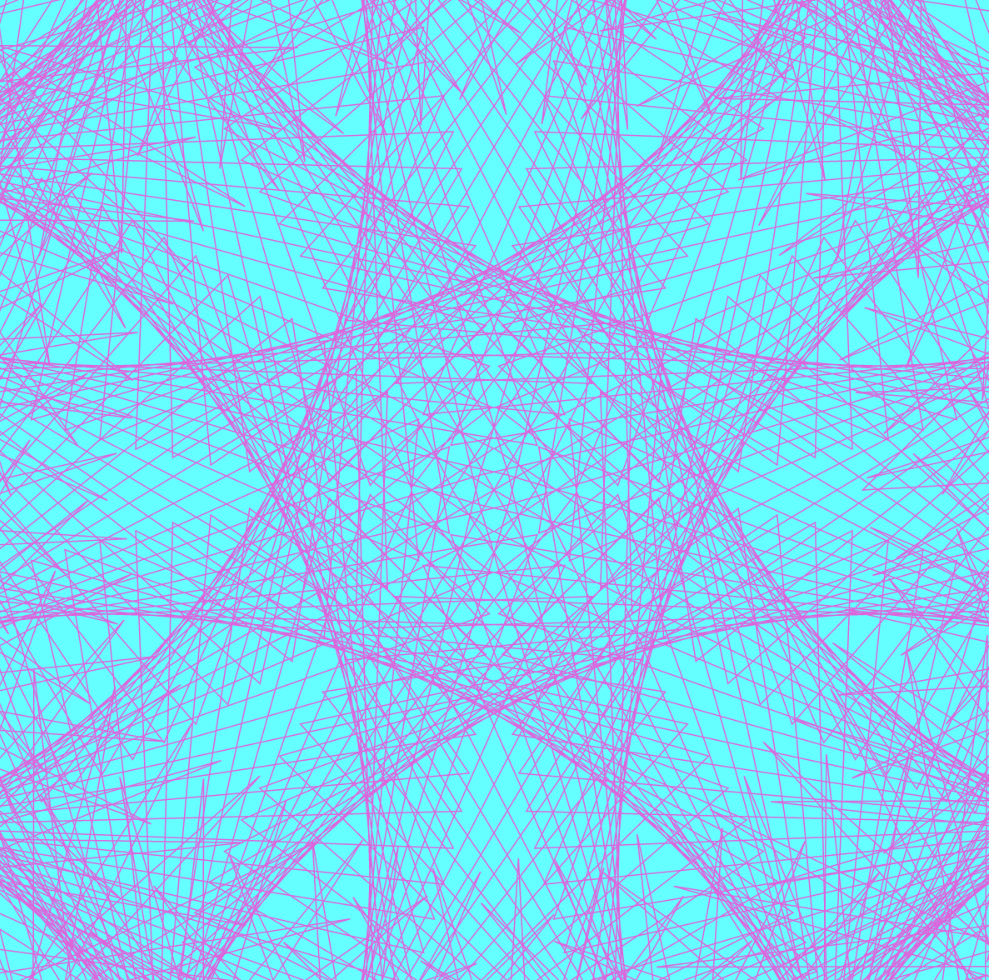
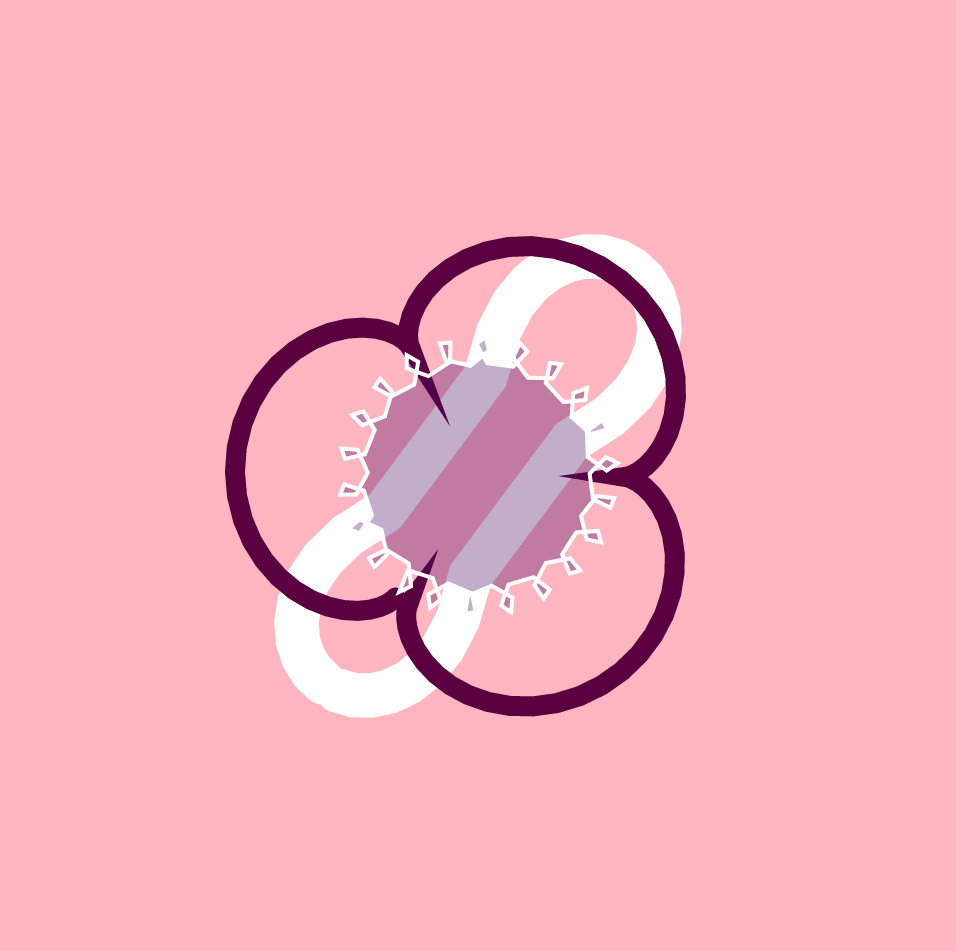
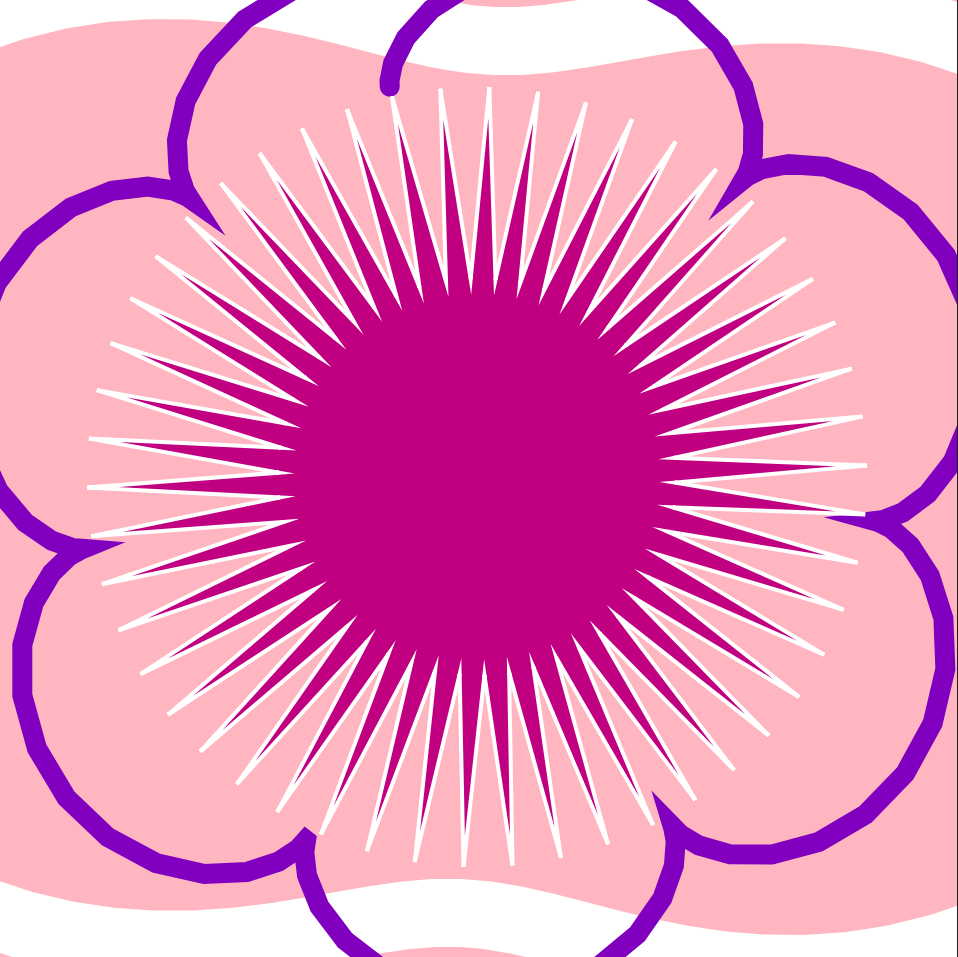
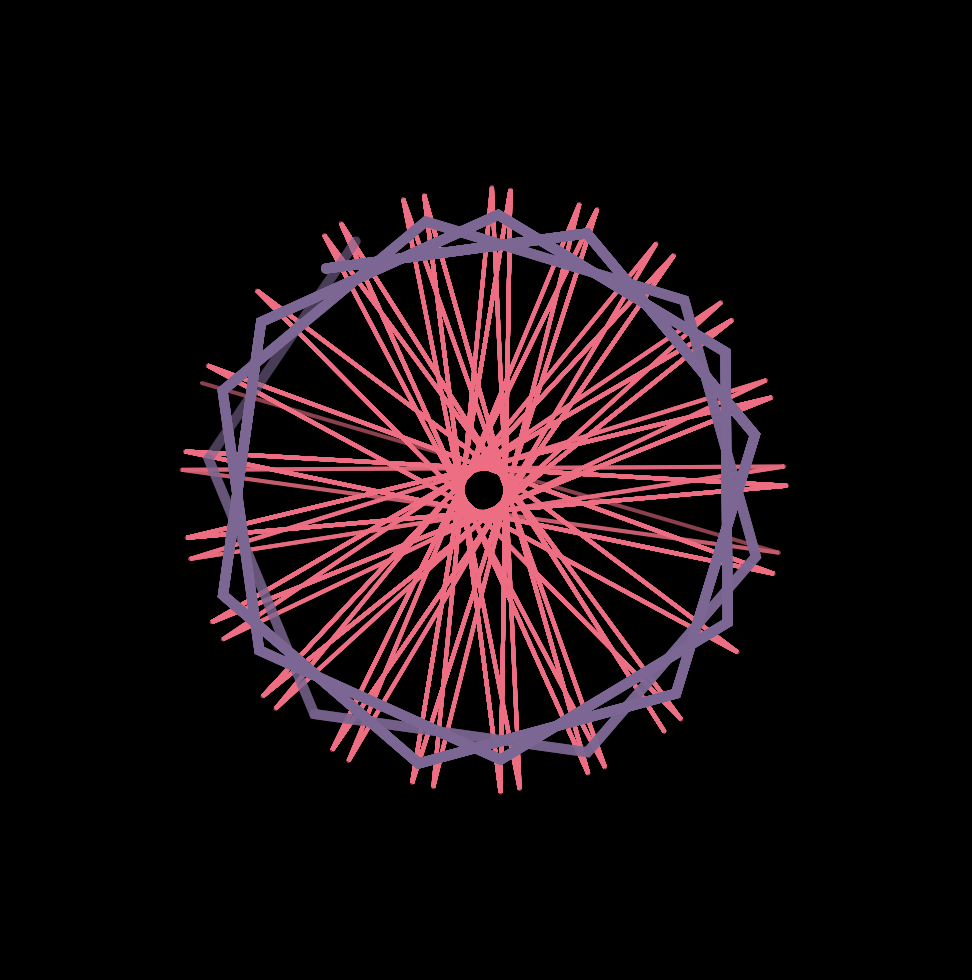
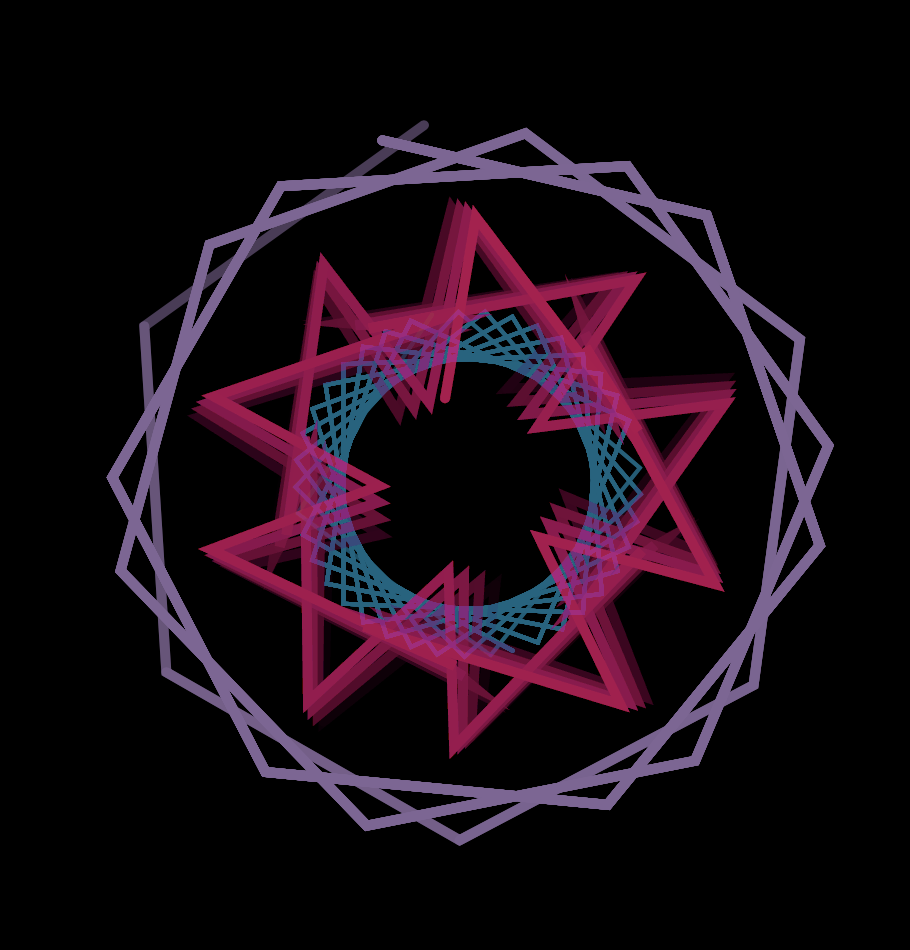
At first, trying to understand how the math equations were controlled was pretty confusing; after experimenting with the variables, I was able to adjust and change the outputs of the curves equations to how I wanted it to look. Then, I formatted the curves in terms of color and stroke weight to create a flowery design.