Project 4- String Art

sketch
//Eva Oney
//eoney
//section C

var c1 = 0;
var c2 = 255;

function setup() {
    createCanvas(400, 300);
    background(220);
    text("p5.js vers 0.9.0 test.", 10, 15);

}

function draw() {
    background(0);
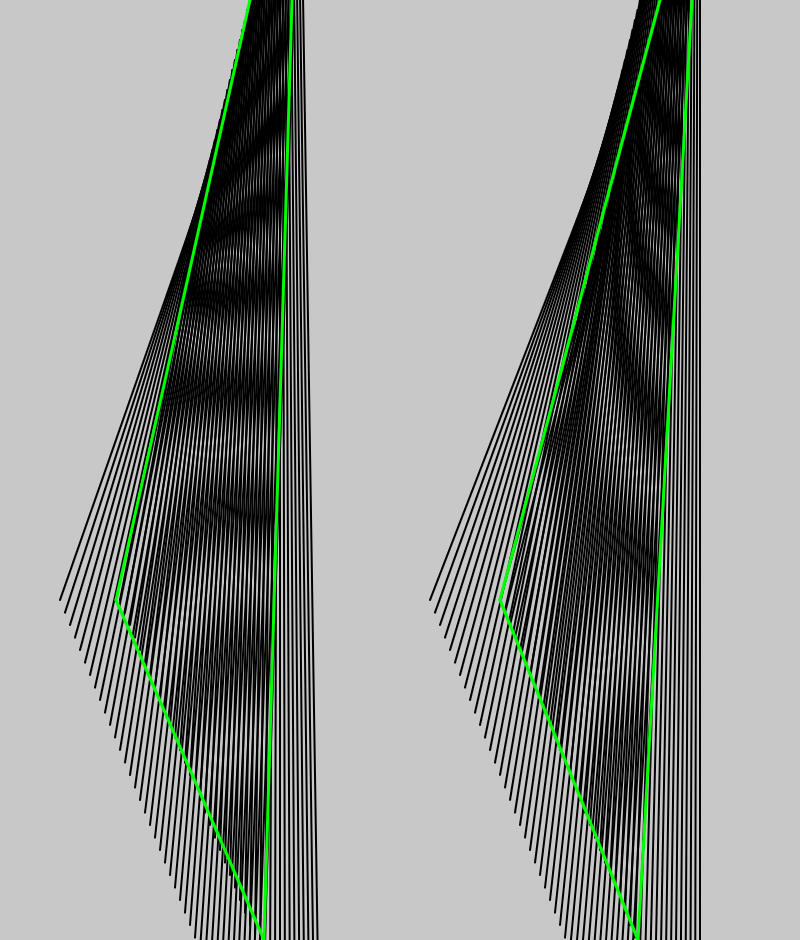
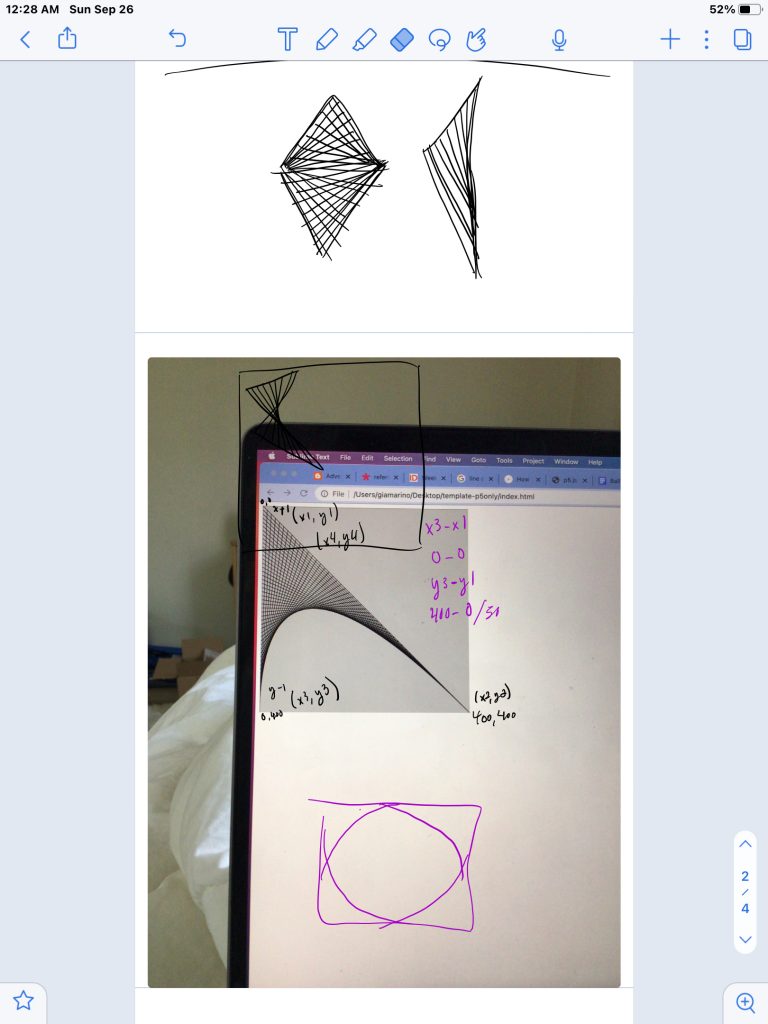
    //loop for lines coming off the x axis
    for (var i = 1; i <= 500; i += 5) {
        stroke(255,0,0);
//I found my x and y values by originally setting x1 and x2 to mouseX
//and mouseY, then when I found a position I liked, I printed the value
//of mouseX and mouseY and got (15,400)
        line(400 + i, 0, 15 +i, 150);
        line(15 + i, 150, 400 +i, 400);
    }
    //loop for lines coming off the y axis
    for(var i = 0; i <=500; i +=5) {
        stroke(0,0,255);
        line(0, 400 + i, 200, 15 + i );
        line(400, 400 + i, 200, 15 +i);
    }
    noLoop();
 }

I kept my code pretty simple so I could focus on understanding how the loops and parameters actually affect the image. I am not a math wiz by nature, so it is a little difficult for me to understand but I am slowly getting the hang of it.

Project 4: String Art

sketch

var dx1;
var dy1;
var dx2;
var dy2;
var dx3;
var dy3;
var dx4;
var dy4;
var dx5;
var dy5;
var dx6;
var dy6;
var dx7;
var dy7;
var dx8;
var dy8;
var dx9;
var dy9;
var dx10;
var dy10;
var dx11;
var dy11;
var dx12;
var dy12;
var dx13;
var dy13;
var dx14;
var dy14;
var dx15;
var dy15;
var dx16;
var dy16;
var dx17;
var dy17;
var dx18;
var dy18;
var numLines = 30;


function setup() {
    createCanvas(400, 400);
    background("yellow");

    //white middle strings
    dx1 = (180-50)/numLines;
    dy1 = (250-150)/numLines;
    dx2 = (270-340)/numLines;
    dy2 = (200-100)/numLines;
    
    //left white strings
    dx3 = (150-110)/numLines;
    dy3 = (150-100)/numLines;
    dx4 = (260-300)/numLines;
    dy4 = (140-50)/numLines;

    //middle white strings
    dx5 = (150-50)/numLines;
    dy5 = (260-150)/numLines;
    dx6 = (140-90)/numLines;
    dy6 = (30-150)/numLines;

    //upper black strings
    dx7 = (230-100)/numLines;
    dy7 = (280-350)/numLines;
    dx8 = (350-150)/numLines;
    dy8 = (180-280)/numLines;

    //loweer black strings
    dx9 = (320-200)/numLines;
    dy9 = (250-50)/numLines;
    dx10 = (200-250)/numLines;
    dy10 = (300-30)/numLines;

    //left blue strings
    dx11 = (250-150)/numLines;
    dy11 = (80-200)/numLines;
    dx12 = (120-100)/numLines;
    dy12 = (20-250)/numLines;

    //middle blue strings
    dx13 = (240-150)/numLines;
    dy13 = (80-200)/numLines;
    dx14 = (220-100)/numLines;
    dy14 = (120-250)/numLines;

    //right blue strings
    dx15 = (240-150)/numLines;
    dy15 = (80-200)/numLines;
    dx16 = (220-100)/numLines;
    dy16 = (120-250)/numLines;

}

function draw() {
    var x1 = 50;
    var y1 = 150;

    var x2 = 270;
    var y2 = 200;

    var x3 = 50;
    var y3 = 150;

    var x4 = 20;
    var y4 = 150;

    var x5 = 100;
    var y5 = 180;

    var x6 = 90;
    var y6 = 350;

    var x7 = 300
    var y7 = 250;

    var x8 = 250;
    var y8 = 180;

    var x9 = 320;
    var y9 = 250;

    var x10 = 380;
    var y10 = 80;

    var x11 = 150;
    var y11 = 200;

    var x12 = 100;
    var y12 = 250;

    var x13 = 250;
    var y13 = 200;

    var x14 = 80;
    var y14 = 250;

    var x15 = 220;
    var y15 = 200;

    var x16 = 180;
    var y16 = 250;

    for (var i = 0; i <= numLines; i += 1) {
        stroke("white")
        line(x1, y1, x2, y2);
        x1 += dx1;
        y1 += dy1;
        x2 -= dx2;
        y2 -= dy2;
        line(x3, y3, x4, y4);
        x3 -= dx3;
        y3 -= dx3;
        x4 += dx4;
        y4 += dy4;
        line(x5, y5, x6, y6);
        x5 -= dx5;
        y5 -= dx5;
        x6 += dx6;
        y6 += dy6;

        stroke("black")
        line(x7, y7, x8, y8);
        x7 -= dx7;
        y7 -= dx7;
        x8 += dx8;
        y8 += dy8;
        line(x9, y9, x10, y10);
        x9 -= dx9;
        y9 -= dx9;
        x10 += dx10;
        y10 += dy10;

        stroke("blue")
        line(x11, y11, x12, y12);
        x11 += dx11;
        y11 += dx11;
        x12 += dx12;
        y12+= dy12;

        line(x13, y13, x14, y14);
        x13 += dx13;
        y13 += dx13;
        x14 += dx14;
        y14+= dy14;

        line(x15, y15, x16, y16);
        x15 += dx15;
        y15 += dx15;
        x16 += dx16;
        y16+= dy16;


    }
    noLoop();
}

The difficult part of this project was understanding what numbers to change in order to get the shape that I wanted and why it changed, but when I did, I just kept adding to my canvas and adjusting the numbers to get the design I wanted.

Week 4: String Art Project

sketch
//Brandon Yi
//btyi
//Section A
var dx1;
var dy1;
var dx2;
var dy2;
var numLines = 25;

function setup() {
    createCanvas(300, 400);
    background(200);
    line(10,10,10,390);
    line(10,390,290,390);
    line(10,10,290,10);
    line(290,10,290,390);
    dx = (290-10)/numLines; //setting x increments
    dy = (390-10)/numLines; //setting y increments
}

function draw() {
    //setting moveable points for increments
    var x1 = 290;
    var y1 = 390;
    var x2 = 10;
    var y2 = 10;
    var x3 = 10;
    var y3 = 10;
    
    for (var i = 0; i <= numLines; i += 1) {
        line(10, 10, x1, y1);
        x1 -= dx;
        line(290,390,x2,y2);
        y2 += dy;
        line(290,10,x3,y3);
        x3 += dx;
        y3 += dy;

    }
    noLoop();
}

I had a little bit of trouble working around the diagonal piece of my artwork. I think at first I struggled a little bit to understand my own code, but after solidifying the idea that dx and dy are the increments, it made sense that I would need to use them in my code for the diagonal piece.

Project-04: String Art

Emilio Bustamante

My main objective is to create organic shapes when I overlap different lines groups between each other.


var dx1;
var dy1;
var dx2;
var dy2;
var numLines = 40;

function setup() {
    createCanvas(400, 470);
    background(200);
    dx1 = (150-50)/numLines;
    dy1 = (300-50)/numLines;
    dx2 = (350-300)/numLines;
    dy2 = (100-300)/numLines;
}
function draw() {
//drawing in the right
  translate(100, 0);
//group of lines in the left
    var x1 = 150;
    var y1 = 300;
    var x2 = 200;
    var y2 = 120;
    for (var i = 0; i <= numLines; i += 1) {
        line(x1, y1, x2, y2);
        x1 += dx1;
        y1 += dy1;
        x2 += dx2;
        y2 += dy2;
    }
//group of lines in the right
    var x1 = 115;
    var y1 = 300;
    var x2 = 200;
    var y2 = 80;
    for (var i = 0; i <= numLines; i += 1) {
        line(x1, y1, x2, y2);
        x1 += dx1;
        y1 += dy1;
        x2 += dx2;
        y2 += dy2;
    }
//drawing in the left 
  translate(-200,0); 
//group of lines in the left
    var x1 = 160;
    var y1 = 300;
    var x2 = 200;
    var y2 = 100;
    for (var i = 0; i <= numLines; i += 1) {
        line(x1, y1, x2, y2);
        x1 += dx1;
        y1 += dy1;
        x2 += dx2;
        y2 += dy2;
    }
//group of lines in the right
    var x1 = 130;
    var y1 = 300;
    var x2 = 200;
    var y2 = 100;
    for (var i = 0; i <= numLines; i += 1) {
        line(x1, y1, x2, y2);
        x1 += dx1;
        y1 += dy1;
        x2 += dx2;
        y2 += dy2;
    }
//contour for drawing in the left
    translate(100,0);
    stroke(0,255,0);
    strokeWeight(1.5);
    line(125,0,58,300);
    line(58,300,132,470);
    line(132,470,146,0);
//contour for drawing in the right
    translate(200,0);
    line(130,0,50,300);
    line(50,300,119,470);
    line(119,470,146,0);
    noLoop();
}

Project 04 – String Art

sketch

//Gia Marino
//gnmarino
//section D

var dx1;
var dy1;
var dx2;
var dy2;
var numLines = 50; //how many lines drawn between line 1 and line 2

function setup() {
    createCanvas(400, 300);
    background(200);
   
}

function draw() {


    //draw bottom left string art - line 1: (0, 0) (0, 300) line 2: (0, 300) (400, 300)

    drawStringArt(0, 0, 0, height, 0, height, width, height);

    //draw bottom right string art - line 1: (0, 300) (400, 300) line 2: (400, 300) (400, 0)

    drawStringArt(0, height, width, height, width, height, width, 0);

    //draw top right string art - line 2: (400, 300, 400, 0, 400, 0, 0, 0)

    drawStringArt(width, height, width, 0, width, 0, 0, 0);

    //draw top left string art - line 2: (400, 0, 0, 0, 0, 0, 0, 300)

    drawStringArt(width, 0, 0, 0, 0, 0, 0, height);
    
    noLoop();
}

    //function that creates string art shape
function drawStringArt(ix1, iy1, ix2, iy2, ix3, iy3, ix4, iy4) {

    line(ix1, iy1, ix2, iy2); //line 1 
    line(ix3, iy3, ix4, iy4); //line 2 

    dx1 = (ix2-ix1)/numLines; //change in x variables in line 1
    dy1 = (iy2-iy1)/numLines; //change in y variables in line 1
    dx2 = (ix4-ix3)/numLines; //change in x variables in line 2
    dy2 = (iy4-iy3)/numLines; //change in y variables in line 2  

    //repeats drawing lines to make string art
    //starts at the beginning of line 1 and line 2 
    //finishes shape at the end of line 1 and line 2

    for (var i = 0; i <= numLines; i += 1) {

        line(ix1, iy1, ix3, iy3);
        ix1 += dx1;
        iy1 += dy1;
        ix3 += dx2;
        iy3 += dy2;
    }  
}


I feel like the most difficult part of this project was understanding the math and then understanding how the code works. This was necessary for me to create code that was more readable and now it is very easy to add onto.

A picture of my process of figuring out the math and how I wanted the piece to look

Project-04: String-Art

My Project

//allows for rotation
var rot = 0;

function setup() {
    createCanvas(400, 300);
    background(220);
    text("p5.js vers 0.9.0 test.", 10, 15);
}

function draw() {
    background(220);
    lineSpread(400, 0, 0, 400, 10, 0, 0);
    lineSpread(0, 300, 0, 400, 10, 0, 0);
    lineSpread(0, 0, 0, 400, 10, 0, 0);
    lineSpread()
    fill(220);
    rect(300, 20, 80, 80);
    circle(75, 225, 75);
    if ((mouseX > 300 & mouseX < 380) && (mouseY < 100 && mouseY > 20) ){
        background(220);
        line(150, 100, 250, 100);
        line(150, 200, 250, 200);
        line(150, 100, 150, 200);
        line(250, 100, 250, 200);
        lineSpread(200, 0, 150, 250, 10, 0, 100);
        lineSpread(200, 300, 150, 250, 10, 0, 200);
        lineSpread(0, 150, 100, 200, 10, 150, 0);
        lineSpread(400, 150, 100, 200, 10, 250, 0);
        line(0, 150, 200, 0);
        line(200, 0, 400, 150);
        line(200, 300, 400, 150);
        line(0, 150, 200, 300);
    }
    else if (dist(mouseX, mouseY, 75, 225) < 40){
         background(220);
         fill(220);
         lineSpread(200, 150, 0, 300, 5, 112.5, 0);
         lineSpread(200, 150, 0, 300, 5, 287.5, 0);
         for (var i = 0; i < 300; i += 5){
              line(0, i, 112.5, i);
              line(287.5, i, 400, i);
         }
         stroke(20);
         circle(75, 225, 75);
         circle(75, 75, 75);
         circle(325, 75, 75);
         circle(325, 225, 75);
         lineSpread(200, 0, 150, 250, 10, 0, 60);
         lineSpread(200, 300, 150, 250, 10, 0, 240);
         lineSpread(200, 150, 150, 250, 10, 0, 60);
         lineSpread(200, 150, 150, 250, 10, 0, 240);
         push();
         translate(75, 225);
         rotate(radians(rot));
         line(0, 0, 26.5, 26.5);
         pop();
         push();
         translate(75, 75);
         rotate(radians(rot));
         line(0, 0, 26.5, 26.5);
         pop();
         push();
         translate(325, 225);
         rotate(radians(rot));
         line(0, 0, 26.5, 26.5);
         pop();
         push();
         translate(325, 75);
         rotate(radians(rot));
         line(0, 0, 26.5, 26.5);
         pop();

         rot = rot += 2;

    }
    else {
        background(220);
        lineSpread(400, 0, 0, 400, 10, 0, 0);
        lineSpread(0, 300, 0, 400, 10, 0, 0);
        lineSpread(0, 0, 0, 400, 10, 0, 0);
        fill(220);
        rect(300, 20, 80, 80);
        circle(75, 225, 75);
    }

    
}

function lineSpread(x1, y1, startDegree, endDegree, lineSpace, sXNum, sYNum){
    if (sXNum == 0 & sYNum == 0){
    for (var degree = startDegree; degree <= endDegree; degree += lineSpace){
        line(x1, y1, degree, degree);
    }
    }
    else if (sXNum > 0) {
    for (var degree = startDegree; degree <= endDegree; degree += lineSpace){
        line(x1, y1, sXNum, degree);
    }
    }
    else if (sYNum > 0) {
    for (var degree = startDegree; degree <= endDegree; degree += lineSpace){
        line(x1, y1, degree, sYNum);
    }
}

}

I initially tried to do something more complex, but I settled for simpler things. I had fun writing the Function I used.

String Art

class= “p5-embed” data-width = “400” data-height= “300” href= “https://courses.ideate.cmu.edu/15-104/f2021/wp-content/uploads/2021/09/sketch-180.js”>sketchDownload

I really struggled with this project because I couldn’t visually where would the lines be drawn thus I used very simple drawing tactics to create overlapping rhombuses to create a star with CMU’s plaid effect.

Project 04: String Art

sketch

// John Henley; jhenley; 15-104 section D

// Initiate variables
var dx1;
var dy1;
var dx2;
var dy2;
var dx3;
var dy3;
var dx4;
var dy4;
var numLines = 50;

function setup() {
    createCanvas(400, 400);
}

function draw() {
    // Set colors
    background(0);
    stroke(255, 255, 255);

    // First set (bottom left)
    dx1 = 0/numLines;
    dy1 = (-mouseY)/numLines;
    dx2 = mouseX/numLines;
    dy2 = 0/numLines;
    var x1 = 0;
    var y1 = 400;
    var x2 = 400;
    var y2 = 0;
    for (var i = 0; i <= numLines; i += 1) {
        line(x1, y1, x2, y2);
        x1 += dx1;
        y1 += dy1;
        x2 += dx2;
        y2 += dy2;
    }

    // Second set (top right)
    dx3 = 400/numLines;
    dy3 = mouseY/numLines;
    dx4 = mouseX/numLines;
    dy4 = 400/numLines;
    var x3 = 0;
    var y3 = 0;
    var x4 = 400;
    var y4 = 400;
    for (var i = 0; i <= numLines; i += 1) {
        line(x3, y3, x4, y4);
        x3 += dx3;
        y3 += dy3;
        x4 += dx4;
        y4 += dy4;
    }
    line(0, 0, 400, mouseY);

    // Third set (middle)
    dx3 = 400/numLines;
    dy3 = mouseY/numLines;
    dx4 = mouseX/numLines;
    dy4 = 400/numLines;
    var x3 = 0;
    var y3 = 0;
    var x4 = 400;
    var y4 = 400;
    for (var i = 0; i <= numLines; i += 1) {
        line(x3, y3, x4, y4);
        x3 += dx3;
        y3 += dy3;
        x4 += dx4;
        y4 += dy4;
    }

    dx3 = mouseX/numLines;
    dy3 = 100/numLines;
    dx4 = 100/numLines;
    dy4 = 0/numLines;
    var x3 = 50;
    var y3 = 400;
    var x4 = 350;
    var y4 = 0;
    for (var i = 0; i <= numLines; i += 1) {
        line(x3, y3, x4, y4);
        x3 -= dx3;
        y3 += dy3;
        x4 -= dx4;
        y4 -= dy4;
    }

}

I wanted to make an interactive piece with lines that crossed and span the canvas, transforming based on the position of the mouse.

Project4: String Art

string art
function setup() {
    createCanvas(300, 400);
    background(220);
    text("p5.js vers 0.9.0 test.", 10, 15);
    rectMode(CENTER)
}
function draw() {
    background(40,30,60);
    stroke(150, 160, 255);
    for (var x = 0; x <= 50; x += 1) {
        line(300, 50, 300/50 * x - 3, 0); //right upwards lines
    }
    for (var x = 20; x <= 80; x += 1) {
        line(300, 50, 300/40 * x, 400); //right downwards lines
    }
    for (var x = 0; x <= 30; x += 1) {
        line(0, 350, 300/60 * x, 0); //left upwards lines
    }
    for (var x = 0; x <= 30; x += 1) {
        line(0, 350, 300/30 * x, 400); //left downwards lines
    }

//spiraling lines (very short)
    var angle = 70
    var angle2 = 50
    var x = 30
    var y = 50
    translate(150,200) //origin = center
    push();
    for (y = 50; y <= 300; y += .7){
        rotate (radians(angle));
        stroke (180, 168, 218);
        line (30, y, x+2, y);
    }
    pop();
//spiraling lines (short)
    push();
    for (x = 30; x <= 400; x += .8){
        rotate (radians(angle2));
        stroke (190, 210, 240);
        line (x-25, x-40, x-40, 0.8*40);
    }
    pop();
//black hole in the middle
    push();
    stroke(30,10,70)
    strokeWeight(3)
    fill(0)
    circle(0,0,30) 
    pop();
}
    

I drew star trails with a black hole in the middle.