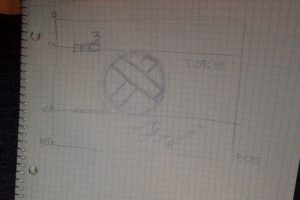
//Janet Lee
//Section C
//janetl2@andrew.cmu.edu
//Project 07
var points = 70;
function setup() {
createCanvas(400, 400);
strokeWeight(2);
//stroke("#F1CDD4");//baby pink
frameRate (30);
}
function draw() {
background ("#CDE7EE");//baby blue
push();
translate (width/2,height/2);
drawHeart();
pop();
function drawHeart () {
var a = map(mouseX,0,width,25,75);
var b = map(mouseY,0,height,0,100);
//heart becomes bigger and wider
beginShape()
//base shape: heart
for (var i = 0; i < points; i ++ ) {
var t= map(i,0,points,0,70);//hearts made out of lines
x = a* sin(t)*sin(t)*sin(t);
y = b*cos(t)-a*cos(2*t)-2*cos(b*t)-cos(a*t);
fill("#F1CDD4");//baby pink
strokeWeight(2);
vertex(-x,-y);//make the heart upright
}
endShape(CLOSE);
}
}
Category: Uncategorized
Janet Lee – Looking Outwards – 07
Knowing about the creation of the stars and the universe is interesting to people but it grabs more attention when those are transformed into sounds, images, and vibrations. Ryoichi Kurokawa artistically showed the evolution of the galaxy and the stars by only focusing on sensorial and experiential. It grabs people’s attention because they can experience inception and how this whole universe was created. This project mainly uses sound, movement, and light to realistically portray what could possibly happen in the galaxy. Ryoichi had access to data to the secrets of the creation of the universe. Ryoichi gave the viewers enlightenment and delight by beautifully visualizing the galaxy through a screen.
Molecular clouds in space – Ryoichi Kurokawa’s ‘unfold’ at FACT
Kyle Lee Looking Outward 07
I found this infographic in Wired Magazine while I was in a waiting room at health services. Unfortunately this picture was the only documentation I was able to capture as I was unable to access the article later online. But this article by Seth Kadish, a data scientist at Chegg, discusses increasing traffic in the Bay Area, particularly along 101, the highway connecting San Francisco to San Jose.
I was originally drawn to this infographic since I’ve been a resident of the Bay Area my whole life, and live in Menlo Park, just about in the middle of 101. Needless to say that I have much first hand experience with the ridiculousness that is rush hour traffic in Silicon Valley.
I really like how dynamic this infographic is using the amount of color to show increasing idle traffic time over the years. It is certainly an unexpected representation of time. Although I admire how different this piece is, I did find it difficult at first to understand its representation. Its unusual depiction presents both things I like and don’t like.
I was unable to find how this information was collected. Furthermore, I wish there was more information on the impact of this increased traffic. So commutes are getting longer; so what? I think a few more statistics on how this traffic has impacted people or businesses would have made the article stronger. Maybe how much accumulated time per year does a person waste? or how much money do employees or companies waste from people losing time in traffic?
James Katungyi – Project 06 – Abstract Clock
Abstract Clock
jameskatungyi-project06-abstractclock
//James Katungyi
//Section A 0900
//jkatungy@andrew.cmu.edu
//Assignment-Project-06
function setup(){
createCanvas(300,300);
}
function draw(){
background(227,218,186);
stroke(208,169,97);
strokeWeight(1);
HourBar();//hour bar function
MinuteLine();//minute line function
SecondBall();//second ball function
}
function HourBar(){
var BarH = height/24;
var H = hour(); //link to computer clock hour
var M = minute();//link to computer clock minutes
var HBarX = map(M,0,59,0,width);//link x position to minute
var HBarY = map(H,0,23,0,height);//link Y position to hour
stroke(208,169,97);
if ((HBarY > height*6/24) & (HBarY < height*18/24)){//fill color bar with light color from 6am to 6pm
fill(245);
} else {
fill(180);//otherwise make hour bar dark
}
rect(0,HBarY,HBarX,BarH);//hour bar
for (var y = 0; y < HBarY; y += 12.5){
if ((y > height*6/24) & (y < height*18/24)){//fill bars with light shade from 6am to 6pm
fill(245);
} else {
fill(180);
}
rect(0,y,width-1,BarH);
}
}
function MinuteLine(){
var M = minute();//computer clock minute
var S = second(); //computer clock seconds
var LineY = map(S,0,59,0,height);//link x position to seconds
var LineX = map(M,0,59,0,width);//link x position to minutes
stroke(208,169,97);
strokeWeight(1);
line(LineX,0,LineX,LineY);//minute line
for (var x = 0; x < LineX; x += 5){
line(x, 0, x, height);
}
}
function SecondBall(){
var diam = 20;
var S = second();//computer clock seconds
var M = minute();
var BallX = map(S, 0, 59, 0, width); //link seconds to x position of the ball
var BallY = map(M, 0, 59, 0, height); //link ball position of y to minutes
stroke(208,169,97);
strokeWeight(1);
if ((BallY > height*7/24) & (BallY < height*19/24)){//fill ball with dark shade from 6am to 6pm
fill(180);
} else {
fill(245);
}
ellipseMode(CENTER);
ellipse(BallX,BallY,diam,diam); //draw ball
}
As the hours and minutes build up, the canvas fills with boxes and lines. Each day is a fresh start on a clean slate. Each hour starts out less clattered than towards its close.
The seconds are marked by a ball which was supposed to bounce off the sides evoking the ‘tick-tock’ associated with clocks. However, the reverse direction did not work out. In a way, the single direction is better because each second is fresh, not recycled.
The hours relate to the minutes in that one can tell the hour and minute by just looking at the hour indicator. The same with the minutes and seconds. And ofcourse one can tell the night hours from the day hours – a feature that is perhaps only useful in casinos where one never sees the sky.
Project 06 – Abstract Clock
Abstract Clock
jameskatungyi-project06-abstractclock
As the hours and minutes build up, the canvas fills with boxes and lines. Each day is a fresh start on a clean slate. Each hour starts out less clattered than towards its close.
The seconds are marked by a ball which was supposed to bounce off the sides evoking the ‘tick-tock’ associated with clocks. However, the reverse direction did not work out. In a way, the single direction is better because each second is fresh, not recycled.
The hours relate to the minutes in that one can tell the hour and minute by just looking at the hour indicator. The same with the minutes and seconds. And ofcourse one can tell the night hours from the day hours – a feature that is perhaps only useful in casinos where one never sees the sky.
mreyes-Jean Tinguely
Jean Tinguely‘s Drawing Machines
Various Kinetic Sculptures
Jean Tinguely was an artist working in the 50s and 60s who became famous for his playful kinetic sculptures. Some of his more interesting works were actually drawing machines witch produced semi random images that were drawn from machines and not people. These drawings were of course abstract and somewhat crude but had a certain rhythm to them because of the machines limited movement ability. When viewing his work people often comment on the juxtaposition of using a machine (witch is often associated with precision) to create these un-precise images.
LookingOutwards-Randomness-sehenry
While searching through different forms of random art, I happened to stumble upon one that peaked my interest. I always believed that random art could mean something to someone and mean something different to a different person. So when I was browsing through all the neat and wonderful art that was generated through the theme of randomness, I was impressed to say the least. The one that I found and was really interested by is called Tsunami by Hailei Wang. She talks about how she uses python to create her artwork and just looking through her different pieces of art makes me want to be more expressive and more random and less “planned out” in certain circumstances.
Painting :Tsunami
Artist: Hailei Wang
Project 06 – Abstract Clock-sehenry
For this project, a ton of ideas came to my mind but one of them stuck. The idea that a shape could increase in increments as a representation of seconds intrigued me. I then just played around with how I wanted the hour and minute things to go. I started sketching what it could look like and realized that the other two sets of time would be relatively easy to make. I love the way the clock turned out. I used the normal settings of my normal clock for this one as well so it took less time than I originally thought.
//Seth Henry
//Tuesdays at 10:30
//sehenry@andrew.cmu.edu
//Abstract Clock Project 6
//Global Variables
var sCount = 0
var mCount = 0
var hCount = 0
function setup() {
createCanvas(500, 500);
}
function draw() {
var centerX = width/2 //center w
var centerY = height/2 //center h
var s = second(); //second
var h = hour()%12; //24hrs/2
var m = minute(); //minutes
background(100,100,s*2); //changes color as time goes on.
push();
for(sCount=0;sCount<=s;sCount+=1){ //counts seconds
var secondPos = sCount*6
}
fill(20,secondPos,secondPos); //different colors as different seconds appear.
ellipse(centerX,centerY,secondPos,secondPos); //circle that increases until it reaches 60 seconds
translate(centerX,centerY); //translates the origin to (0,0)
rotate(millis()/800); //Random rotation of rectangles
rectMode(CENTER);
fill(100,100,secondPos);
rect(0,0,secondPos,50); //inside rectangle
push();
fill(100,secondPos-60,100);
rotate(millis()/900); //rotate slower than first rectangle
rectMode(CENTER);
rect(0,0,secondPos,50); //Second rectangle inside ellipse
pop();
pop();
line(0,70,500,70); //upper boundary for circle and line for hour representation
line(0,430,500,430);//lower boundary for circle and line for minute representation
strokeWeight(2);
for(mCount=0;mCount<m;mCount+=1){ //counts minutes
var minutePos = mCount*6
fill(minutePos,secondPos,secondPos);
ellipse(minutePos+76.5,430,5,5);
}
push();
for(hCount=0;hCount<h+1;hCount+=1){ //counts hours
var hourPos = hCount*32.5+65
strokeWeight(3);
rectMode(CENTER);
rect(hourPos,70,28,28)
}
pop();
textSize(30) //text for hours
textAlign(CENTER);
var htext=hour()%12;
text(htext,hourPos,120);
textSize(15) //text for minutes
textAlign(CENTER);
var mtext=minute();
text(mtext,minutePos+76.5,425);
}
ShanWang-Project06-Abstract Clock
//Shan Wang
//Section A
//shanw1@andrew.cmu.edu
//Assignment-06-Project
function setup() {
createCanvas(600,600);
}
function draw() {
background('#E79460')
var cX = width/2;
var cY = height/2;
var lX = width/2;
var lY = height/2;
var rX = width/2;
var rY = height/2;
var sX = width/2-40;
var sY = height/2+70;
var sec = second();
var min = minute();
var hr = hour()+10;
//set intervals for different planes;
var intT = 1;
var intL = 5;
var intR = 8;
var intS = 0.7;
//set alpha value variable
var alphaV = 0;
//draw base plane (black) with no outlines;
topPlane(width*2/3-50,height*3/4,90,100,"black",false);
leftPlane(width*2/3-50,height*3/4,90,5,'#FFB11B',false);
rightPlane(width*2/3-50,height*3/4,5,100,'#FFC408',false);
//draw top planes that increment every second; resets after a cycle of 60
for (var i=0; i<sec; i++){
topPlane(cX,cY,40,intT,'#985F2A',false)
cX = cX + intT/cos(45);
cY = cY - intT/cos(45);
}
//draw left planes that increment every minute; resets after a cycle of 60
for (var i=0; i<min; i++){
leftPlane(lX,lY,40,intL,"white",false);
lY += intL;
}
//draw right planes that increment every hour; resets after a cycle of 24
var len = dist(width/2,height/2,cX,cY);
for (var i=0; i<hr; i++){
rightPlane(rX+4, rY+8,intR,60,"red",false);
rY += intR;
}
//draw edge planes that compose the three dimensional image
leftPlane(width/2+4,height/2+8,2,intR*hr,25,false);
topPlane(width/2+4,height/2+8,2,60,200,false);
rightPlane(width/2,height/2,7,intT*sec,55,false);
//draw side planes that increments every second; resets after a cycle of 60
for (var i=0; i<sec; i++){
var dis = min*intL-107;
rightPlane(sX,sY,dis,intS,'#005CAF',false);
sX -= intS/cos(45);
sY += intS/cos(45);
}
//draw side plane Edge
var edgeLen2 = intS*sec;
topPlane(sX+intS/cos(45),sY-intS/cos(45),2,edgeLen2,45,false);
leftPlane(sX+intS/cos(45), sY-intS/cos(45),2,dis,"black");
//dim the background every second;
alphaV += sec%59 * 3;
noStroke();
fill(0,0,0,alphaV);
rect(0,0,width,height);
}
function topPlane (cX, cY, side1, side2, color,outline){
var p1X = cX - side1/cos(45);
var p1Y = cY - side1/cos(45);
var p2X = p1X + side2/cos(45);
var p2Y = p1Y - side2/cos(45);
var p3X = cX + side2/cos(45);
var p3Y = cY - side2/cos(45);
fill(color);
if (outline == false){
noStroke();
quad(cX, cY, p1X, p1Y, p2X, p2Y,p3X, p3Y);
}
else{
stroke(0);
quad(cX, cY, p1X, p1Y, p2X, p2Y,p3X, p3Y);
}
}
function leftPlane (cX, cY, side1, side2,color,outline){
var p1X = cX;
var p1Y = cY + side2;
var p2X = p1X - side1/cos(45);
var p2Y = p1Y - side1/cos(45);
var p3X = cX - side1/cos(45);
var p3Y = cY - side1/cos(45);
fill(color);
if (outline == false){
noStroke();
quad(cX, cY, p1X, p1Y, p2X, p2Y,p3X, p3Y);
}
else{
stroke(0);
quad(cX, cY, p1X, p1Y, p2X, p2Y,p3X, p3Y);
}
}
function rightPlane (cX, cY, side1, side2, color,outline){
var p1X = cX;
var p1Y = cY + side1;
var p2X = p1X + side2/cos(45);
var p2Y = p1Y - side2/cos(45);
var p3X = cX + side2/cos(45);
var p3Y = cY - side2/cos(45);
fill(color);
if (outline == false){
noStroke();
quad(cX, cY, p1X, p1Y, p2X, p2Y,p3X, p3Y);
}
else{
stroke(0);
quad(cX, cY, p1X, p1Y, p2X, p2Y,p3X, p3Y);
}
}
The inspiration for the visual style of this project came from the drawings of Theo Van Doesburg, a De Stijl artist during the 1900s.
I am interested in the idea of representing the change of time with the change of space. By extending the length size of the planes, the spatial quality of the representation changes throughout the day.
Also for legibility, I set the cycle of the dimming of the background color to be every minute.
Charlie Mo abstract clock
var r= 230;
var g= 250;
var b= 250;
function setup() {
createCanvas(600, 600);
//background(r, g, b);
}
function draw() {
background(r, g, b,20);
angleMode(DEGREES);
//hours
push();
rectMode(CENTER);
var h = hour();
translate(width/2,height/2);
rotate(h*30-180);
noFill();
rect(0,0,400,400);
rect(0,0,1,500);
pop();
//seconds
push();
var s = second();
translate(width/2,height/2);
rotate(s*6-135);
fill(63, 12, 12);
noStroke();
ellipse(150,150,40,40);
ellipse(-150,-150,20,20);
pop();
//minutes
push();
var m = minute();
translate(width/2,height/2);
rotate(m*6-180);
head(0,0);
pop();
}
function head(x,y){
//head
noStroke();
fill(255, 235, 117);
ellipse(0,0,300,300);
//eyes
strokeWeight(1);
fill(255);
ellipse(-70,0,80,15);
ellipse(70,0,80,15);
noStroke();
fill(38, 20, 0);
ellipse(-70,0,15,15);
ellipse(70,0,15,15);
//ears
fill(255, 235, 117);
ellipse(-150,0,30,50);
ellipse(150,0,30,50);
ellipse(-150,20,50,60);
ellipse(150,20,50,60);
//studs
fill(0, 48, 46);
ellipse(-160,30,10,10);
ellipse(160,30,10,10);
//mouth
fill(145, 36, 36);
arc(0,40,30,30,0,180);
//dots
for(var x = 0; x<3; x++){
for(var y = 0; y<3; y++){
var x2 = -40 + x * 40;
var y2 = -110 + y * 40;
fill(255, 250, 147);
ellipse(x2,y2,20,20);
}
}
}