Simin Li – Looking Outwards 9

Syncro Mail by Lisa Jevbratt 2001
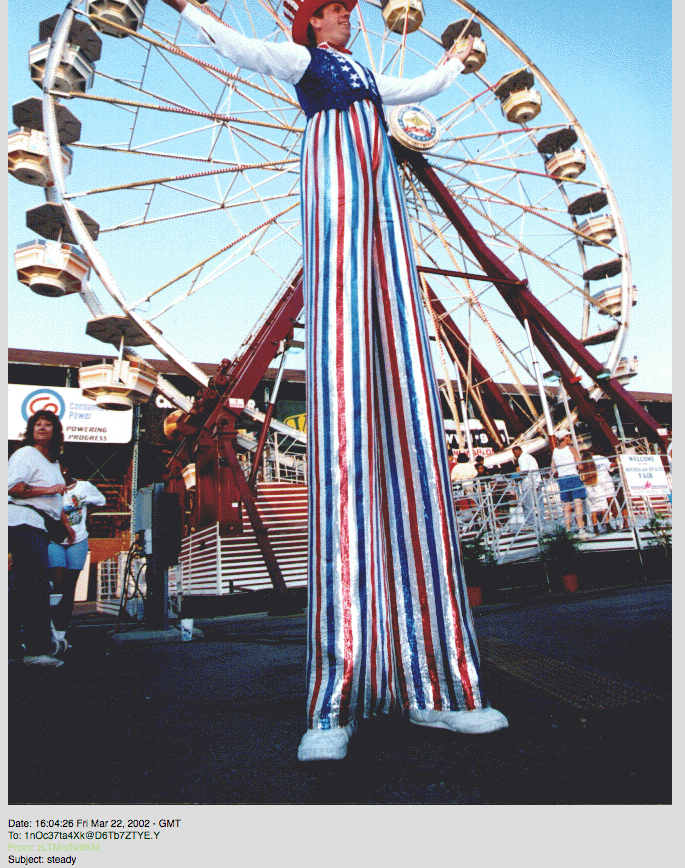
An image sent in 2002 labeled “Steady” in Syncro Mail

I thought the post MREYES-LOOKINGOUTWARDS-SYNCRO MAIL – UNCONSCIOUS COLLECTIVE by Mreyes posted in 2016 was interesting so I decided to look into this project. This website by Lisa Jevbratt sends a photo paired with a word to a user and documents the content of every sent email. Like the author, I also enjoyed seeing the interaction between people. Not only did this project show the relation between the sender and the receiver, but also the people who were being tied together through the same images.
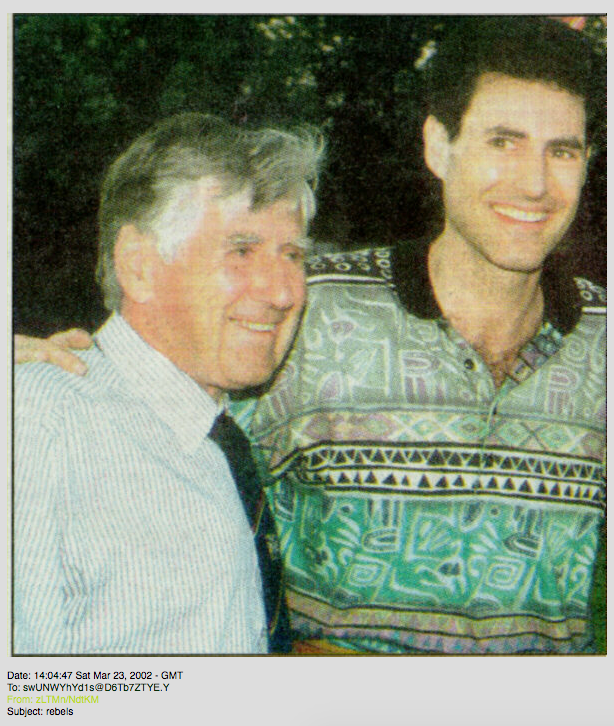
An image sent in 2002 labeled "Rebels" in Syncro Mail
An image sent in 2001 labeled “Rebels” in Syncro Mail
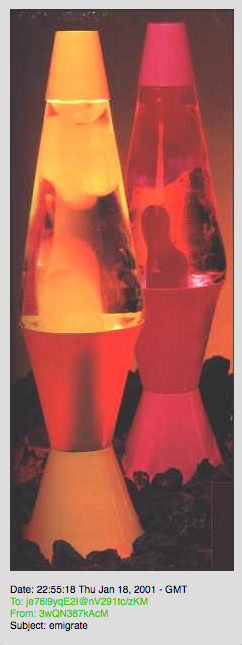
An image sent in 2002 labeled "Emigrate" in Syncro Mail
An image sent in 2001 labeled “Emigrate” in Syncro Mail

I think the author did a great job of explaining the possible underlying algorithms of the work, but to be more specific, each image is generated using the last 24 numbers of each user’s IP address. Unfortunately, the website is no longer running, but if it was, according to Mreyes’s assumption that the software randomly chooses images from Google and the fact that every two minutes, humans take more photos than ever existed in total 150 years ago, you would see the change of images on the web through the years. In this sense, this project is like a time capsule that adds something every day.

Mreyes was not sure of the artist’s intentions, but in my opinion, the artist is trying to make the point that many events are not causal, they are synchronistic, or coincidences in time which is a romantic thought.

Links:

mreyes-lookingOutwards-Syncro Mail – Unconscious Collective

Lisa Jevbratt Website

Syncro Mail – Unconscious Collective

Syncro Mail Website

RNAYYAR reflection: Mreyes- Looking Outwards 5//Sublime Moments

Original link to MREYES looking outwards post

Mercedes selected an Eyal Gever 3D media exhibition called “Sublime Moments” that debuted in 2014 at Frankfurt, Germany. According to his biography, Gever served in the Israeli defense forces as a computer graphics situation simulator. His occupation paved an artistic path for him in that he eventually developed his own software to use and expand upon.
In “Sublime Moments”, Gever uses his software to create ~~moments~~ of natural and man-made occurrences such as waves in the ocean coupled with a large purple sphere being popped and torn open.

This is a comprehensive link to Gever’s general work and exhibition

With these sections of moments, Gever compiles these compositions and sends them to the world’s largest 3D printer. To recreate something so detailed in digital and physical media is really unbelievable to me.

Mercedes talks about her opinion on Gever’s work and conceptual processes below

I admire this body of pieces because, I usually find hyperrealism (in both painting and sculpture) to be impressive but, ugly. However with Gever’s work I found his subject matter interesting as well as his execution and the forms he chooses to depict. The collection of pieces is enticing to look at as the forms suggest a movement but also give hint to a bigger motion yet to come. Gever Manages to capture the ominous potential along with a beauty and serenity of natural forms in a poetic juxtaposition.

I’m inclined to agree with her because I also find hyperrealism to be impressive but also somewhat grotesque. Gever capitalises on this ‘grotesqueness’ by incorporating a glossy and intricately surreal materiality to his pieces. This results in a very contemporary rendition of
what we are already naturally familiar with.

http://www.eyalgever.com/spherepop/  <– video of the sphere puncturing which serves as the starting point for Sphere Pop the sculpture.

Sphere Pop | 2014
Waterfall | 2014

sajohnso Looking Outwards 8

Kate Hollenbach is the creator of the interactive gestural software shown most famously in the movie “Minority Report”. She’s also the director of computation and design at Oblong Industries. She’s based out of Los Angeles, California. Her work ranges from quirky and entertaining to highly innovative. I most admire her groundbreaking “Mezzanine”, for example, uses can use a gestural interface to control content on multiple devices, because it is not only conceptually intriguing but also technologically relevant. In works such as “Substrate Grid” a user can point at colored squares to color them and make them spin. In her speech, she shows her fun, casual artistic aesthetic through her informal tone of speech and the visual effects on her video (such as a colored filter, increased speed or a blurred effect). Her clear speech and organization of her life story into easy-t0-comprehend sections are strategies I can adopt in my own work.

http://www.katehollenbach.com/

https://vimeo.com/channels/instint2014

Looking Outwards-08-sehenry

Eyeo 2013 – Memo Akten from Eyeo Festival // INSTINT on Vimeo.

Memo Akten Bio

Memo Akten is a visual artist, director, musician, and engineer which is probably why I admire his work a lot. He takes many aspects of what he is passionate about and illustrates it through his work. He has been involved in the video game industry as well as the music industry. One thing that shows how his wide variety of talents can combine together, is demonstrated by one of his projects called the Webcam Piano 2.0. In his lecture he talks about this project and if you look at it and listen, the Webcam piano really resembles a mixture of a video game and a music performance. He was born in Instanbul Turkey and has lived in London as well. Being in these different places surely shaped part of who he is today. I have a lot of family in England, and I have been there as well and I can tell you that it is a very artistic and expressive place. In his lecture he always tries to bring in his viewers by explaining each project in depth and you can see in his eyes how important these things are to him. He describes himself as someone who wants to illustrate Poetry of Reality and cross back and forth from reality and the digital. Memo takes different projects from other people whether it be musical or other, and recreates it digitally. This can be shown by his Simple Harmonic Function project. His background of being a civil engineer really allows him to tie together his artistic side with his digital experience. He has been involved in many other projects that I have not mentioned that are unparalleled by many projects I have seen from other artists. This is why I admire him. He strives to separate himself from the crowd to create his own brand and he loves doing it.

Isabella Hong – Looking Outwards – 08

https://vimeo.com/channels/eyeo2015

At Eyeo 2015, Samuel Sinyangwe and Deray McKesson spoke on the topic of racial justice and activism in addition to how they’ve utilized social media to spread awareness of what goes on in the news each day. For this post, I chose to focus on Singyangwe.

Samuel Sinyangwe (LinkedIn)

Samuel Sinyagwe in an American policy analyst and racial justice activist that currently resides in San Francisco, California. He is the co-founder of WetheProtestors, an organization that provide people with a platform to end police violence in their local communities. Sinyagwe studied racial intersections within the United States in the realms of politics, economics, and class. He describes himself as an activist that works with affected communities.

I admire Sinyagwe for his calm yet active approach to tackling the issue of racial injustice. He isn’t angrily aggressive, he’s actively progressive and constantly working to give people agency. He embraces the community and helps them initiate change.

Sinyagwe is an articulate and charismatic speaker that understands the power of employing a group for change. He shows the audience that there is evidence, real and tangible statistics of racial injustice, clearing the fog around where racial injustice is concentrated. It’s not – it’s everywhere and that’s why Sinyaqwe does what he does.

mreyes-project 07

sketch

//Mercedes Reys

//Section C 

//mreyes@andrew.cmu.edu

//project-06-a

var nPoints = 3000; // points in outer cricel drawing curve 

function setup() {
    frameRate(.0001)
    createCanvas(600, 600);
    frameRate(10);// slow down fram rate 
}


function draw() {
    background(255,200,200);

    drawEpitrochoid();//top curve
    push();
    translate(width / 2, height / 2);
    drawEpitrochoid();//middle curve 
    translate(width / 2, height / 2);// bottom cuve 
    drawEpitrochoid();
    pop();
}


function drawEpitrochoid() {
    noStroke()

    //variables 
    var x;
    var y;

    //noise
    var randomness = (mouseX/40)+1; // level of noise is depenant on mouseX
    var randomShift = random(0, randomness); 
     
    var a = 200.0; // diamater of original cirlce
    var b = a /3.0 + randomness/nPoints;// diamater of circles added to original circle
    var h = constrain(randomShift/ .3, 0, b);// grow when mouse is moved to the right
    var ph = randomShift/30.0; // devide by random to reduce jerky-ness of movement

    fill(200, 255, 200,150);
    beginShape();
    for (var i = 0; i < nPoints; i++) {
        var t = map(i, 0, nPoints*random(-randomness, randomness), 0, TWO_PI);// map out nPoints to cirlce and a
        
        //calculate vertex 
        x = (a + b) * cos(t) - h * cos(ph + t * (a + b) / b);
        y = (a + b) * sin(t) - h * sin(ph + t * (a + b) / b);
        vertex(x, y);
    }
    endShape(CLOSE);

    push();
    
}

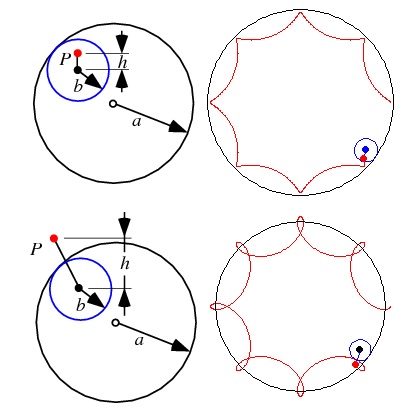
The epitrochoid curve was the only curve I could manage to understand how to make, so I started off by recreating the curve made in the example. I then wanted to make the curve grow in an more organic way. So I created a noise variable and applied that to the constraint. It wasn’t vary dynamic at that point so I experimented with adding the noise to diffrent variables and this was the result.


jihoonp_project_07

sketch

//Jihoon Park
//section A
//jihoonp@andrew.cmu.edu
//project-07

var nPoints = 100;
var divider;					//number of points in hypotrochoid

function setup() {
	createCanvas(600,600);
	frameRate(10);
}

function draw() {
	background(0);

	for(var i=0; i<10; i++) {		//loops the Hypotrochoid with 30 pixel space
		var col = map(i, 0, 10, 0, 255); //color map
		stroke(col);
		noFill();				//inner geometry fades
		Hypo(i*30, mouseX/50);		//changes the number of points according to mouse X
	}
}

function Hypo(a, divider) {
	var x;
	var y; 

	var a;									//radius of circumscribed circle
	var b=a/divider;						//radius of inscribed circle
	var h = constrain(mouseY/10, 0, a);		//length of rotating point generator
	var ph = mouseX/50;						//rotation of hypotrochoid
	push();									//moves the origin of hypotrochoid to center
	translate(width/2, height/2);
	beginShape();
	for(var i=0; i<nPoints; i++) {
		var t = map(i, 0, nPoints, 0, TWO_PI);
		x=(a-b)*cos(t) + h*cos(ph+t*(a-b)/b);
		y=(a-b)*sin(t) - h*sin(ph+t*(a-b)/b);
		vertex(x, y);	
	}
	endShape(CLOSE);
	pop();
}

In this project I made a function called Hypo, which is a short term I gave for hypotrochoid. This geometry has 3 variables which are the radius of circumscribed circle, inner orbiting circle and the length of the line which is rotated from the center of orbiting circle. I made all of the variables modifiable according to the x and y position of the mouse, then looped the geometry to form an overlap.
hypotrochoid

GarrettRauck-Project-07

sketch

//Garrett Rauck
//Section C
//grauck@andrew.cmu.edu
//Assignment-07-Project-Composition with Curves

/////////////////////////////////
// DECLARE VARIABLES
/////////////////////////////////
//canvas vars
var canvasWidth, canvasHeight, nRows, nCols, cellSizeX, cellSizeY;
//event vars
var mx, my; //constrained mouseX and mouseY
//curve vars
var nPts, scaleFactor, falloffFactor;
//color

/////////////////////////////////
// HELPER FNS
/////////////////////////////////
function drawConchoidOfDeSluzeCurve(cx, cy, a) {
	//Conchoid of de Sluze
	//http://mathworld.wolfram.com/ConchoidofdeSluze.html

	var x, y;

	var scaleFactor = map(my, 0, canvasHeight, 1, 10);

	noFill();
	stroke(255);
	beginShape();
	for (var i = 0; i < nPts; i++) {
		var t = map(i, 0, nPts, 0, TWO_PI);
		// compute raw curve vals
		x = (1/cos(t) + a*cos(t)) * cos(t); // x = (sec t + a cos t) cos t
		y = (1/cos(t) + a*cos(t)) * sin(t); // x = (sec t + a cos t) sin t
		// scale vals
		x *= scaleFactor;
		y *= scaleFactor;
		// position in canvas
		x += cx;
		y += cy;
		// create vertex
		vertex(x, y);
	}
	endShape();
}

/////////////////////////////////
// EVENTS
/////////////////////////////////

/////////////////////////////////
// RUN!
/////////////////////////////////
function setup() {
	// INIT VARS
	nPts = 75;
	falloffFactor = 0.6;
	//canvas
	canvasWidth = canvasHeight = 640;
	nRows = 4;
	nCols = 4;
	cellSizeX = canvasWidth/nCols;
	cellSizeY = canvasHeight/nRows;

	// CANVAS SETUP
    createCanvas(canvasWidth, canvasHeight);
}

function draw() {
	background(0); //update background

	//constrain mouse position to canvas
	mx = constrain(mouseX, 0, canvasWidth);
	my = constrain(mouseY, 0, canvasHeight);
	//get a value of outer-most curve
	var aMax = map(mx, 0, canvasWidth, -50, 50);

	//create grid
	for (row = 0; row < nRows; row++) {
		for (col = 0; col < nCols; col++) {
			var cx = col*cellSizeX + cellSizeX/2;
			var cy = row*cellSizeY + cellSizeY/2;
			//create nested Conchoid of de Sluze curves at grid pt
			for (a = aMax; abs(a) > 1; a *= falloffFactor) {
				//draw curve centered at pt
				drawConchoidOfDeSluzeCurve(cx, cy, a);
	        }
		}
	}
	
}

I chose one of the curves off of the Wolfram web site and used the mouse position to manipulate the scale of the curve and the order, or “a” variable, of the curve. For loops is are used to create the nested curves of different orders, as well as to create the overall array of curves for the composition.

Looking Outwards-07- Information Visualization-sehenry

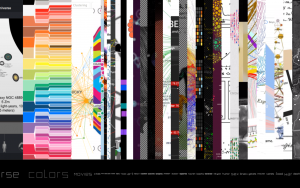
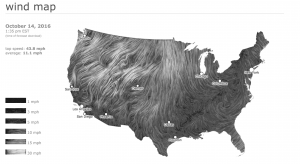
The project that I chose was an interactive program that allows you to pick personal sources of information based on what you are interested in. So for me, I browsed through their choices and found a category called Life, The Universe, and Everything. Within the category, I chose weather and it relocated me to a weather map showing where wind, all over the country, is headed, in an interactive artistic weather map. Small white/grayish lines would follow a path deduced by the internet in multiple places, all over the U.S. The real art comes from the template where you are allowed to choose which subject to learn about. As your mouse travels around the screen different portions of the screen grow, shrink, and shift. The site kind of looks like a bookshelf full of album covers that you can flip through.That is why I like it. It looks very similar to something we know but is too abstract to label it as such.
Moebio Labs is a team of data scientists, developers, and designers and they work on projects that tie together large amounts of usable information.
Category Selection
moebio

Wind Map
moebio-2

Creator: Moebio
Website: Moebio.com

Assignment-07-C Epicycloid Evolute-sehenry

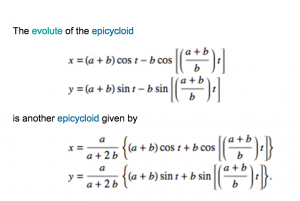
Working on this was a bit tricky, but once I understood the concepts and structure behind making these shapes, it became easier. The hardest part for me was using the equations from the website and implementing it into my code. I had to browse through a few posts of other students to get a rough idea of what to do. From the start I wanted to do an epicycloid evolute because it looked really appealing and looked similar to a flower.

epicycloid-evolute-screenshot

sketch

//Seth Henry

//Tuesdays at 10:30

//sehenry@andrew.cmu.edu

//Assignment: Project 7 Composition with Curves (Epicycloid Evolute)


//Global Variables
var nPoints = 400;
var conX;
var scale;
var n=10


function setup() {
    createCanvas(400, 400);
    }


function draw() {
    background(100,50,mouseX); //changes background color based on the mouse position
    fill(mouseX,100,mouseY); //changes the epicycloid color based on the mouse position
    var a = 150.0 //radius a
    var b = 50.0 //radius b
    var angle = map(conX,0,width,0,6*TWO_PI); //rotate around the constraint (conX)
    conX = constrain(mouseX, 0, width); //constrain around mouseX and mouseY
    scaleA = map(conX,0,width,0,3);
    

    push();
    translate(width/2,height/2);
    rotate(angle); //rotate clockwise
    scale(scaleA,scaleA); //change the size of the epicycloid outer portion
    beginShape();

    //Epicycloid Outer
    for (var i=0; i<200; i++){ 
        var theta = map(i,0,nPoints,0, 4*TWO_PI);
        x=(a/(a+2*b))*(a+b)*cos(theta)+b*cos(((a+b)/b)*theta); //xpetal of epicycloid
        y=(a/(a+2*b))*(a+b)*sin(theta)+b*sin(((a+b)/b)*theta); //ypetal of epicycloid
        rect(x-5,y-5,30,30);
    }
    endShape();
    pop();


    push();
    translate(width/2,height/2);
    rotate(-angle); //rotate the opposite way of the outer epicycloid
    beginShape();
    //No Rotate
    //Epicycloid Inner
    for (var i=0; i<200; i++){
        var theta = map(i,0,nPoints,0, 4*TWO_PI); 
        x=(a/(a+2*b))*(a+b)*cos(theta)+b*cos(((a+b)/b)*theta); //xpetal of epicycloid
        y=(a/(a+2*b))*(a+b)*sin(theta)+b*sin(((a+b)/b)*theta); //ypetal of epicycloid
        rect(x-5,y-5,30,30);
    }
    endShape();
    pop();

    push();
    translate(width/2,height/2);
    rotate(angle); //rotate same direction of epicycloid
   
    beginShape(); //The evolute portion of the flower

        for (var i=0; i<200; i++){
        a=100;
        var theta = map(i,0,nPoints,0, 5*TWO_PI);
        var petalX = a * (((n-1)*cos(theta)+cos((n-1)*theta))/n) //Xpetal of evolute
        var petalY = a * (((n-1)*sin(theta)+sin((n-1)*theta))/n) //ypetal of evolute
       rect(petalX-5,petalY-5,30,30); //draws the inside petals  
}
    endShape();
    pop();


}