akluk – Section A – Looking outwards-07


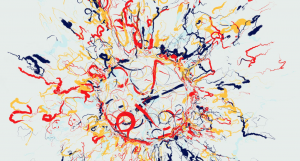
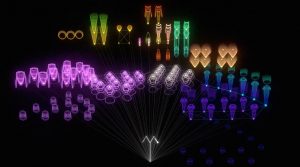
A still of what the animation looks like.
For this week the project that I have chosen to explore is a project called “The creatures of Prometheus” by Simon Russell which was created this year.


Demonstration of the animation

What I found interesting about this project is the fact that it utilizes both visual and audio data to convert into a beautiful animation. What is interesting is that the artist usually hand animates his own animations, but for this project, he simply created a self generative algorithm and plugged in the data, and the animations were as vivid and fluid as it is. While I do not know what exactly the algorithm that was used to generate this animation. It seems to utilize not only the current audio/visual data presented but also calculates and incorporates the rate at which the audio and visual data is changing to create a more natural and organic waves. What I most like about his style which is also present in this project is the use of more vibrant and neon colors, which the lines looking like electrical pulses and waves. It gives a very futuristic and sci-fi nature to his artwork. Below is the link to the project.
The Creatures of Prometheus

akluk-Project-07-curves

sketch

//Alvin Luk
//Section A
//akluk@andrew.cmu.edu
//Project-07


var nPoints = 200;
var edges = 2;


function setup() {
    createCanvas(400, 400);
    frameRate(10);
}


function draw() {
    background(255);
    // draw the frame
    fill(0); 
    noStroke();
    stroke(0);
    noFill(); 
    rect(0, 0, width-1, height-1); 
    
    // draw the curve
    push();
    translate(width / 2, height / 2);
    drawCurve(edges);
    pop();
}

//--------------------------------------------------
function drawCurve() {
    // Hypotrochoid
    // http://mathworld.wolfram.com/Hypotrochoid.html
    // draws multiple hypotrochoid with differeing h's
    for (var j = 0; j < 30; j++){
    var x;
    var y;
    
    var a = map(mouseX,0,width,0,200);
    var b = a/edges;
    var h = map(mouseY,0,height,0,4*j);
    //changes color gradient depending on which hypotrochoid currently at
    //and also the position of mouseX and mouseY
    var red = map(j,0,30,0,255);
    var green = map(mouseX,0,width,0,255);
    var blue = map(mouseY,0,height,0,255);
    stroke(color(red,green,blue));

    //draws single hypotrochoid
 	noFill();
    beginShape();
    for (var i = 0; i < nPoints; i++) {
        var t = map(i, 0, nPoints, 0, TWO_PI);
        
        x = (a - b) * cos(t) + h* cos(t * (a - b) / b);
        y = (a - b) * sin(t) - h * sin(t * (a - b) / b);
        vertex(x, y);
    }
    endShape(CLOSE);
	}	


}

//adds number of edges/ corners each time the mouse is pressed
function mousePressed() {
    edges +=1
    if (edges > 7){
    	edges = 2;
    }
}
//--------------------------------------------------

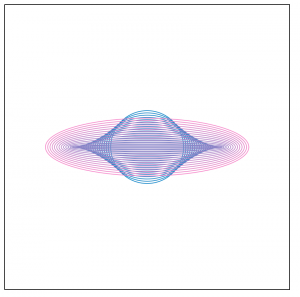
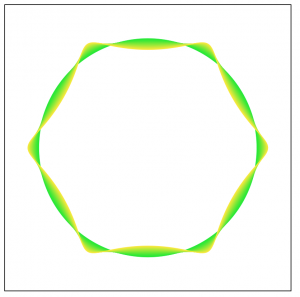
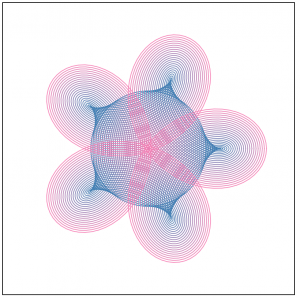
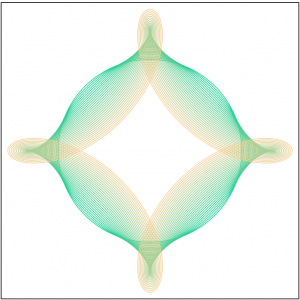
For this project. I first followed the guidelines provided in the assignments and chose a graph from the mathworks curves section. I chose the Hypotrochoid, since there was a lot of variables in the parametric equations of the curves that I could play with that enabled me to create varying versions and variations of the curve. I also thought that just one hypotrochoid seems kind of static. So I decided to use a for loop to generate numerous hypotrochoid super imposed on each other with a changed parameters. I also made it so the color changes based on the position of x and y. Clicking also changes the ratio of a and b creating new different classes of hypotrochoid. Below are some screenshots of what my program creates.

akluk – Section A – Looking outwards-06

For this week, the project that I have chosen to write about is Matt Deslauriers experimentation and project on generative art with node.js and canvas, from May 11th, 2016. What his program does basically, similar to some projects we do, is on a mouse press the canvas will use a new random set of values and parameters to create a new and random art work. What really intrigues me about this project is how even though the art is created through random algorithms, it still has structure and a sense of flow and ebb to it. It has patterns and colors unique to each one. The creator has a series of different palettes and the randomizer will choose one of them. It feels very organic and life like where the art just kinda grows out of the canvas. The random and unstructured splashes of colors also reminds me of Jackson Pollock’s painting. Below is a Link:
https://mattdesl.svbtle.com/generative-art-with-nodejs-and-canvas

Project-06-Abstract-Clock-akluk

sketch

//akluk

var com = true;
//--------------------------
function setup() {
    createCanvas(360, 360);
    background(0);
}

//--------------------------
function draw() {
    noStroke();
    //Generates space background
    if (com){
    	background(0);
    	for (var j = 0; j < 300; j++){
    		var x = random(0,360);
    		var y = random(0,360);
    		fill(255);
    		ellipse(x,y,2,2);
    	}
    	com = false;
    }

    //Clear path
    fill(0);
   	rect(0,height-50,width,50);

    // Fetch the current time
    var H = hour();
    var M = minute();
    var S = second();
    
    var mappedS = map(S, 0,59, 0,360);

    //initializes light spacing and length at equator
    var div = 216/24;
    var seg = div - 4;

    var cut_start = width/2-109;
    var cut_end = width/2+109;
    fill(120);
    //The actual Deathstar
    ellipse(width/2,height/2, 220,220);
    fill(80);

    //Disc
    ellipse(width/2-40,height/2-35,55,55);
    fill(60);

    //Cannon
    ellipse(width/2-43,height/2-38,15,15);
    fill(0);
    ellipse(width/2-43,height/2-38,4,4);
    noFill();
    strokeWeight(2);
    stroke(color(60,255,28));
    //Charge Ring 1
    arc(width/2-40,height/2-35,53,53,0,radians(mappedS));
    
    if (S == 59){
    	line(width/2-43,height/2-38, width/2-40,height/2-61.5);
    	line(width/2-43,height/2-38, width/2-13.5,height/2-35);
    	line(width/2-43,height/2-38, width/2-66.5,height/2-35);
    	line(width/2-43,height/2-38, width/2-40,height/2-8.5);
    	strokeWeight(5);
    	line(width/2-43,height/2-38,0,0);
    	com = true;
    }

    //Star Destroyer
    var length = 85;
    var moved = M*(width + 85)/60;
    stroke(180);
    strokeWeight(1);
    fill(180);
    triangle(width-moved,height-17, width+70-moved,height-5,width+70-moved,height-29);
    triangle(width+70-moved,height-5,width+70-moved,height-29,width+85-moved,height-17);
    rect(width+45-moved,height-30,30,10);
    rect(width+55-moved,height-35,15,10);
    rect(width+60-moved,height-45,5,10);
    rect(width+55-moved,height-42,15,3);
    stroke(90);
    strokeWeight(1);
    line(width+5-moved,height-17,width+80-moved,height-17);

    //Ring2 
    noFill()
    stroke(40);
    strokeWeight(2);
	arc(width/2-43,height/2-38,22,22,0,radians(360));
	stroke(color(30,140,40));
    //Equator Line
    stroke(80);
    strokeWeight(3);
    line(width/2-109,height/2,width/2+109,height/2);

    //Equator Lights
    for (var i = 0; i < H; i++){
    	stroke(255);
    	strokeWeight(1);
    	line(cut_start+1+i*div, height/2, cut_start+1+i*div+seg,height/2);
    }
    // Compute the widths of the rectangles

    //Texture on the Deathstar
    var box_s = width/2 - 85;
    noStroke();
    fill(105);
    for (var i = 0; i < 3; i++){
    	rect(box_s + 20*i,height/2+10,10, 40)
	}    
	rect(box_s + 60, height/2+10, 70, 20);
	for (var i = 0; i < 2; i++){
    	rect(box_s + 135 + 20*i,height/2+10,15, 60-i*10)
	}    
	rect(box_s + 60, height/2+35,20,65);
	rect(box_s + 87.5, height/2+35, 42.5,42.5);
	rect(box_s + 87.5, height/2+82.5,42.5, 10);
	arc(box_s + 50, height/2+60, 85,65, radians(90),radians(180));
	arc(box_s + 85, height/2-10,180,180,radians(270),radians(360));
	fill(120);
	rect(box_s + 100, height/2-100,10,90);
	rect(box_s + 125, height/2-90,10,80);
	rect(box_s + 150, height/2-70,10,60);
    

}

I am a huge star wars fan and this was a fun project for me. I started off of thing about rings and how that can represent time, which then lead me to the death star on how the cannon needs to charge to fire. Below are some sketches that described what I had in mind before implementing it in p5.js. The seconds are represented by the green charging ring of the cannon of the Death Star. At the end of every min, the canon will fire. The lights at the equator of the Death Star represent each hour of the day. For example, 7AM will have 7 lights lit up. Finally the Star destroyer at the bottom moves across the screen every hour.

akluk – Section A – Looking outwards-05

The project that I was inspired by that was related to 3-dimensional graphics is Lee Grigg’s Xgen’s 3D renderings, created in 2014.

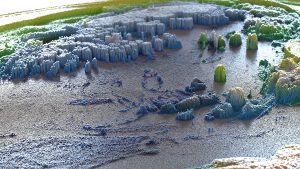
What I believe makes these renderings interesting is the fact that each surface is created by elevating or moving a “3D’ pixel to create structures and models. As we know, the basis of all computer graphics is visualizing data, and this is achieved with pixels, the building blocks of all images in computers. It is impressive that even something ground in such structured and calculated can create renderings reminiscent of occurrences in real life. While the artist simply used a program, Maya and Arnold, to create the renderings and graphics. What really impresses me is the program that is able to simulate “vision”, where it can determine shadows, depth, colors, and lighting. That is truly what is impressive about 3D graphics. The artist always seems to like to create 3D models but not smooth renderings but with disjointed and pixelated methods. Below is a link to the referred work.
Maya XGen Colored Cubes and Spheres Rendered with Arnold

akluk-Project5-Section-A-Wallpaper

sketch
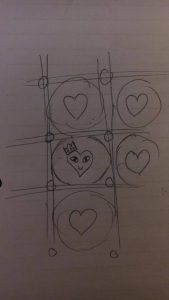
My art is inspired by a logo that i quite like and it was fun recreating it as a wallpaper. It was a challenge to create complex and organic/natural pattern using simply a double for loop and little hard coding for each one specific cell. Creating a if statement that was able to create a pattern with the colors was also interesting to think about.

//Alvin Luk
//Section A
//akluk@andrew.cmu.edu
//Assignment-05-B

var total; //variable that controls the number of circles at current row
var w = 90;
var sx = w/2;
var sy = w/2;

function setup() {
    createCanvas(450, 450);
    background(color(119,221,170));

    for (var y = 0; y < height/w; y++) {
        for (var x = 0; x < width/w; x++) {

            //determines color of the heart
            if ((y*5+x)%2 == 0){
                fill(color(255,20,20));
            }
            else if (x%2 == 1){
                fill(color(255,105,180));
            }
            else {
                fill(color(255,215,0));
            }
            noStroke();

            //draws heart outline
            ellipse(sx+x*w-10, sy+y*w-10,20,20);
            ellipse(sx+x*w+10, sy+y*w-10,20,20);
            triangle(sx+x*w-20,sy+y*w-7,sx+x*w+20,sy+y*w-7,sx+x*w,sy+y*w+18)

            //draws eye whites
            fill(255);
            ellipse(sx+x*w-9, sy+y*w-7,10,6);
            ellipse(sx+x*w+9, sy+y*w-7,10,6);

            //draws pupils
            fill(0);
            ellipse(sx+x*w-9, sy+y*w-7,5,6);
            ellipse(sx+x*w+9, sy+y*w-7,5,6);
        }
    }


    //draws line grid
    for (var i = 0; i < 4 ; i++){
        stroke(0);
        strokeWeight(2);
        line(w*(i+1)-3,0,w*(i+1)-3,height);
        line(w*(i+1)+3,0,w*(i+1)+3,height);
        line(0,w*(i+1)-3,width,w*(i+1)-3);
        line(0,w*(i+1)+3,width,w*(i+1)+3);
    }

    //draws purple loops around intersection
    for (var j = 0; j < 4 ; j++){
        for (var k = 0; k < 4; k++){
            noFill();
            stroke(106,90,205);
            strokeWeight(4);
            ellipse(w*(j+1),w*(k+1),20,20);
        }   
    }
    noLoop();
}


function draw() {
    // draw is not called due to noLoop() in setup()
}

akluk – Section A – Looking outwards-04

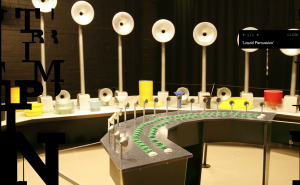
The project that I have decided to write about is Liquid Percussion, by TRUMPIN or Gerhard Trimpin.

It is an acoustic sculpture that creates music based on the amount of rain. The water droplets will then fall and strike the various unique instrument at the bottom. The Artist has always been been very passionate about blending electronics, art and music together and this piece is no exception. I don’t think any specific algorithms are used in the creation of this project, since most of it is dependent on nature and rainfall. What really impresses me about this work is how its actually able to create such complex and interesting melodies and rhythms from this sculpture. You can see more of his work from the link below.

http://www.trimpinmovie.com/#/selectedworks/

akluk-Project4-Section-A-StringArt

sketch
It was fun and exciting to create curves with straight lines and was challenging to figure out the correct values

function setup() {
    createCanvas(400, 300);
}

function draw() {
	background(0)

	//establishing initial points and step sizes as variables
	var x1 = 0;
	var y1 = height;
	var x2 = 0;
	var x3 = 0;
	var y3 = 0;
	var x_step1 = width/20;
	var y_step1 = height/40;
	var x_step2 = width/15;
	var x_step3 = width/60;
	var y_step3 = height/60;


	//creates creates the blue - white curves in the center of the canvas
	for (var j = 0; j < 30; j++){
		stroke(color(240-8*j,240-8*j,255));
		line(x2,height/2,width,height/2 - j*y_step3);
		line(0,height/2 + j*y_step3,width-x2,height/2 );
		x2 += x_step2;
	}

	
	//creates green yellow gradient curve on the lower right corner
	for (var i = 0; i < 20; i++){
		stroke(color(50+10*i,150,14))
		line(x1,height,width,y1);
		x1 += x_step1;
		y1 -= y_step1;

	}

	//creates red "line" generated ellipse
	for (var k = 0; k < 30; k++){
		stroke(color(240-8*k,0,0));
		line(0,y3,x3,height/2);
		line(0,height/2-y3,x3,0);
		line(width/2,y3,width/2-x3,height/2);
		line(width/2,height/2-y3,width/2-x3,0);
		x3 += x_step3;
		y3 += y_step3;
	}
}

akluk – Section A – Looking outwards-03

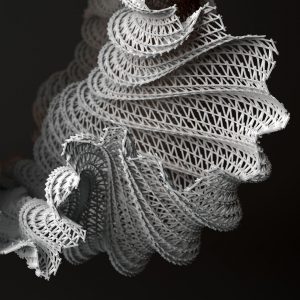
The project is called Rocaille, by Benjamin Dillenburger. No date was specified in the project.

His project seems to be reminiscent of shapes and patterns similar to shells. What I admire about this is the amount of detail in this project. Each surface is created with multiple small twigs of plastic. While I am not sure what algorithms are used to create this piece of artwork, but it seems to remind me fractals and creating smooth surfaces with numerous discrete pieces. The artist seems to have a style for creating very curvy and smooth structures through mathematical and calculated means. We often do not think about art as a very mathematical and calculated way, but this is equally beautiful and logical.

Rocailles

akluk – section A – project-03 – DynamicDrawings

sketch.jsIt was quite challenge to align and create a dynamic ring of shapes that was uniformly spaced and distributed.

var radius = 200
var x_c = 320;
var y_c = 240;
//1/8 of 2 pi
var theta = 0.785;
var shapes = 8;
function setup() {
    createCanvas(640, 480);
    background(220);
}

function draw() {
    background(0);

    //draws dynamically colored background
    //left rectangle
    fill(color(255-mouseX/3,mouseX/2,255-mouseX/3));
    rect(0,0,mouseX,480);

    //right rectangle
    fill(color(100,170,255-mouseX/4));
    rect(mouseX,0,640-mouseX,480);

    //calculations to create dynamic behavior
    var distance = dist(width,y_c,mouseX,mouseY);
    radius = distance/2;
    translate(320,240);
    push();

    //offset rotation
    rotate(radius/10);

    //creates the ring of shapes
    for (i = 0; i < shapes; i++)
    {
    	rotate(theta);
    	fill(color(40+i*radius/8,100-i*radius/8,100));
    	if (i%2 == 1){
    		triangle(160-radius,0,180-radius,-20,180-radius,20);
    	}
    	else{
    		ellipse(160-radius,0,30+radius/6,30+radius/6);
    	}
    }
    pop();
}