![[OLD FALL 2017] 15-104 • Introduction to Computing for Creative Practice](../../../../wp-content/uploads/2020/08/stop-banner.png)
//Ashley Chan
//Section C
//ashleyc1@andrew.cmu.edu
//Project-07-Curves
var width = 480;
function setup() {
createCanvas(480, 480);
}
function draw() {
background(220);
drawAstroid();
drawRanunculoid();
}
//first "shape"
function drawAstroid() {
var x;
var y;
var b = 40;
stroke(255);
strokeWeight(.5);
noFill(0);
beginShape();
push();
translate(width/2, height/2);
for(var i = 0; i < 500; i ++) {
//llows for lots of different ways shape is being drawn
var theta = map(i, 0, width, constrain(mouseX, 0, 480) + 600, TWO_PI);
//astroid parametric formulas
x = (3 * b * cos(theta)) + (b * cos(3* theta));
y = (3 * b * sin(theta)) - (b * sin(3* theta));
vertex(x, y);
}
endShape(CLOSE);
pop();
}
//second "shape"
function drawRanunculoid() {
var x;
var y;
var a = 5; //scales shape
stroke(200);
strokeWeight(.5);
beginShape();
translate(width/2, height/2);
for(var i = 0; i < 75; i ++) {
var theta = map(i, 0, width, 2 * constrain(mouseX, 0, 480) + 600, TWO_PI);
//ranunculoid parametric formulas
x = a * (6 * cos(theta)) + (cos(6* theta));
y = a * (6 * sin(theta)) - (sin(6* theta));
vertex(x, y);
}
endShape(CLOSE);
//same shape but bigger and falls outside of astroid
beginShape();
for(var i = 0; i < 75; i ++) {
var theta = map(i, 0, width, 2 * constrain(mouseX, 0, 480) + 600, TWO_PI);
x = 50 * (6 * cos(theta)) + (cos(6* theta));
y = 50 * (6 * sin(theta)) - (sin(6* theta));
vertex(x, y);
}
endShape(CLOSE);
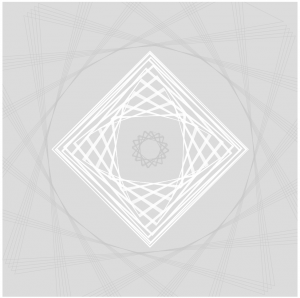
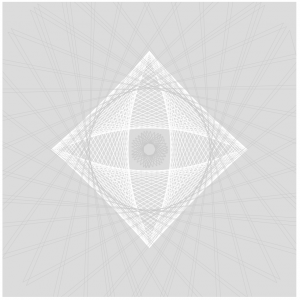
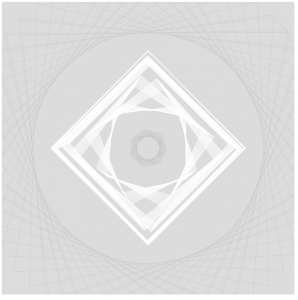
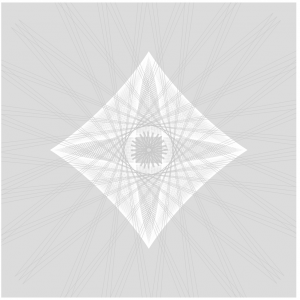
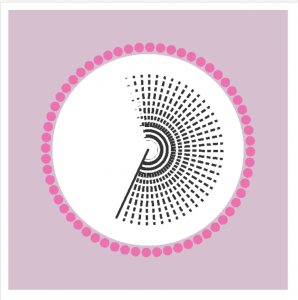
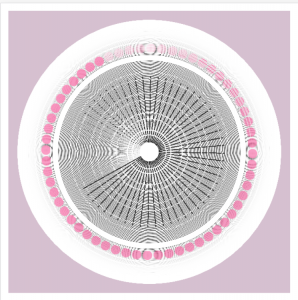
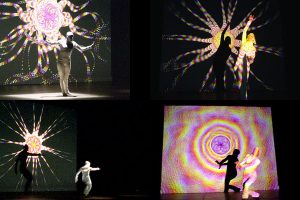
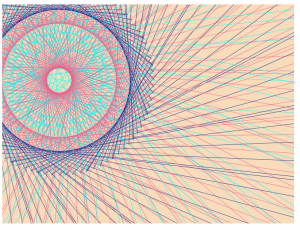
}I had a lot of fun with this project. My process was just a lot of exploring the different functions via mathworld and playing around with which functions look nice with one another. It was a nice refresher to look at math formulas and think about how they corresponded with the visual compositions it was creating. I also spent a lot of time learning about map() and how to draw complex “shapes” using vertex(). I think there’s a lot of potential of using math as a way to create compelling and dynamic visuals.
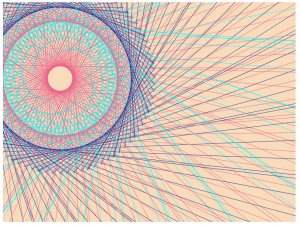
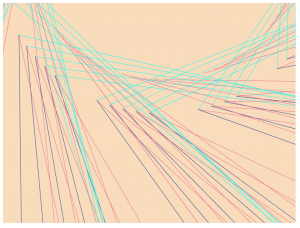
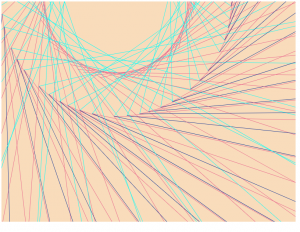
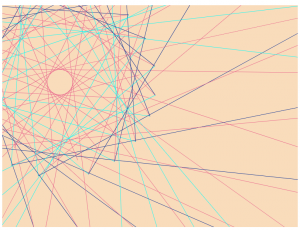
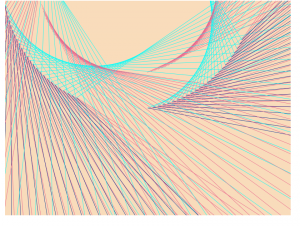
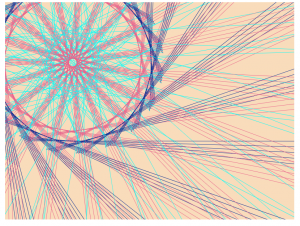
Some Stills: