ghou-Project-07-Curves

sketch

//Grace Wanying Hou
//15-104 Section D
//ghou@andrew.cmu.edu
//Assignment 07


//global vars
var points;
var angle;


function setup() {
    createCanvas(480, 480);
    angleMode(DEGREES);
    frameRate(70);
}

function draw() {
    background(50);
    //curves changing w mouse
    points = map(mouseX, 0, width, 0, 300);
    angle = map((mouseX+mouseY/2), 0, width, 0, 360);
    
    
    //flickering colourful shadows
    stroke(random(230,255),random(230,255),random(230,255));
    drawCurve(width/2 + random(-5,5), height/2 + random(-5,5));
    
    stroke(random(200,240),random(200,240),random(200,240));
    drawCurve(width/2 + random(-10, 10), height/2 + random(-10, 10));
    
    stroke(random(180,220),random(180,220),random(180,220));
    drawCurve(width/2 + random(-15, 15), height/2 + random(-15, 15));
    
    stroke(random(150,200),random(150,200),random(150,200));
    drawCurve(width/2 + random(-20, 20), height/2 + random(-20, 20));
    
    stroke(random(100,180),random(100,180),random(100,180));
    drawCurve(width/2 + random(-30, 20), height/2 + random(-30, 20));
    
    stroke(random(80,150),random(80,150),random(80,150));
    drawCurve(width/2 + random(-30, 20), height/2 + random(-30, 20));
    
    //main shape
    stroke(255);
    noFill();
    drawCurve(width/2, height/2);
}

function drawCurve(posX, posY) {
  var x;
  var y;
  var b = map(mouseY, 0, 480, 60, 80);

  strokeWeight(1);
  noFill();

  push();
  translate(posX, posY);
  rotate(angle);
  //variation on fermat's spiral
  beginShape();
  for (var i = 0; i < points; i++) {
    x = 3*cos(2*i*.1*i)*b;
    y = 3*-sin(2*i*.1*i)*b;
    vertex(x, y);
      
  }
  endShape(CLOSE);
  pop();
}

After forgetting math I did in high-school I had to do a lot of studying and research on the different functions to create this interactive curve.

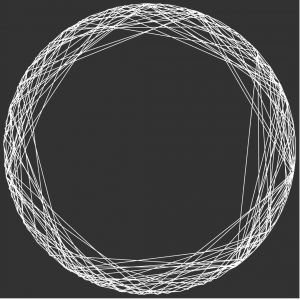
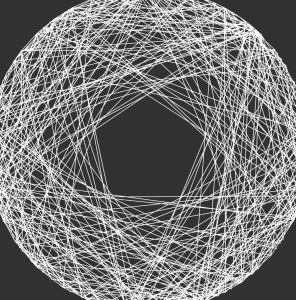
I was looking at spirals when I came across my concept. My variation generates lines to create a polygon in the shape of a circle and connects lines through the vertices through the polygon.
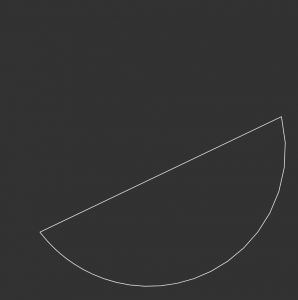
These are the “basic” shapes that my code generates. I created some shadow forms behind it to make it look more aesthetic.

ghou-lookingoutwards-07

This week I will be looking at Rachel Binx and exploring the way she graphically represent data. She is also the author of MeshuManyMapsCliffs&Coasts, and Gifpop. Binx is currently working with the Content Science and Algorithms team in Los Angeles in Netflix.

Many of the projects she has led and produced before creatively interprets and represent data. Such as NASAJPL Vortex, Mapzen Metro Extracts, New York Times Internal Dashboard, Harvard Library Haystacks, Healthy Los Angeles, and many others.

For example, the Harvard Library Haystacks displays items in the Harvard Library by categories.

This is a graphical representation of the categories in the library displaying them in shapes and colours so it is easier to interpret.

The NASAJPL Vortex is a project that Rachel Binx lead including project and visual design and then later management.

This project, for example, is built in React and d3.js.

ghou-Project-06-AbstractClock

sketch

//Grace Wanying Hou
//15-104 Section D
//ghou@andrew.cmu.edu
//Assignment 06

//background colours
var br = 245;
var bg = 250;
var bb = 255;
//bubbles
var bol = [];
var xarray = [];
var yarray = [];

function setup(){
    createCanvas(300,300);
    angleMode(DEGREES);
    //setting up the pink bubbles
    for (var i=0;i<150;i++){
        bol.push(new moving());
    }
}
function mousePressed(){
        this.x = 150;
        this.y = 150;
}
function draw (){
    background(br,bg,bb);
    var h = hour();
    var m = minute();
    var s = second();    

    //the pink bubbles moving
    for (var i=0;i<bol.length; i++){
        bol[i].move();
        bol[i].display();
    }
    // the bubbles created from dragging the mouse
    for (var a = 0; a < xarray.length; a++){
        fill(250,200,230,200);
        ellipse(xarray[a],yarray[a],20);
        yarray[a] += 1;
    }
    
    //thte clock bubbles
    push();
    noStroke();
    fill(br,bg,bb);
    translate(width/2,height/2);
    rotate(s*(360/60));
    rotate(-90);
    ellipse(110,0,55);
    pop();
    
    push();
    noStroke();
    fill(br,bg,bb);
    translate(width/2,height/2);
    rotate(m*(360/60));
    rotate(-90);
    ellipse(60,0,40);
    pop();
    
    push();
    noStroke();
    fill(br,bg,bb);
    translate(width/2,height/2);
    rotate(h*(360/12));
    rotate(-90);
    ellipse(30,0,25);
    pop();
}


//having new bubbles follow mouse when mouse dragged
function mouseDragged(){
    xarray.push(mouseX);
    yarray.push(mouseY);
}
//moving bubbles and how they move 
function moving(){
    this.x = 150;
    this.y = 150;
    this.diameter = (20);
    this.speedx = random(-1.3,1.3);
    this.speedy = random(-1.3,1.3);
    
    this.move = function() {
        this.x += this.speedx;
        this.y += this.speedy;
        if (this.x >= width-5 || this.x <= 5){
            this.speedx = -this.speedx;
        }
        if (this.y >= height-5 || this.y <= 5){
            this.speedy = -this.speedy;
        }
    };
    
    this.display = function(){
        fill(250,200,230,200);
        noStroke();
        ellipse(this.x,this.y,this.diameter,this.diameter);
    };
    
}

For this project I first looked up some abstract clocks in our project references for some inspiration. I wanted to make the “clock hands” as subtle as possible but still visible if one looked long enough at this project.

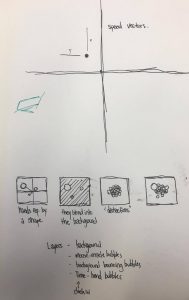
here are some sketches I did to plan for this project. I decided to make the clock hands “melt” into the background and invisible without the background distraction bubbles.

ghou-lookingoutwards-06

Holger Lippmann

After looking on Google and Pinterest, I found an artist whose work I really enjoy. This week I will be doing my Looking Outwards Report on Holger Lippmann. His latest work can be found here.

Lippmann started with focused study in visual arts as a teenage. He went to his first computer graphics internship at the Institute of Technology in New York. He worked more closely with computers when he moved back to Germany, his fascination of working with software and internet based media grew. His work includes vector files ranging from sizes 80 centemetres to 180 metres wide.

21016213620_noisegridneu05_3_col_elli3_23

One of the pieces I most admire is the Noise Scape 4 Series.

this is a rework of some ongoing scripts and one of Lippmann’s most recent works. I really enjoy this work because it is a romantic landscape painting that has been created with simple 2d geometries. Lippmann has programed a script that can run and produce many of these “paintings” and he then chooses the best to print.

ghou-project-05-Wallpaper

sketch

//Grace Wanying Hou
//15-104 Section D
//ghou@andrew.cmu.edu
//Assignment 05 A

//globals
//rectangles
var lx = 60;
var ly = 40;
var rx;
var ry;
//diagonals
var dx = 0;
var dy = 0;
var dyn = 0;


function setup(){
    createCanvas(600,600);
    background (255);
    angleMode(DEGREES);
}

function draw(){
    for (var y = 0; y < height/ly; y++) {
        for (var x = 0; x < width/lx; x++) {
            //local variable (needs to change w each square);
            //circles
            var sizes = [0,0,0,lx,lx*2,lx*3];
            var csize = random(sizes);
            //transparency
            var tran1 = random(20,100);
            //lineweight
            var linew = random(0.1,1);
            var cirw = random();
            
            //colour
            var colr = randomGaussian(200,20);
            var colg = randomGaussian(200,20);
            var colb = randomGaussian(200,20);
            
            //rectangles
            noStroke();
            rx = x * lx;
            ry = y * ly;
            fill(colr,colg,250,tran1);
            rect(rx,ry,lx,ly);            
            
            //circles
            strokeWeight(linew);
            stroke(255);
            fill(250,colg,colb,tran1);
            ellipse(rx,ry,csize);
        }
    }
    
    for (var y = -2; y < height/ly; y++) {
        for (var x = -2; x < width/lx; x++) {
            var linew = random(0.5,1);
            //rect strokes
            rx = x * lx;
            ry = y * ly;
            stroke(255);
            strokeWeight(2);
            noFill();
            rect(rx,ry,lx,ly);
            
            //diagonals
            dx = (x + 1) * lx;
            dy = (y + 1) * ly;
            strokeWeight(linew);
            //lines crossing rectangle
            line(rx,ry,dx,dy);
            line(dx,ry,rx,dy);
            //lines crossing each 3 rectangles
            dyn = (y + 3) * ly;
            line(rx,ry,dx,dyn);
            line(dx,ry,rx,dyn);
            
        }
    }
    noLoop()
}


I wanted to create a wallpaper more suited to be a wallpaper for a phone or an iPad. Based on that, I wanted to make something more geometric. I used a Gaussian randomizer to more easily make it look more naturally generated.

ghou-lookingoutwards-05

Motion Graphics

like many teens in this generation, one way i discover graphics and trends are through social media. This week I chose to focus on an Instagram account that I’ve been following @motiongraphics_collective, this account collects 3D computer graphic works from other artists and posts them in short video form. This week I chose to check out a couple artists featured on this account.

@ef.social

This is a pretty new account based in Singapore. Their graphics mainly include complex shapes and a series of graphics that leads to forming/deforming it. I admire the geometries created by this artist and the simplicity in its generations.


@lvmtn

This artist is a freelance designer. [his portfolio] His work is very organic and have a natural characteristic.

it is very interesting “stalking” artists on social media because a lot of times the works are very raw. It is nice to see everyone’s individual aesthetic on their accounts.

ghou-project-04-StringArt

sketch

//Grace Wanying Hou
//15-104 Section D
//ghou@andrew.cmu.edu
//Assignment 04 

// increases
var inc = 15;
var xint = 15;
// positions
var x1 = 1; 
var y1 = 499;
var x2 = 499;
var y2 = 1; 
//colours
var lr;
var lg;
var lb;

function setup(){
    createCanvas(500,500);
    background(0);
}

function draw() {
    
    var m = mouseX/25; // colour gets "redrawn" and changes with mouse 
	for(var i = 0; i < m; i += 1) {
		strokeWeight(1);
        lr = i*mouseX/2-500;
        lg = i*mouseY/2;
        lb = i*-mouseY/2+600;
		stroke(lr,lg,lb); //white

        line(x1, inc * i, inc * i, y1); //bottom left
        line(inc * i, y1, x2, y1 - inc * i); //bottom right
        line(x2 - inc * i, y2, x2, y1 - inc * i); //top right
		line(x2 - inc * i, y2, x1, inc * i); //top left
	}
}


I wanted to create something interactive or something that changes. I always found string art really cool especially the optical illusions. This piece was a little challenging to put together because of the amount of variables it required it gets a little bit confusing

ghou-lookingoutwards-04

SOUNDLEAK

Keiko Uenishi is known for being a sound art-i-vist, as she described herself on her website bio. Her work includes reconstructing and experimenting with materials and one’s relationship with them in sociological and psychological environments. Uenishi’s present works include BroadwayDreams, Aboard: Fillip2, LandFilles, and many others.

Her installation LandFilles_UrbanDump is a project that took place at the Emily Harvey Foundation located in New York City in 2013. This piece was very inspiring because it takes a look at our urban environments using recycled material. This project was divided into several steps:

  1. Collection and Construction: recycling empty, clear, plastic bottles and constructing a structure from recycled materials
  2. Live processes/Performance: the structure is built with help from visitors and interacts with the pieces to produce audio feedback derived from the hollow shapes of the bottles.
  3. Demolition/Giveaway: the structure is torn down and given away to visitors or other people.

ghou-project-03-DynamicDrawing

sketch

//Grace Wanying Hou
//15-104 Section D
//ghou@andrew.cmu.edu
//Assignment 03 
var br;
var bb;
var bg;
var ss;

function setup(){
    createCanvas(640,480);
    rectMode(CENTER);
    background(255);
    //base text
    br = width/6 + 30;
    bb = height/4 + 100;
    bg = 200;
    //setting colour of the text so it blends in with that region of colour
    textSize(30);
    fill(br,bb,bg);
    text("drag mouse to draw",200,400);
}
ss = 0;
//creating the heart
function draw(){
    fill(255);
    noStroke();
    
    
    // heart changes size when drawing (mouse is pressed)
    // heart creates gradient colour the bigger it is
    if (mouseIsPressed){
        if (ss < 1.5){
            ss = ss +0.005;
            fill(255,255-ss*170,255-ss*170)
        }
    }
    //creates gradient when heart shrinks
    else if (ss >0){
        ss = ss - 0.02;
        fill(255,255-ss*200,255-ss*200)
    }
    // heart is red when at largest and text appears to tell audience to let go of the mouse
    if (ss >= 1.5){
        push();
        fill(255);
        text("let go!!",280,70);
        pop();
        fill(255,0,0);

    }
    
    push();
    translate(width/2,height/2);//so the posotion doesnt get messed up as it scales
    scale(ss); 
    ellipse(-55,-30,130,150);
    ellipse(55,-30,130,150);
    triangle(-105,19,0,130,0,0);
    triangle(105,19,0,130,0,0);
    pop();
}

//drawing with the mouse (in gradient colour)
function mouseDragged(){
    br = mouseX/6 + 30;
    bb = mouseY/4 + 100;
    bg = 200;
    noStroke();
    fill(br,bb,bg);
    ellipse(mouseX,mouseY,80,80);
}

in my sketchbook I included some sketches on how to do the layering so that the text hides behind the “drawing”.

This dynamic drawing is inspired with social media “Likes”, I had originally wanted my audience to double-click for the heart to appear, as it represents a double tap on social platforms. However, I could not get the doubleClicked() function to work and it could be something in the DOM file that I’m not knowledgable enough to get into. I figured the gradient is a pretty way to impress the audience.

ghou-lookingoutwards-03

Parametric World Online

Parametric World is a tumblr blog created by artist Marta Krivosheek. The work she shares on this blog among other online platforms are of the technological, generative nature. [Pintrest|Generative Nature Blog|Twitter]. Parametric World collects works of multiple artists in similar fields and compiles them on this blog; with the organized posts and a big follower-base, this blog is easily discovered and helps artists find inspiration and introduces them to other artists’ work of the same nature through this platform. Many works have useful descriptions in the caption stating the technology used to create the piece.

http://parametricworld.tumblr.com/post/139285863854/bigblueboo-globule-network

http://parametricworld.tumblr.com/post/152503107820/spaceplasma-the-upper-atmosphere-of-the-sun-is

here are some examples of the type of work that goes on Parametric World Tumblr. It is definitely a go-to blog for inspiration on generative art.