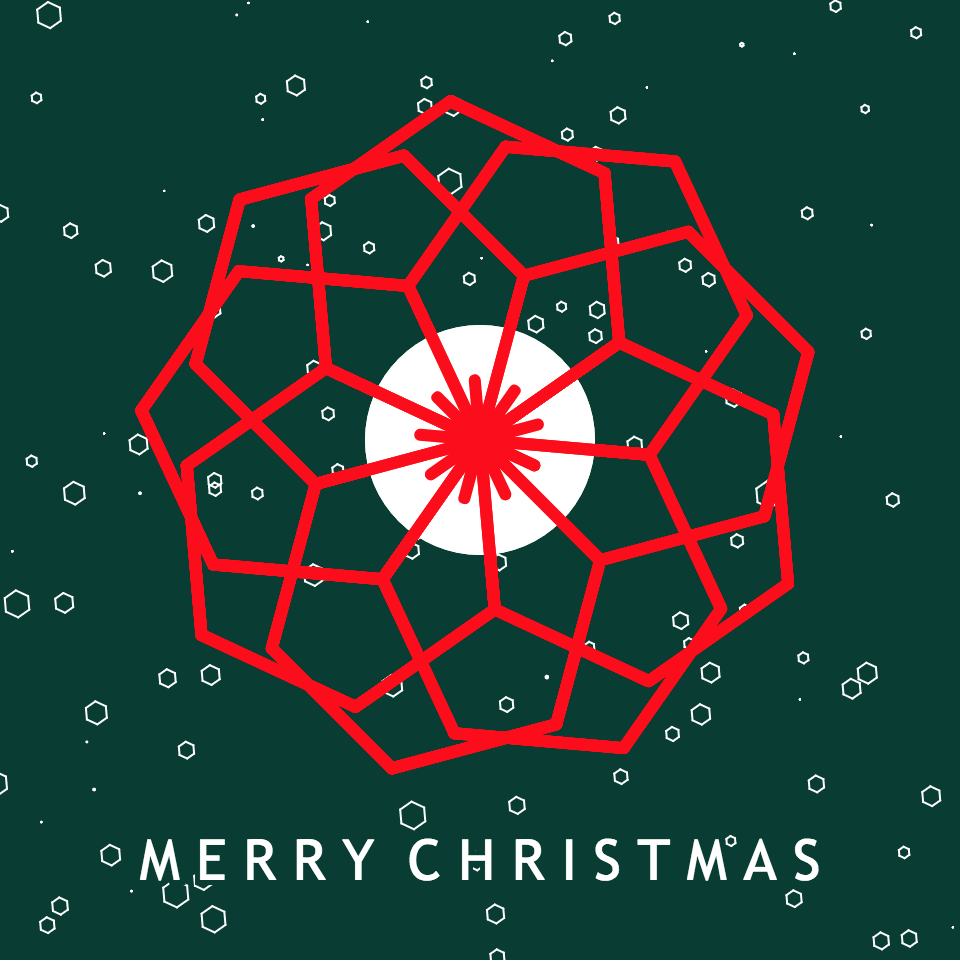
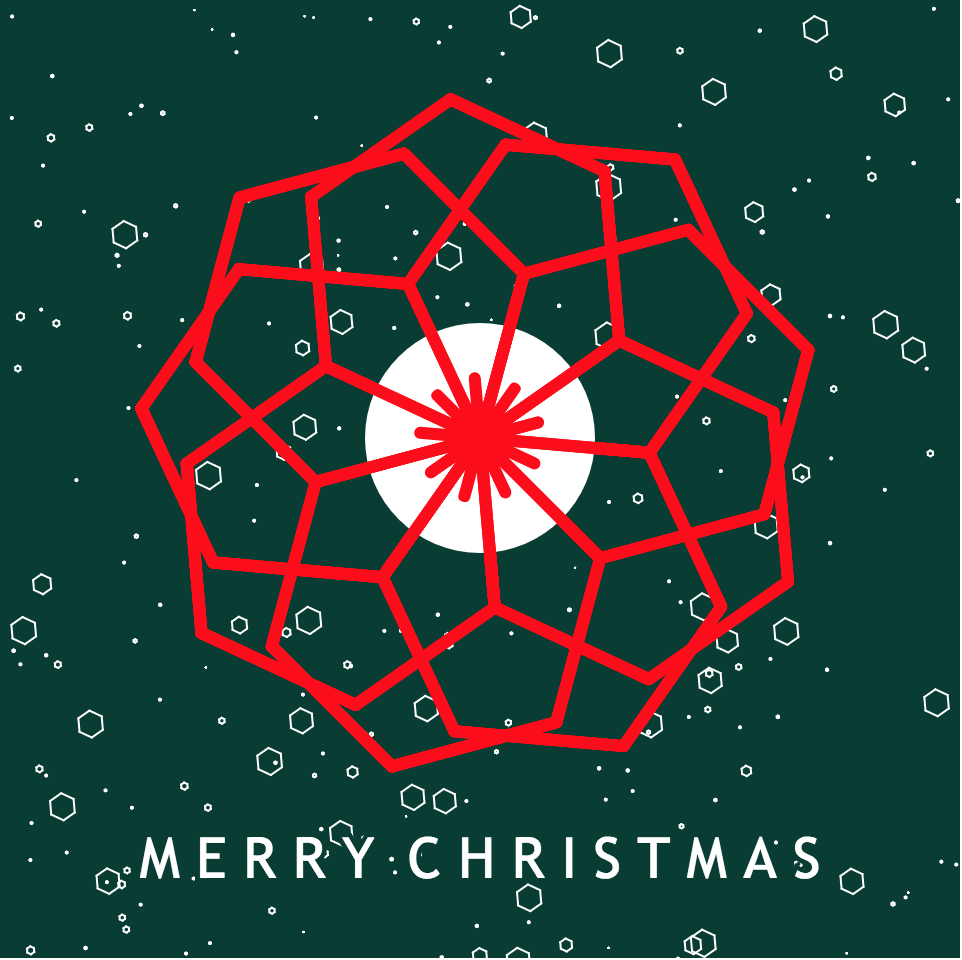
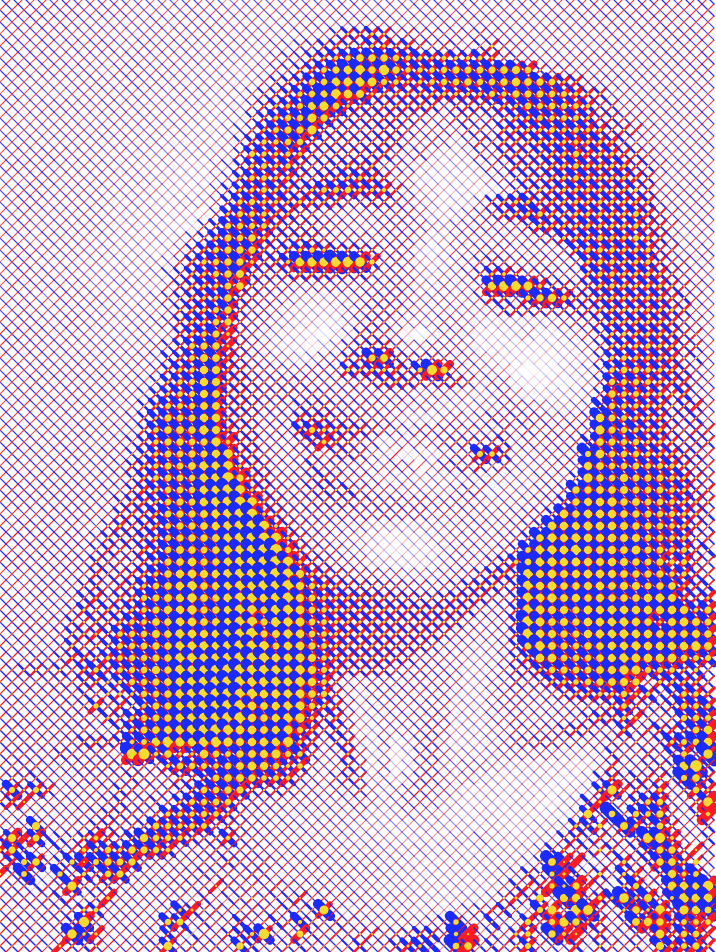
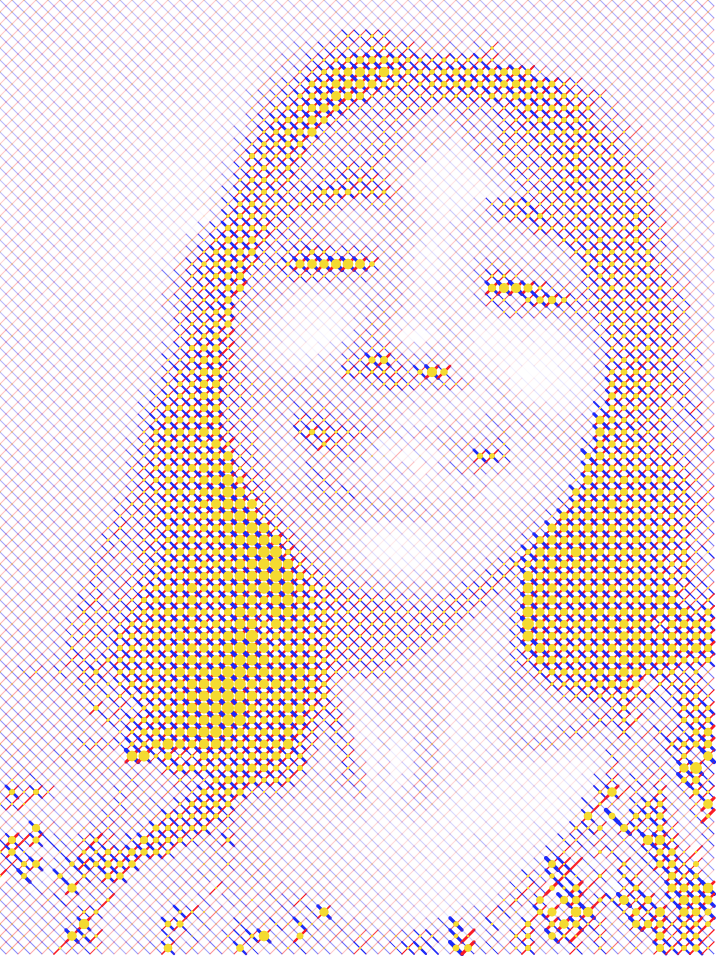
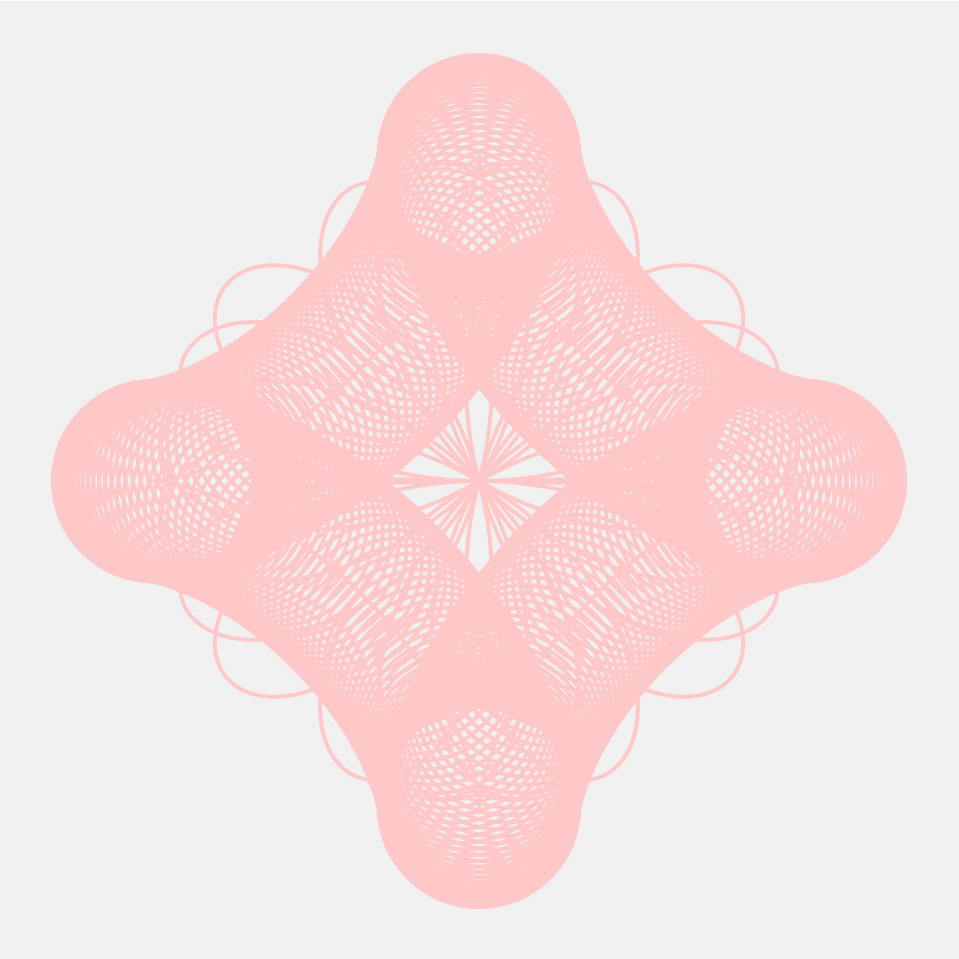
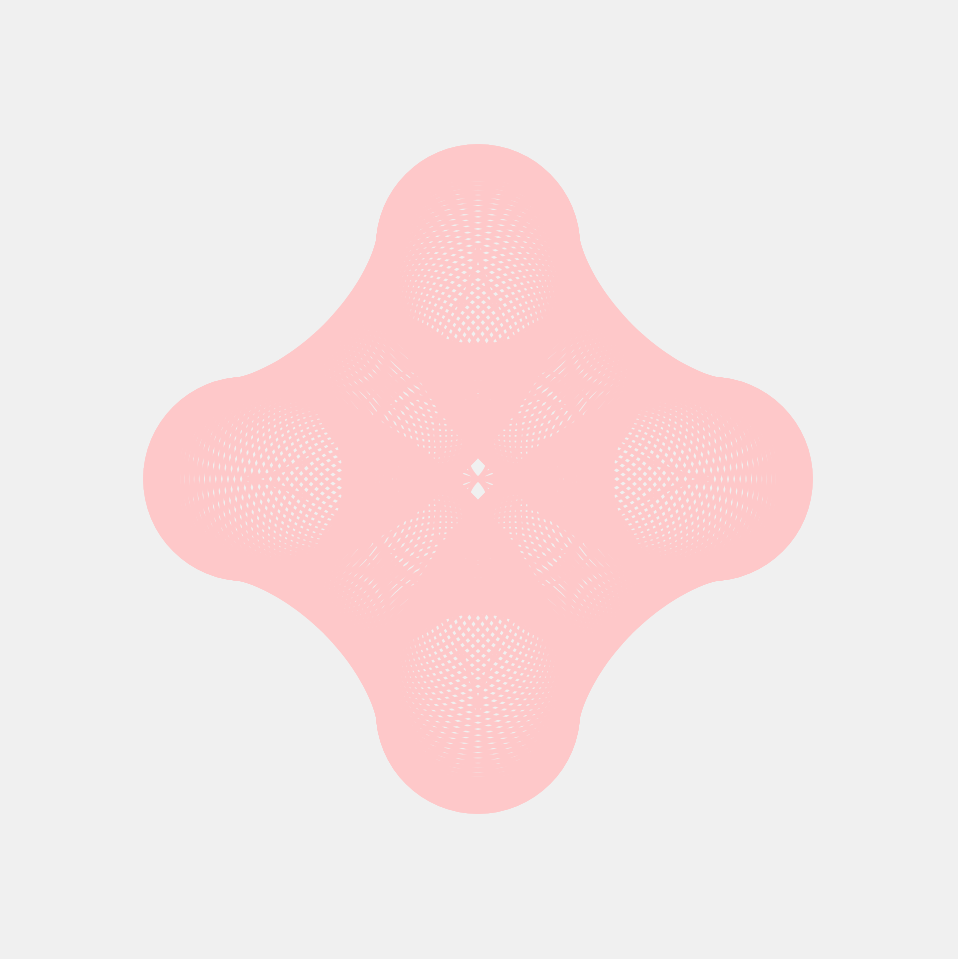
Composition with Curves
var x;
var y;
var r;
var nPoints = 300;
function setup() {
createCanvas(480, 480);
strokeJoin(ROUND);
smooth();
stroke(255, 200, 200, [255]);
}
function draw() {
background(240);
noFill();
push();
translate(width / 2, height / 2);
roseCurve();
astroidCurve();
pop();
}
function roseCurve() {
strokeWeight(2);
beginShape();
for (i = 0; i < nPoints; i++) {
var t = map(i, 0, nPoints, 0, TWO_PI);
var a = map(mouseY, 0, height, 40, height/2); var n = map(mouseY, 0, height, 0, 4); r = a * sin(n*t);
x = r * cos(t);
y = r * sin(t);
vertex(x, y);
}
for (i = 0; i < nPoints; i++) {
var t = map(i, 0, nPoints, 0, TWO_PI);
var a = map(mouseY, 0, height, 40, height/2); var n = map(mouseY, 0, height, 0, 4); r = a * sin(n*t);
x = r * cos(t);
y = r * sin(t);
vertex(-x, y);
}
for (i = 0; i < nPoints; i++) {
var t = map(i, 0, nPoints, 0, TWO_PI);
var a = map(mouseY, 0, height, 40, height/2); var n = map(mouseY, 0, height, 0, 4); r = a * sin(n*t);
x = r * cos(t);
y = r * sin(t);
vertex(x, -y);
}
for (i = 0; i < nPoints; i++) {
var t = map(i, 0, nPoints, 0, TWO_PI);
var a = map(mouseY, 0, height, 40, height/2); var n = map(mouseY, 0, height, 0, 4); r = a * sin(n*t);
x = r * cos(t);
y = r * sin(t);
vertex(-x, -y);
}
endShape(CLOSE);
}
function astroidCurve() {
noFill();
beginShape();
for (i = 0; i < nPoints; i++) {
var t = map(i, 0, nPoints, 0, TWO_PI);
var a = map(mouseX, 0, width/2, 20, nPoints/2); x = a*pow(cos(t),3);
y = a*pow(sin(t),3);
vertex(x, y);
ellipse(x, y, 100, 100); }
endShape();
}
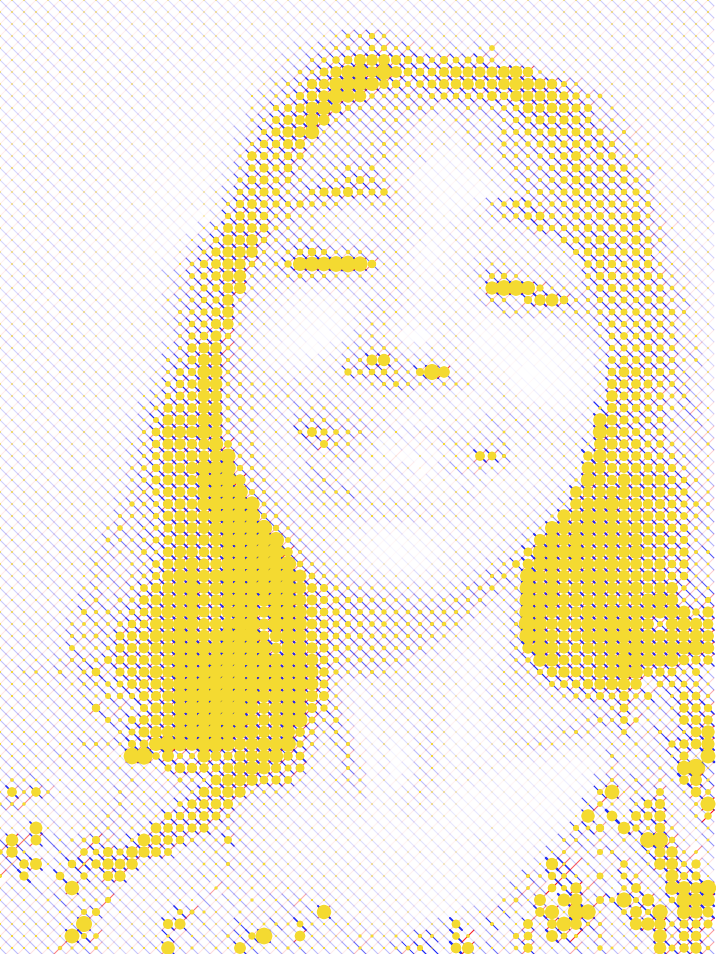
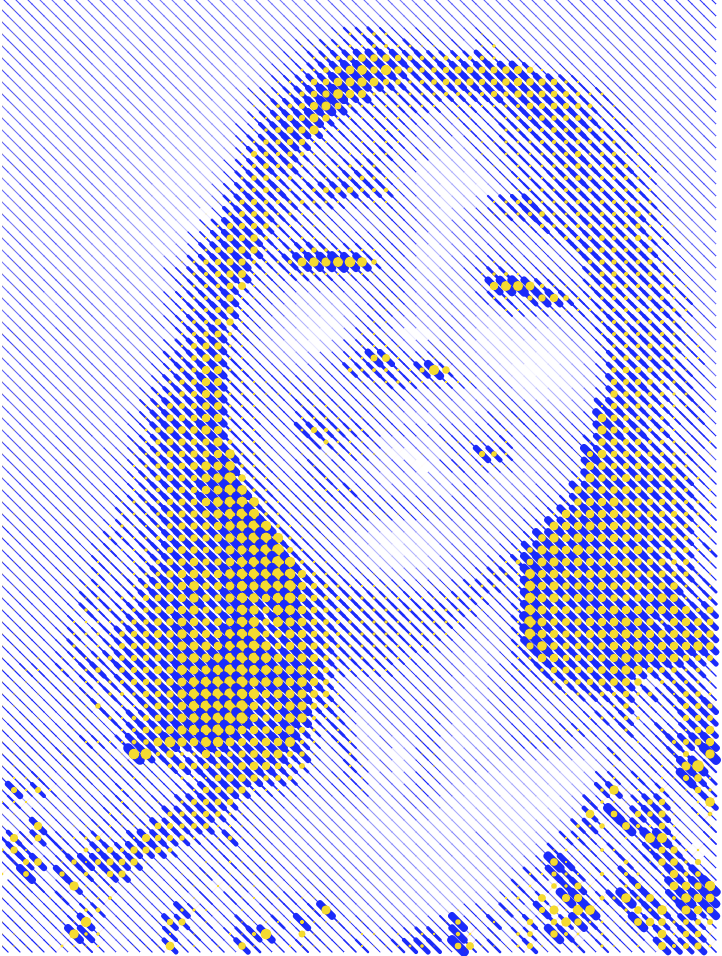
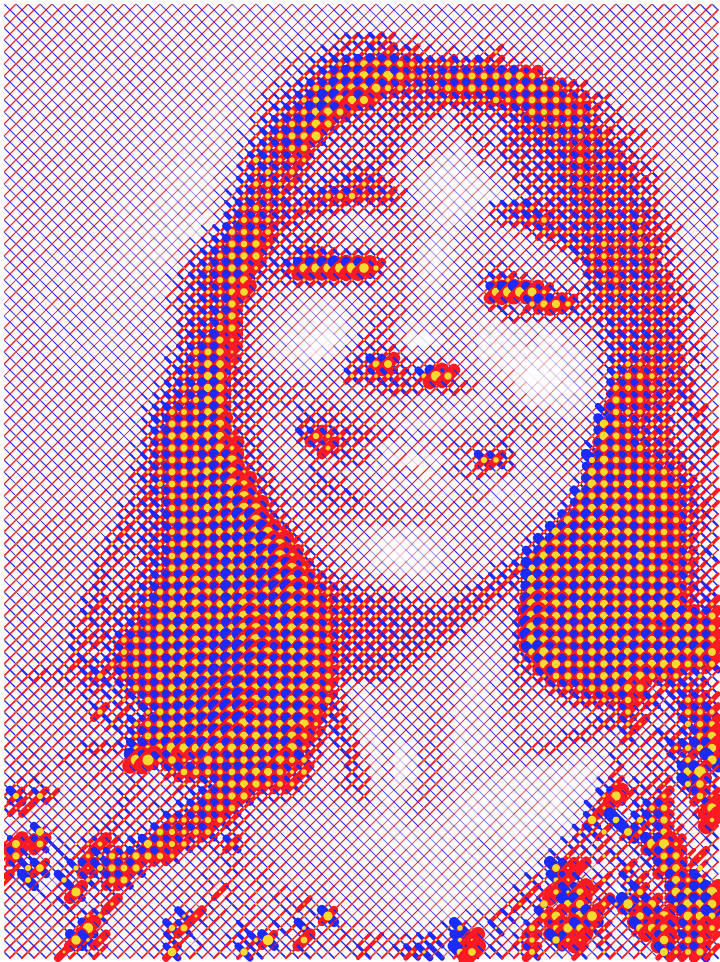
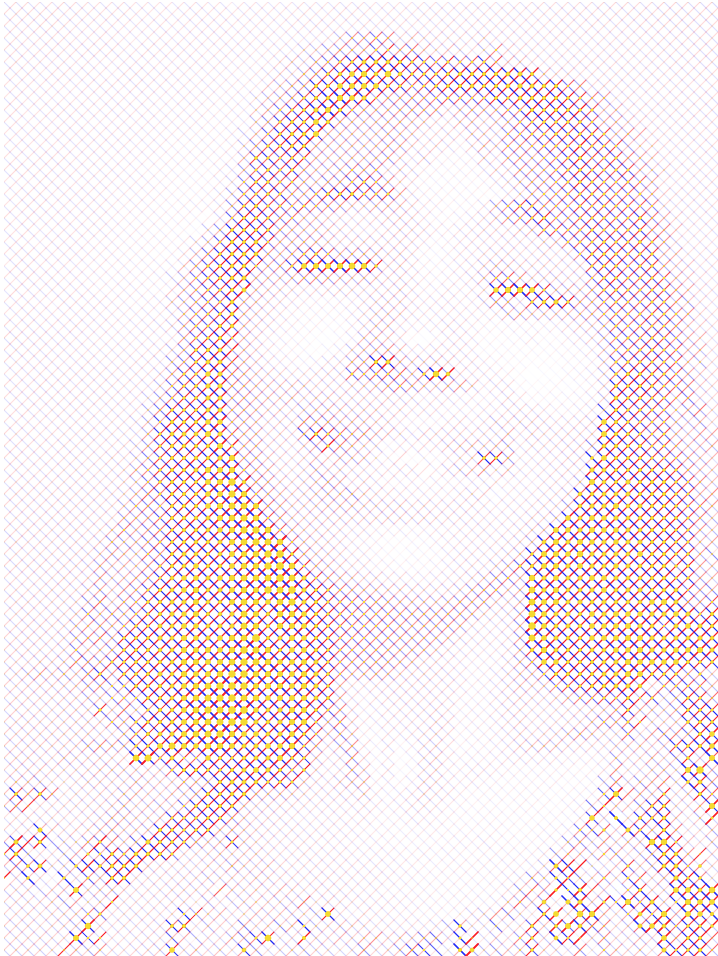
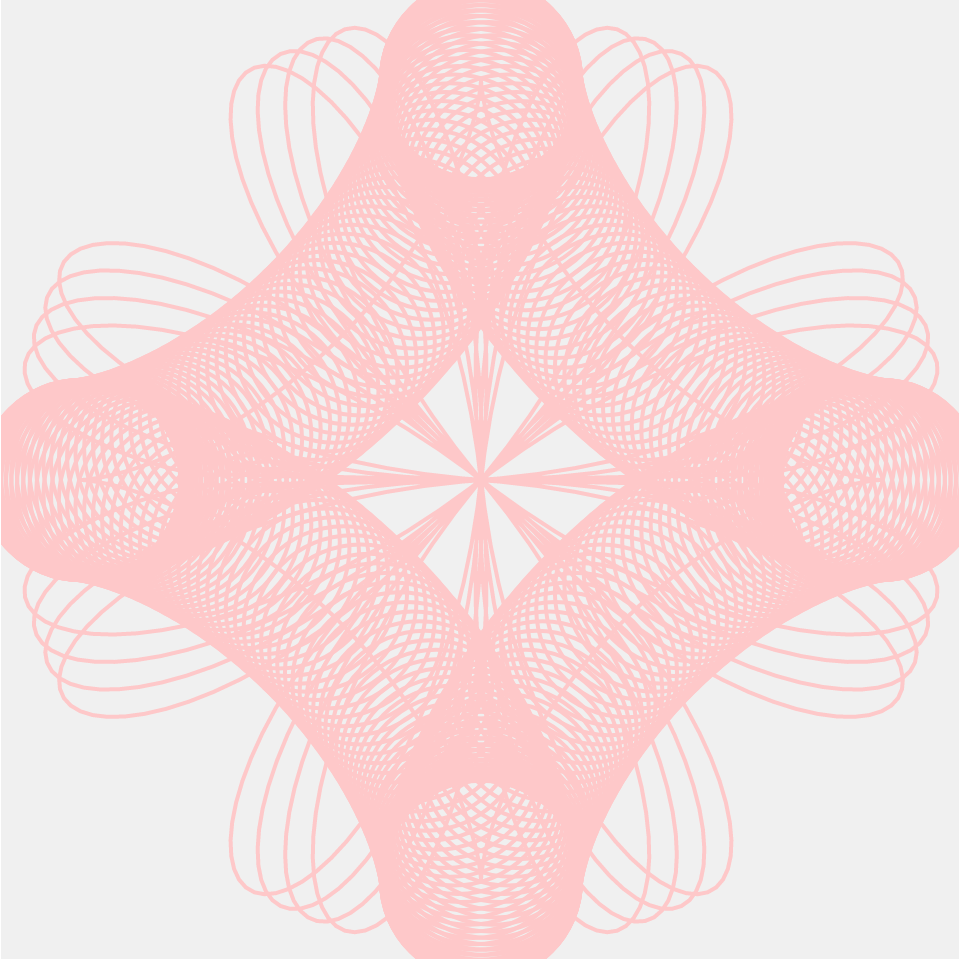
Before starting to code my program, I explored various curve equation in Mathworld curve site. I think this site is a very useful reference. Also, it was interesting to see all the different curve shapes. At the beginning, I had no idea how to apply polar form. But, I finally realized (x = r cos(θ) and y = r sin(θ)). I chose ‘Rose Curve’ and ‘Astroid Curve’ for my project. Personally, I really like rose curve because of the way it changes shape. I played with a combo of two different curves. You can see some of the nice examples below.
![[OLD FALL 2017] 15-104 • Introduction to Computing for Creative Practice](../../wp-content/uploads/2020/08/stop-banner.png)