hannahk2-Project-07

sketch

//Hannah Kim
//Section A
//hannahk2@andrew.cmu.edu
//Project-07

var nPoints = 100;
var EPITROCHOID = 0; // Cartesian Parametric Form  [x=f(t), y=g(t)]
var CRANIOID = 1; // Polar explicit form   [r =f(t)]
var curveMode = EPITROCHOID;

var numObjects = 10;
var centerX;
var centerY;
var angle = 0;
var distance = 100;

function setup() {
// creates canvas
createCanvas(500, 500);
centerX = width/2;
centerY = height/2;
noStroke();
ellipseMode(CENTER);
}

function draw() {
background(0, 0, 0, 20);
// draw the frame
fill(0); 
stroke(255, 0, 0, 40);
noFill(); 
rect(0, 0, width-1, height-1); 

// draw the curve and rotate at different angles
push();
translate(width / 2, height / 2);
drawecurve();
rotate(PI/3.0);
drawecurve();
rotate(2*PI /3.0);
drawecurve();
pop();

//function to draw the curve
function drawecurve() {
    var x;
    var y;
  
    var a = 70.0;
    var b = a / 2.0;
    var h = constrain(mouseY / 20.0, 0, b);
    var ph = mouseX / 80.0;
    
    beginShape();
    for (var i = 0; i < nPoints; i++) {
        var t = map(i, 0, nPoints, 0, TWO_PI);
        
        x = (a + b) * cos(t) - h * cos(ph + t * (a + b) / b);
        y = (a + b) * sin(t) - h * sin(ph + t * (a + b) / b);
        vertex(x, y);
    }
    endShape(CLOSE);
}

var angleObject = 360/numObjects;
	//creates for loop which creates ellipses
	for (var i=0;i<numObjects ;i++) {
	angle = frameCount;
	//makes the distance between the ellipses change according to mouseX
	distance = sin(radians(mouseX))*150;
	var posX = centerX + distance *cos( radians(angleObject*i + angle) );
	var posY = centerY + distance *sin( radians(angleObject*i + angle) );
		//creates different curves and lines
		//makes one curve grow in width depending on mouseY
		//changes size of curves based on var posX and posY
		fill(255, 0, 0, 0);
		ellipse(posX, posY, 10, 10);
		stroke(255, 0, 0, 40);
		strokeWeight(1);
		line(centerX, centerY, posX, posY);
		line(centerX, centerY, posX-100, posY-100);
		line(centerX, centerY, posX+100, posY+100);
	 	//ellipse(posX, posY, mouseY, 100);
		ellipse(posX, posY, 200, 200);
	}
}

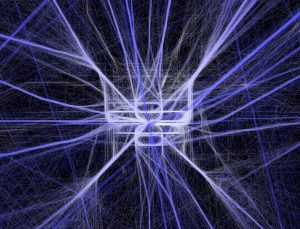
I really enjoyed making this project and playing with the different parameters of the curves. I tried to make something resembling a rotating planet/orb.

hannahk2-LookingOutwards-07

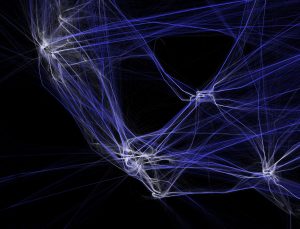
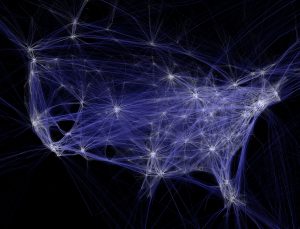
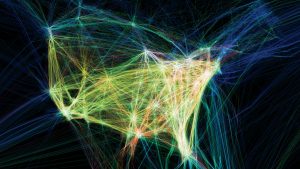
The project I chose for this week is “Flight-Patterns” by artist, Aaron Koblin. It is a computational information visualization project created as a series of experiments for the project, “Celestial Mechanics”. The project basically takes paths of air traffic over North America, and visualizes them in color and form, creating luminescent cotton-like webs of light and paths. To make this project, FAA data was parse and plotted using the Processing programming environment. I admire this project because the artist was able to take something as mundane and repetitive as flight paths, and turn them into a stunning visual map. The lines look like the thinnest strands of thread and resemble the shape of the united states. I can see the artists’ creative sensibilities manifesting in the work, because seeing his other works he is obviously drawn to fragile and delicate, complex and elegant lines. I am also extremely amused by his project, The Single Lane Superhighway, in which he invites visitors of his website to draw a car facing right, using a simple drawing tool he created. After reaching 50,000 cars, he compiled them to drive on a never ending parade on a single line. I thought this was really cute.

http://www.aaronkoblin.com/project/flight-patterns/

http://www.aaronkoblin.com/project/the-single-lane-superhighway/

hannahk2-Project-06

sketch

//Hannah Kim
//Section A
//hannahk2@andrew.cmu.edu
//Assignment-06-A

function setup() {
    createCanvas(550, 550);
    background(0);
}

function draw() {
	var H = hour();
    var M = minute();
    var S = second();

noStroke();
fill(200, 200, 250, 10);
//top hourglass
triangle(156, 98, 259, 257, 364, 98);
//bottom hourglass
triangle(156, 420, 259, 257, 364, 420);

//top sand
fill(255, 255, 250, 20)
triangle(216, 174, 258, 244, 304, 173);
//bottom sand
quad(198, 366, 170, 410, 350, 410, 319, 366);

//top sand circle
fill(0);
ellipse(260, 175, 86, 10);
//bottom sand circle
ellipse(259, 368, 120, 12);

//maps dot y coordinate and color based on second and day
var doty = map(S, 0, 59, 260, 368);
var dotcolor = map(H, 0, 23, 0, 255)

fill(0, 0, 255);
ellipse(259, doty, 2, 2);

}

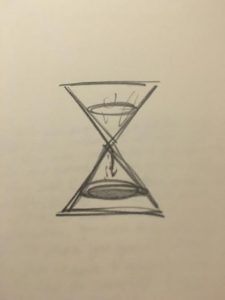
I really enjoyed thinking of ways to show time in an abstract manner. I chose ultimately to create a representation of an abstract method of showing time, a stylized hour glass.

hannahk2-LookingOutwards-06

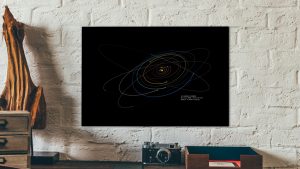
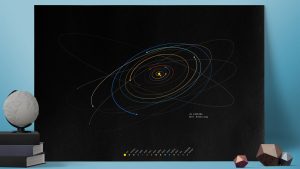
This week I chose a project by a company, “Spacetime Coordinates”. It is an art project that brings a personalized map of the positions of the planets at the calculated day of one’s birth. The company extracts NASA data and algorithms to compute the random positions of the planets to create a customized print. The company has created minimal style posters in the colors of dark blue, black, and white. I think what is really great about this project is the fact that no two date entries provide the same map. It is amazing how you can plug in a random date and see the snapshot of the solar system of that day, visualized into a minimal map. The style of the posters are very simple, with thin colored curves resembling orbits and small circles representing planets. The company has also created 3D printed metal casted sculptures which present personal planetary information. All of their works seem interested in displaying unique and personalized planetary positions, and are all made in a minimal style.

images of the poster


http://www.thisiscolossal.com/category/science/

hannahk2-Project-05

sketch            

//Hannah Kim
//Section A
//hannahk2@andrew.cmu.edu
//Project-05

function setup() {
    createCanvas(590, 390);
    noStroke();
}
 
function draw() {
    background(224, 206, 163);
    drawGrid();
    noLoop(); 
}
function drawGrid() {
        //ears
        for (var y = 50; y < height + 50; y += 100) {
        for (var x = 50; x < width + 50; x += 100) {
            var r = map(y, 0, 400, 100, 200);
            var g = map(x, 0, 600, 200, 100);
            strokeWeight(5);
            stroke(r, g, 8);
            fill(224, 206, 163);
            //left ear
            triangle(x-30, y, x-40, y-45, x-10, y-20);
            //right ear
            triangle(x+10, y, x+20, y-45, x-10, y-20);
        }
    }
        //drop shadow
        for (var y = 50; y < height + 50; y += 100) {
        for (var x = 50; x < width + 50; x += 100) {
            //gradates color using mapping
        	var r = map(y, 0, 400, 200, 100);
        	var g = map(x, 0, 600, 200, 100);
            noStroke();
        	fill(r, g, 200);
            ellipse(x, y, 70, 70);
        }
    }
        //face
        for (var y = 50; y < height + 50; y += 100) {
        for (var x = 50; x < width + 50; x += 100) {
        	var r = map(y, 0, 400, 100, 200);
        	var g = map(x, 0, 600, 200, 100);
        	fill(r, g, 8);
            ellipse(x-10, y-10, 70, 70);
        }
    }
        //left eye
        for (var y = 50; y < height + 50; y += 100) {
        for (var x = 50; x < width + 50; x += 100) {
        	var r = map(y, 0, 400, 100, 200);
        	var g = map(x, 0, 600, 100, 200);
        	fill(0);
            ellipse(x-20, y-10, 10, 10);
            //pupil
            fill(255);
            ellipse(x-21, y-12, 2, 2);

            //right eye
            fill(0);
            ellipse(x, y-10, 10, 10);
            //pupil
            fill(255);
            ellipse(x-1, y-12, 2, 2);
        }
    }
        //nose
        for (var y = 50; y < height + 50; y += 100) {
        for (var x = 50; x < width + 50; x += 100) {
            fill(0);
            arc(x-10, y, 5, 5, 0, PI, PIE);
        }
    }

}


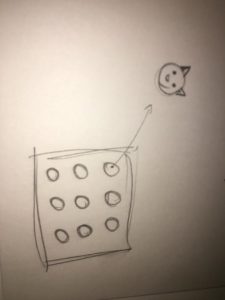
This project was kind of fun for me but not really because I dont really enjoy making pattern-based work, but it got me even more familiar with loops which I still seem to be struggling with.

hannahk2-LookingOutwards-05

Walking City from Universal Everything on Vimeo.

The 3D graphics project that I chose to discuss is “Walking City” by Universal Everything. The project is an evolving video sculpture which slowly and constantly changes its form through many permutations. The only thing that remains constant in the video are the colors, and the core motion/act of walking. The project references the utopian visions of 1960’s architecture practice, Archigram. The video aims to capture the patterns seen in the radical architectural transformations. Though 3D motion graphics usually bore me, I am pretty captivated by the delicate transitions from form to form. I really appreciate how the artist actually made me anticipate each transformation, and how much character each “version” gave to the walking figure. I am really not sure how the creators rendered or generated this work, but I assume that it is some 3D modeling program combined with mathematical algorithms to create the perfectly geometrical shapes. The artist’s sensibilities are manifested in the work seeing the way that it is so uniquely clean, monochromatic, and geometric.

hannahk2-Project-04


sketch

//Hannah Kim
//Section A
//hannahk2@andrew.cmu.edu
//Project-04

function setup() {
    createCanvas(300, 400);
}
function draw() {
  background(0);

//make rows of lines stemming from the center
//change opacity of lines to give glowing effect
for (var lineW = 50; lineW < 250; lineW += 8) {
	stroke(143, 204, 51, 85);
      line(150, 200, lineW, 50);
  }
for (var lineW = 50; lineW < 250; lineW += 8) {
	stroke(114, 163, 41, 90);
      line(150, 200, lineW, 100);
  }
for (var lineW = 50; lineW < 250; lineW += 8) {
	stroke(86, 122, 31, 95);
      line(150, 200, lineW, 150);
  }
for (var lineW = 50; lineW < 250; lineW += 8) {
    //use map function to make middle row of lines
    //lines move up and down if mouse moves up and down
		var lineY = map(mouseY, 0, 200, 0, 400);
		stroke(59, 92, 10);
     	line(150, 200, lineW, lineY);
  }
for (var lineW = 50; lineW < 250; lineW += 8) {
	stroke(86, 122, 31);
      line(150, 200, lineW, 250);
  }
for (var lineW = 50; lineW < 250; lineW += 8) {
	stroke(114, 163, 41);
      line(150, 200, lineW, 300);
  }
for (var lineW = 50; lineW < 250; lineW += 8) {
	stroke(143, 204, 51);
      line(150, 200, lineW, 350);
  }
}


My goal for this project was really just to get comfortable using the for loop function. I really wanted to create a laser-esque feeling effect by using layers of string groups and making one “scan” from the top of the canvas to the bottom.

hannahk2-LookingOutwards-04

“Soft Sound” is a research pioneered by EJTECH (Esteban de la Torre and Judit Eszter Kárpáti) that brings together textiles and sound, and explores possibilities of enhancing multi-sensory experiences. I admire this project because it achieves its goal of using textile as an audio emitting surface. The artists created soft speakers and embedded it into fabric in order for it to emanate sonic vibrations, allowing viewers to perceive the audio through both hearing and touch. The viewers can perceive the audio through touch because due to the pulsating nature of the sound, the host textile will throb. By creating shapes of flat copper and silver coils, vinyl cutting and applying them onto different textile surfaces, and then running an alternating current through them, the artists created the speakers. They are connected to amplifiers and a permanent magnet in order to force the coil back and forth, allowing the textile attached to move back and forth and create enhanced sound waves. The artists’ sensibilities are clearly manifest in the final form, seeing the way the simple, crisp and geometric printed shapes on fabric resemble the visual language present in their other works. This project is extremely admirable to me because it displays a non physical entity as something tangible and physical, and seeing a small piece of cloth moving and creating sound is just really amazing to me.


Soft Sound for TechTextil – Sounding Textile series from ejtech on Vimeo.

link:http://www.creativeapplications.net/sound/soft-sound-textiles-as-electroacoustic-transducers/

Hannahk2-Project03-DynamicDrawing

sketch

//Hannah Kim
//Section A
//hannahk2@andrew.cmu.edu
//Assignment-01

function setup() {
  createCanvas(600, 600);
}

function draw() {
  background(0, 0, 0);

//background color change
//as mouse moves down, color changes from blue 
//to lighter blue
    var Rc = map(mouseY, 0, height, 200, 260);
    var Gc = map(mouseY, 0, height, 240, 255);
    var Bc = map(mouseY, 0, height, 250, 255);

    noStroke();
    fill(Rc, Gc, Bc);
    rect(0, 0, 600, 600);

//circle background color change
//as mouse moves down, color changes from white
//to blue
    var circSize =map(mouseY, 0, height, 0, 400);
    var Rc1 = map(mouseY, 0, height, 260, 200);
    var Gc1 = map(mouseY, 0, height, 255, 240);
    var Bc1 = map(mouseY, 0, height, 255, 250);
noStroke();
fill(Rc1, Gc1, Bc1);
ellipseMode(CENTER);
ellipse(294, 242, circSize, circSize);

//top chopstick
var topChop = map(mouseY, 0, 400, 92, 300);
stroke(198, 58, 61);
strokeWeight(9);
line(27, 60, 291, topChop);

//noodle 1
var nood1 = map(mouseY, 0, 400, 76, 310);
stroke(221, 215, 153);
strokeWeight(6);
line(240, nood1, 240, 311);

//noodle2
var nood2 = map(mouseY, 0, 400, 76, 312);
stroke(221, 215, 153);
strokeWeight(6);
line(252, nood1, 253, 313);

//noodle3
var nood3 = map(mouseY, 0, 400, 76, 312);
stroke(221, 215, 153);
strokeWeight(6);
line(266, nood3, 266, 316);

//bottom chopstick
var bottomChop = map(mouseY, 0, 400, 107, 310);
stroke(198, 58, 61);
strokeWeight(9);
line(5, 111, 292, bottomChop);

noStroke();
//draw ramen cup
fill (233, 231, 226);
rect (164, 261, 272, 8);
quad (175, 275, 210, 560, 386, 561, 428, 277);
noStroke();
arc(297, 561, 176, 10, TWO_PI, PI);

//draw top row of yellow marks
fill(194, 198, 89);
rect(182, 300, 3, 24);
rect(188, 300, 3, 24);
rect(194, 300, 3, 24);
rect(200, 301, 3, 24);
rect(207, 301, 3, 24);
rect(214, 302, 3, 24);
rect(222, 302, 3, 24);
rect(230, 302, 3, 24);
rect(239, 303, 3, 24);
rect(248, 303, 3, 24);
rect(257, 303, 3, 24);
rect(267, 304, 3, 25);
rect(277, 304, 3, 25);
rect(287, 304, 3, 25);
rect(297, 304, 3, 25);
rect(307, 304, 3, 25);
rect(317, 303, 3, 25);
rect(326, 303, 3, 24);
rect(335, 303, 3, 24);
rect(344, 303, 3, 24);
rect(352, 303, 3, 24);
rect(361, 303, 3, 24);
rect(369, 303, 3, 24);
rect(377, 303, 3, 24);
rect(385, 302, 3, 24);
rect(392, 302, 3, 24);
rect(399, 301, 3, 24);
rect(405, 300, 3, 24);
rect(411, 300, 3, 24);
rect(417, 300, 3, 24);

//draw bottom row of yellow marks
fill(194, 198, 89);
rect(207, 501, 3, 24);
rect(214, 502, 3, 24);
rect(222, 502, 3, 24);
rect(230, 502, 3, 24);
rect(239, 503, 3, 24);
rect(248, 503, 3, 24);
rect(257, 503, 3, 24);
rect(267, 504, 3, 25);
rect(277, 504, 3, 25);
rect(287, 504, 3, 25);
rect(297, 504, 3, 25);
rect(307, 504, 3, 25);
rect(317, 503, 3, 25);
rect(326, 503, 3, 24);
rect(335, 503, 3, 24);
rect(344, 503, 3, 24);
rect(352, 503, 3, 24);
rect(361, 503, 3, 24);
rect(369, 503, 3, 24);
rect(377, 503, 3, 24);
rect(385, 502, 3, 24);

//draw red background for middle logo 
fill(198, 58, 61);
rect(272, 354, 79, 58);
arc(346, 374, 50, 40, PI+QUARTER_PI, HALF_PI);
ellipseMode(CENTER);
ellipse(263, 383, 59, 63);
quad(197, 408, 204, 462, 392, 465, 398, 408);
ellipse(248, 437, 59, 63);
ellipse(278, 437, 59, 63);

//draw text for cup
textSize(50);
textStyle(BOLD);
fill(255, 255, 255);
text("CUP", 248, 400);

//draw text for noodles
textSize(38);
textStyle(BOLD);
fill(255, 255, 255);
text("NOODLES", 203, 450);

//draw nissin logo with text
fill(177, 27, 38);
arc(208, 357, 36, 38, PI, TWO_PI);
textSize(8);
fill(255, 255, 255);
text("NISSIN", 195, 354);

//bottom red line
strokeWeight(1);
stroke(198, 58, 61);
line(210, 535, 386, 536);

//top red line
line(175, 289, 428, 291);

//white shine on cup
fill(255, 255, 255, 90);
noStroke();
quad(373, 272, 348, 568, 375, 564, 407, 272);
}


This project was pretty fun for me, though I did not know where to start with the commands and which commands to choose to make my code do what I wanted it to do. I enjoyed creating the cup of noodles especially, since I always eat cup noodles.

Hannah Kim-Looking Outwards-03

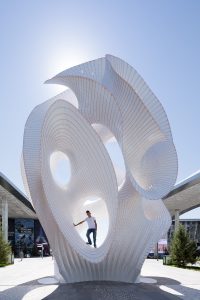
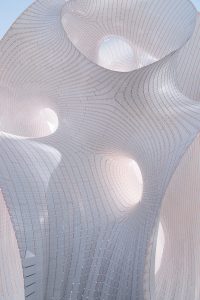
Minima | Maxima is computer science connoisseur Marc Fornes’s latest project, commissioned by World Expo 2017 in Astana, Kazakhstan. Fornes has placed himself at the forefront of computational design in the last 15 years, as well as the digital prototyping of large scale, self supporting structures. His studio is deeply rooted in the development of computational protocols and digital fabrication. This particular project involves a building system in which custom designed parts form complex, self-supporting curving surfaces. The project has an impressive height of 43 feet, yet the core material used to build the structure are simply 2mm strips of aluminum. The strips are constructed in only 3 layers in tandem, and support one another as they gain curvature and height. This project is extremely impressive to me because of the fact someone can make a huge, voluminous form that people can walk on, out of 2 mm triple layered aluminum sheets. I think the concept that one layer can’t exist independently, yet contributes and supports the structure as a whole is pretty great. Watching the video of the structure being built, it was shocking seeing the structure blowing in the wind while being built up, and then seeing the final, sturdy complete structure. I realized Fornes’s sensibilities as an artist are present in all of his computationally fabricated works, after seeing his website. His works are geometric and organic, and seemingly impossible.

images and close up of the sculpture

The Stripes Effect from MARC FORNES / THEVERYMANY on Vimeo.

link:http://www.thisiscolossal.com/2017/09/a-towering-4-story-organic-structure-built-from-material-as-thin-as-a-coin-by/