![[OLD FALL 2017] 15-104 • Introduction to Computing for Creative Practice](../../../../wp-content/uploads/2020/08/stop-banner.png)
//Hanna Jang
//Section B
//hannajan@andrew.cmu.edu
//Project-07

var numberPoints=200;

function setup() {
	createCanvas(420, 420);
	frameRate(15);
}

function draw() {

//map the color background changes using r, g, b  and mouse
	var r=map(mouseX, 0, width, 0, 255);
	var g=map(mouseY, 0, height, 0, 90);
	var b=map(mouseX, 0, width, 0, 250);
	background(r, g, b, 30);

	//stroke
	stroke(240, 174, 231);
	strokeWeight(0.3);

	translate(width/2, height/2);
	drawEpitrochoid();
}

function drawEpitrochoid() {
	var x;
	var y;
	var h=100;
	var theta;

//variables to help modify change using mouse
	var a=map(mouseX, 0, width, 0, 20);
	var b=map(mouseY, 0, height, 0, 40);

//draw outer epitrochoid
	beginShape();
	for(var i=0; i<numberPoints; i++) {
		theta=map(i, 0, width/2, 0, 360);
		x = (a + b) * cos(theta) - h * cos(((a + b)/b) * theta);
       y = (a + b) * sin(theta) - h * sin(((a + b)/b) * theta);

 vertex(x, y);
	}
endShape();
}
I started this project by looking through the different mathematical curves on the Mathworld curves site. I stumbled upon a specific curve named Epitrochoid that I really liked. It reminded me of a shape of a flower, which is why my project is themed around pink, to give it a pink flower look.
I wanted the background to also change as according to the mouse movement, which is why I also made maps for the different R, G, B variables. It was a bit hard to understand how I wanted the mouse to interact with the different variables of the functions, but once I made maps to form relationships with the mouse and variables a and b, I was set.
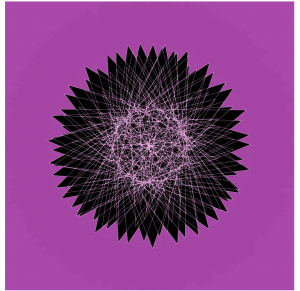
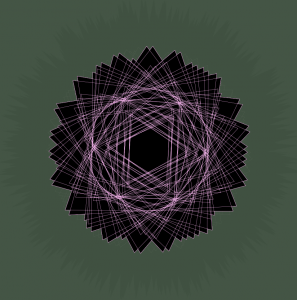
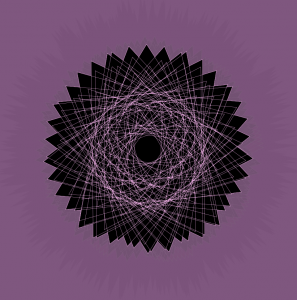
(Shown above are examples of different Epitrochoid patterns and sizes according to the movement of mouse)
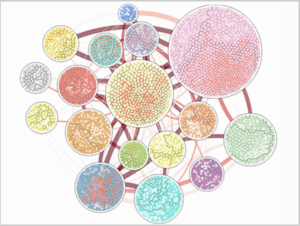
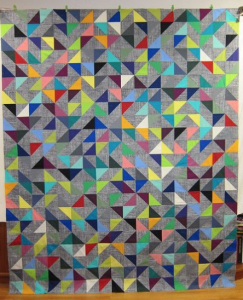
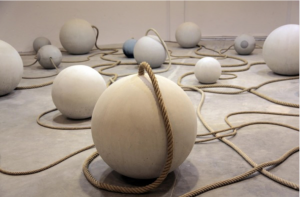
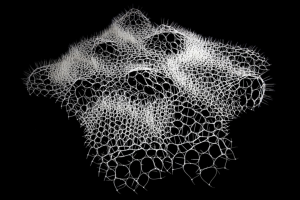
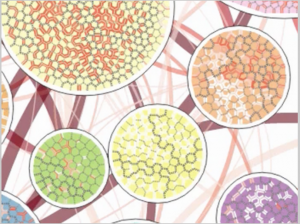 (Above are pictures of the Vorograph of Cody Dunne, Michael Muller, Nicola Perra, Mauro Martino, 2015)