hdw/tlai – Final Project

https://helenxwu.github.io/ –> link to game

https://drive.google.com/a/andrew.cmu.edu/file/d/1NQmUsm_kBniAq7vku2QIYw7QzBkgUOP_/view?usp=sharing –> link to zip file

How to run zip:
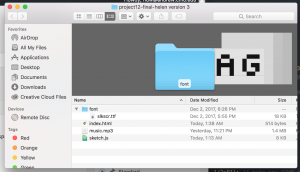
1) download file
2) move to desktop
3) open zip folder

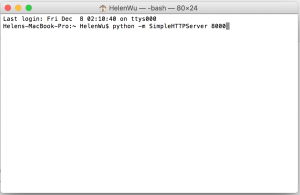
4) On mac– open terminal (command+space and search “terminal”)

5) type in “python -m SimpleHTTPServer 8000”

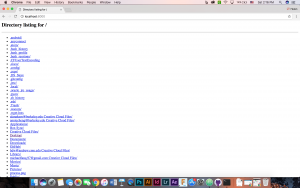
6) go to browser–type in localhost:8000 where the URL would usually go

7) find desktop listing and click on it
8) find downloaded folder and click on it
9) file will load! 🙂

For our final project, Tiffany and I made a dance dance revolution game to the Mii remix. We delved into an entirely new library (the p5js sound extension) and learned a lot about different techniques for signal processing. For the main sound visualizer, we used Fast Fourier Transform algorithm (FFT) to sample the music files’ signals over a period of time, and divided its frequency components to create the bouncing colors that react and move according to note and rhythm.

Additionally, we mapped the volume controls to create new objects under an object function, to randomly generate 4 different types of arrows. We then set a range for the function to work under so the score counter could add points. We also created a start screen and end screen for the game under two separate functions.

hdw – Project 12 – Proposal

I will be working with classmate Tiffany LAi from Section A. 

I was inspired by one of my favorite arcade games, Dance Dance Revolution, and I thought it would be interesting to create something similar using the arrow keys. Essentially, the player will hit the arrow keys to the beat of a song while arrows move up (see picture). We are hoping to generate arrow keys based on the frequency/volume of the beat to create an entertaining game. I want to find a way to keep track of highest scores as well. 

hdw – Looking Outwards 10

This week, I’ve looked at the work of Claudia Hart. Hart is an artist who creates computational art through a feminist standpoint. She looks at digital technology and media, and shows that new media technology is not a “rupture, but a reflection of very conventional ways of thinking”.

Tech culture is still a space dominated by men, and interestingly cites David Noble, who says that “high tech ethos is actually emerging from medieval Christian monasteries and describes it still being driven by an unconscious millennial desire to recreate the world afresh, without women and outside of nature.”


The Doll’s House Process work

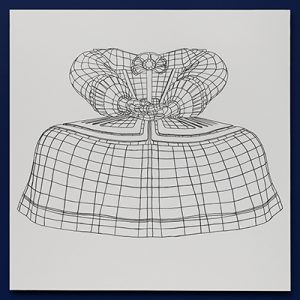
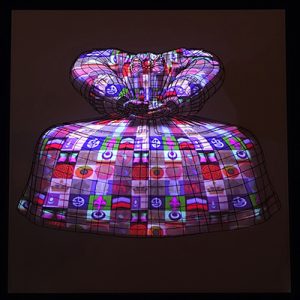
These images are from Hart’s project called The Dolls House. It uses the philosophical concept of rebirth and renewal, and used math to create hyptonic images. You can see more here.

hdw – Project 10 – Landscape

sketch

var terrainSpeed = 0.0005;
var terrainDetail = 0.005;

function setup() {
    createCanvas(480, 480);
    frameRate(10);
}


function draw(){
  background(0, 29, 76);

//draw sun
  sun();

//draw landscape
    noStroke()
    fill(44, 0, 206);
    beginShape();
    for (var x = 0; x < width; x++) {
      var u = x * terrainDetail + millis() * terrainSpeed;
      //restrict map to bounded range
      var y = map(noise(u), 0,1, 110, height/2);
      //bring waves up
      vertex(x,y+100);
    }
    vertex(width,height);
    vertex(0,height);
    endShape();

//draw the lines in the front of the landscape
    for (var k = 0; k < 30; k++){
    stroke(255);
    beginShape();
    for (var x = 0; x <width*5; x++) {
      var u = x * terrainDetail + millis() * terrainSpeed;
      var y = map(noise(u), 0,1, 110, height/2);
      //make lines start left of each other, y modified to start beyond canvas
      vertex(x-5*k,y+100+5*k);
    }
    vertex(width*5,height);
    vertex(0,height);
    endShape();
}
}

//draw sun
function sun() {
  fill(255, 59, 0);
  ellipse(240,290,400,400);
  //white circle outlines
  for (var j = 0; j < 36; j++){
  noFill();
  stroke(255);
  strokeWeight(1);
  ellipse(240,290,400 + 10*j,400 + 10*j);
  }
}

This was kinda hard so I kept it simple. I have an object sun in the back, and layered the foreground to create a sense of depth, instead of doing so with different colors.

hdw – Looking Outwards – 09

This week I’m responding to this post.

I agree with my classmate’s assessment of the artist’s work. His/her work (the artist is anonymous) is really interesting because the terrains would be almost imperceptible in its artificiality, except the artist chose to add a 3-D rendered geometrically altered shape. This artistic choice made its synthetic nature obvious to the viewer. I wonder if that strengthened the artist’s purpose of creating new terrains, or if it compromised the level of realism in the terrain because of how it revealed the terrain was graphically fabricated. Nonetheless, the level of detail is awesome and a lot of attention was paid to the craft of the code. You can see more examples of the artist’s work here.


Beautifully fabricated image.

hdw – Looking Outwards – 08

This week I watched the Eyeo Festival video on Policy Brutality in Ferguson from 2015. In the video, Deray Mckesson and Samuel Simyang-we, two advocates for Black Lives Matter, explained how they used informational graphics and data visualization to communicate the exigency of their issue on Twitter platform. Together, they collected and researched data from news articles online and mapped out the location of where each victim was killed on a map, allowing users to further qualify the data set with information about each victim’s age and given cause of death.
Mckesson and Simyang-we discussed how effective data visualization is as a tool for creating systematic change because it appeals to all audiences. It doesn’t matter if the presenter’s audience is for various grassroots organizations, for various policy-makers, or for the general public, the information is digestible and easy for the audience to connect with and process. Before releasing this data and sparking this trend of mapping out race-related police information, many people were not aware of how widespread the issue was. However, after a period of a few months, general public opinion had shifted with over millions of people convinced that policy brutality is a systematic issue.

hdw – Looking Outwards – 07

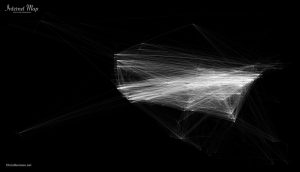
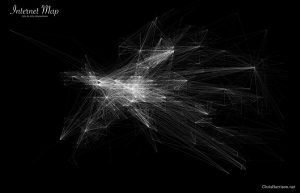
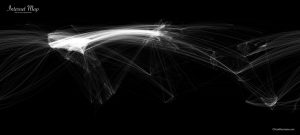
Chris Harrison did a really cool project on internet maps, where he compared internet connectivity of the world, and focused in on North America and Europe especially, as they had the most connections between each other.

Logistically, he mapped out the locations of connectivity by nearest whole number in a coordinate system. The brighter the point, the more points of connectivity there is. Harrison himself says that this approach probably is not indicative of users, as one point of connectivity can have multiple users. However, he chose the data and representation style based on an aesthetic approach, as there are already many other practically modeled ones existing. You can read more about it here.


Internet connectivity of Europe


Internet connectivity of North America


Internet connectivity of the World

I love how delicate the lines are and how orderly the grids look, zoomed in. Because Harrison rounded connectivity locations to nearest longitude and latitude, it looks like it follows a coordinate grid system. The contrast between order and chaos gives the appearance of string art.

hdw – Project 7 – Curves

sketch

//Helen Wu
//Section A
//hdw@andrew.cmu.edu
//Project 7

function setup() {
    createCanvas(480,480);
    background(255, 71, 123)
}


function draw() {
  push();

  //this is to call the centers of which the sextic functions will be called from
  translate(width/2, height/2);
  beginShape();
  for(var i = 0; i < 25; i++){
    //25 sets the direction of which the curves draw
      var t = map(i,0,100,0,360);
      //t = angle
      var a = map(mouseY, 0, 480, -5, 5);
      //a = control the curvature of the loops
      var x = 4*a*(Math.pow(cos((1/3)*t),3))*cos(t);
      var y = 4*a*(Math.pow(cos((1/3)*t),3))*sin(t);
      //centerX and centerY = center of smaller curves
      var centerX = 10*x
      var centerY = 10*y
  }
  endShape(CLOSE);
  pop();


//drawing below sextics on points along above sextic
  cayleysSextic(centerX, centerY);
  }

function cayleysSextic(centerX,centerY) {
  push();
  //placement of sextics along center
  translate(width/2+centerX,height/2+centerY);
  beginShape();
  for(var i = 0; i < 50; i++){
      //t = angle
      var t = map(i,0,100,0,360);
      //a = control the curvature of the loops
      var a = map(mouseX, 0, 400, -10,10);
      var x = 4*a*(Math.pow(cos((1/3)*t),3))*cos(t);
      var y = 4*a*(Math.pow(cos((1/3)*t),3))*sin(t);
      //center of smaller loop's smaller curves
      noStroke()
      fill(255,255,255,30);
      ellipse(x*3,y*3,1,1);
      //drawing ellipses along the curve
  }
  endShape(CLOSE);
  pop();
}

This project was based on Cayley’s Sextic, which coincidentally looks like a butt. 👀👀

I mapped Cayley’s Sextic along another Cayley’s Sextic, just to see how it would look. I kind of like how cute the final product turned out to be. The centers of one are along the next, both mapped to the mouse position on the canvas.

hdw – Looking Outwards – 06

Daniel Brown is a designer, coder and artist for commission that takes on a variety of projects. One of his jobs was to create a visual display for Selfridge’s in London. In his work called “Appliqué”, he made a fractal textile fabric with generative code. It’s randomized, and never repeats itself. It seems like the code would have a lot of recursive functions that calls itself in for-loops to establish the relationship from one part of the textile to the next. Daniel Brown was inspired by traditional embroidery heritage and working with fabrics and textiles, so his work was made to imitate the movement and texture of the fabric. You can see more of his work here.

Above are some shots of his display.

hdw – Project 6 – Abstract Clock

sketch

//Helen Wu
//hdw@andrew.cmu.edu
//Project 6
//Section A

function setup() {
    createCanvas(480, 480);
    angleMode(DEGREES);
}

function draw() {

  var rSpring = 180
  var gSpring = 299
  var bSpring = 123

  var rSummer = 255
  var gSummer = 224
  var bSummer = 114

  var rFall = 255
  var gFall = 191
  var bFall = 135

  var rWinter = 255
  var gWinter = 107
  var bWinter = 107

  var season = month()

  //set colors of tree outline to month

  if (season == 3 || 4 || 5){
    var r = rSpring;
    var g = gSpring;
    var b = bSpring;
  }

  if (season == 6 || 7 || 8){
    var r = rSummer;
    var g = gSummer;
    var b = bSummer;
  }

  if (season == 9 || 10 || 11){
    var r = rFall;
    var g = gFall;
    var b = bFall;
  }

  if (season == 12 || 1 || 2){
    var r = rWinter;
    var g = gWinter;
    var b = bWinter;
  }

  //background changes with respect to hour.
  //from = color(206, 242, 255), to = color(255, 198, 220)
  var proportion = hour()/60;
  background(206+49*proportion,242-44*proportion,255-35*proportion);

  //draw trees
  tree1(-35,115,200,r,g,b)
  tree3(115,115,200,r,g,b)
  tree2(-185,115,200,r,g,b)
  tree2(265,115,200,r,g,b)

  tree1(width-190,height-200,100,r,g,b);
  tree2(width-340,height-200,100,r,g,b);
  tree3(width-490,height-200,100,r,g,b);

}

//set strokeWeight 's'
var s = 3

//falling leaf pattern 1
function tree1(x,y,a,r,g,b) {
  push();
  translate(x,y);

  //tree outline is mapped with respect to minutes.
  strokeWeight(s);
  var minutes = minute();
  if ((minutes+3)%3==1){
    noFill();
    stroke(r, g, b);
    //stroke(180,229,123)
  }  else {
  noFill();
  stroke(255,255,255);
  }
  ellipse(a,a-a*50/240, a*300/240, a*350/240);

  //tree branches.
  stroke(255, 255, 255);
  strokeWeight(s)

  line(a, a/3, a, a*400/240);
  line(a, a*187/240, a+a/3, a*100/240);
  line(a, a*294/240, a-a/3, a*200/240);


  //falling leaves are drawn; color and position changes with seconds.
  noStroke();
  var seconds = second();
  var r = a/5-a/24

  //right side leaves
  if ((seconds+4)%4==0){
    fill(180, 229, 123);
    arc(a+a/3, a*10/24, r, r, 240, 20);
  }

  if ((seconds+4)%4==1){
    fill(255, 224, 114);
    arc(a+a/3+a/24, a*200/240, r, r, 340, 120);
  }

  if ((seconds+4)%4==2){
    fill(255, 191, 135);
    arc(a+a/3-a/8, 5*a/4, r, r, 60, 200);
  }

  if ((seconds+4)%4==3){
    fill(255, 107, 107);
    arc(a+a/3, a*400/240, r, r, 340, 120);
  }


  //left side leaves
  if ((seconds+3)%3==0){
    fill(180, 229, 123);
    arc(a-a/3, a*200/240, r, r, 160, 300);
  }

  if ((seconds+3)%3==1){
    fill(255, 191, 135);
    arc(a-a/3+a/8, a*300/240, r, r, 340, 120);
  }

  if ((seconds+3)%3==2){
    fill(255, 107, 107);
    arc(a-a/3-a/48, a*400/240, r, r, 340, 120);
  }
  pop();
}

//falling leaf pattern 2
function tree2(x,y,a,r,g,b) {
  push();
  translate(x,y);

  //tree outline is colored with respect to minutes.
  strokeWeight(s);
  var minutes = minute();
  if ((minutes+3)%3==2){
    noFill();
    stroke(r, g, b);
    //stroke(180,229,123)
  }  else {
  noFill();
  stroke(255,255,255);
  }
  ellipse(a,a-a*50/240, a*300/240, a*350/240);

  //tree branches.
  stroke(255, 255, 255);
  strokeWeight(s)

  line(a, a/3, a, a*400/240);
  line(a, a*187/240, a+a/3, a*100/240);
  line(a, a*294/240, a-a/3, a*200/240);

  //falling leaves are drawn; color and position changes with seconds.
  noStroke();
  var seconds = second();
  var r = a/5-a/24

  //right side leaves
  if ((seconds+4)%4==1){
    fill(180, 229, 123);
    arc(a+a/3, a*10/24, r, r, 240, 20);
  }

  if ((seconds+4)%4==2){
    fill(255, 224, 114);
    arc(a+a/3+a/24, a*200/240, r, r, 340, 120);
  }

  if ((seconds+4)%4==3){
    fill(255, 191, 135);
    arc(a+a/3-a/8, 5*a/4, r, r, 60, 200);
  }

  if ((seconds+4)%4==0){
    fill(255, 107, 107);
    arc(a+a/3, a*400/240, r, r, 340, 120);
  }


  //left side leaves
  if ((seconds+3)%3==1){
    fill(180, 229, 123);
    arc(a-a/3, a*200/240, r, r, 160, 300);
  }

  if ((seconds+3)%3==2){
    fill(255, 191, 135);
    arc(a-a/3+a/8, a*300/240, r, r, 340, 120);
  }

  if ((seconds+3)%3==0){
    fill(255, 107, 107);
    arc(a-a/3-a/48, a*400/240, r, r, 340, 120);
  }
  pop();

}

//falling leaf pattern 3
function tree3(x,y,a,r,g,b) {
  push();
  translate(x,y);

  //tree outline is mapped with respect to minutes.
  strokeWeight(s);
  var minutes = minute();
  if ((minutes+3)%3==0){
    noFill();
    stroke(r, g, b);
    //stroke(180,229,123)
  }  else {
  noFill();
  stroke(255,255,255);
  }
  ellipse(a,a-a*50/240, a*300/240, a*350/240);

  //tree branches.
  stroke(255, 255, 255);
  strokeWeight(s)

  line(a, a/3, a, a*400/240);
  line(a, a*187/240, a+a/3, a*100/240);
  line(a, a*294/240, a-a/3, a*200/240);


  //falling leaves are drawn; color and position changes with seconds.
  noStroke();
  var seconds = second();
  var r = a/5-a/24

  //right side leaves
  if ((seconds+4)%4==2){
    fill(180, 229, 123);
    arc(a+a/3, a*10/24, r, r, 240, 20);
  }

  if ((seconds+4)%4==3){
    fill(255, 224, 114);
    arc(a+a/3+a/24, a*200/240, r, r, 340, 120);
  }

  if ((seconds+4)%4==0){
    fill(255, 191, 135);
    arc(a+a/3-a/8, 5*a/4, r, r, 60, 200);
  }

  if ((seconds+4)%4==1){
    fill(255, 107, 107);
    arc(a+a/3, a*400/240, r, r, 340, 120);
  }


  //left side leaves
  if ((seconds+3)%3==2){
    fill(180, 229, 123);
    arc(a-a/3, a*200/240, r, r, 160, 300);
  }

  if ((seconds+3)%3==0){
    fill(255, 191, 135);
    arc(a-a/3+a/8, a*300/240, r, r, 340, 120);
  }

  if ((seconds+3)%3==1){
    fill(255, 107, 107);
    arc(a-a/3-a/48, a*400/240, r, r, 340, 120);
  }
  pop();

}

I chose to represent time with a forest. The leaves fall to seconds, the background color is mapped to hours of the day, and the tree outline rotates by minutes. The color of the trees correlate with seasons. At first I struggled with how to make this piece dynamic because my movement was very simple, so I created a recursion and repeated different tree patterns.